XRP Faces Downward Pressure—Is a Continued Decline Imminent?

As of April 18, 2025, XRP’s market performance shows signs of weakening, with technical indicators suggesting potential further losses. Traders are closely monitoring key support levels to gauge whether the current downtrend will persist. The cryptocurrency’s recent price action has raised concerns among investors, particularly in light of broader market volatility. Analysts are weighing in on whether this is a temporary correction or the start of a more sustained bearish phase for XRP.
XRP Price Dips Again
XRP price started another decline below the $2.20 zone, like Bitcoin and Ethereum. The price traded below the $2.150 and $2.120 levels to enter a bearish zone.
The price even spiked below $2.050 before the bulls appeared. A low was formed at $2.036 and the price is now consolidating losses. There was a minor increase above the $2.10 level. However, the bears were active near the 50% Fib retracement level of the downward move from the $2.184 swing high to the $2.036 low.
The price is now trading below $2.10 and the 100-hourly Simple Moving Average. On the upside, the price might face resistance near the $2.10 level. There is also a key bearish trend line forming with resistance at $2.10 on the hourly chart of the XRP/USD pair.
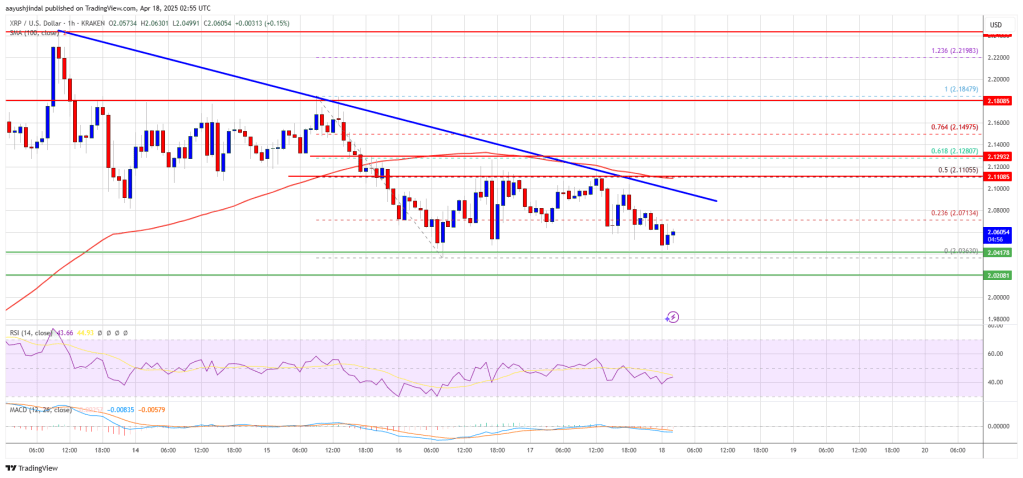
The first major resistance is near the $2.1280 level and the 61.8% Fib retracement level of the downward move from the $2.184 swing high to the $2.036 low. The next resistance is $2.1850. A clear move above the $2.1850 resistance might send the price toward the $2.250 resistance. Any more gains might send the price toward the $2.320 resistance or even $2.350 in the near term. The next major hurdle for the bulls might be $2.50.
More Losses?
If XRP fails to clear the $2.10 resistance zone, it could start another decline. Initial support on the downside is near the $2.040 level. The next major support is near the $2.00 level.
If there is a downside break and a close below the $2.00 level, the price might continue to decline toward the $1.920 support. The next major support sits near the $1.840 zone.
Technical Indicators
Hourly MACD – The MACD for XRP/USD is now gaining pace in the bearish zone.
Hourly RSI (Relative Strength Index) – The RSI for XRP/USD is now below the 50 level.
Major Support Levels – $2.040 and $2.00.
Major Resistance Levels – $2.10 and $2.1850.
