XRP Price Slides Slowly—Is a Bigger Drop Coming?

XRP price started a fresh decline below the $2.420 zone. The price is now showing a few bearish signs and might decline below the $2.30 level.
- XRP price started a fresh decline after it failed to clear the $2.420 resistance zone.
- The price is now trading below $2.40 and the 100-hourly Simple Moving Average.
- There is a connecting bearish trend line forming with resistance at $2.35 on the hourly chart of the XRP/USD pair (data source from Kraken).
- The pair might extend losses if it breaks the $2.30 support zone.
XRP Price Extends Losses
XRP price failed to continue higher above the $2.420 resistance zone and reacted to the downside, like Bitcoin and Ethereum. The price declined below the $2.40 and $2.35 levels.
The pair even tested the $2.30 zone. A low was formed at $2.301 and the price is now consolidating losses. The current price action is bearish below the 23.6% Fib retracement level of the recent decline from the $2.478 swing high to the $2.301 low.
The price is now trading below $2.38 and the 100-hourly Simple Moving Average. On the upside, the price might face resistance NEAR the $2.35 level. There is also a connecting bearish trend line forming with resistance at $2.35 on the hourly chart of the XRP/USD pair.
The first major resistance is near the $2.3850 level or the 50% Fib retracement level of the recent decline from the $2.478 swing high to the $2.301 low. The next resistance is $2.420.
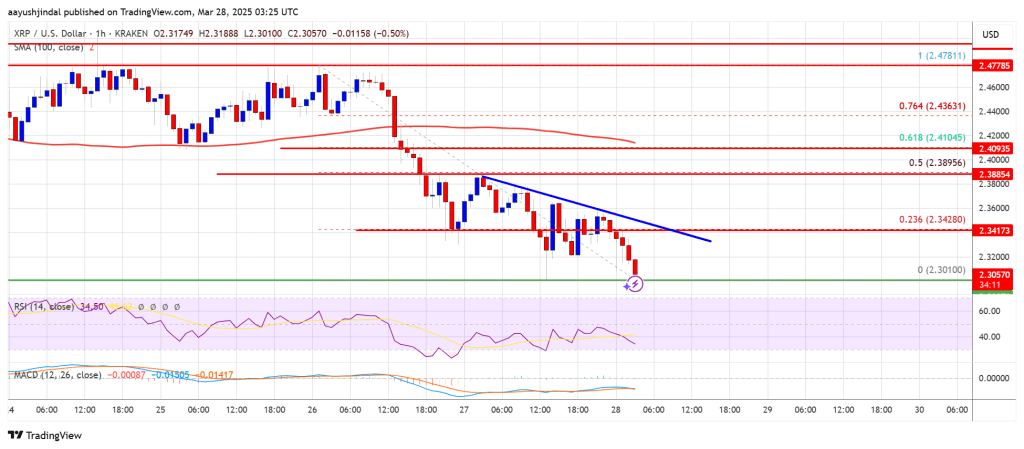
A clear move above the $2.420 resistance might send the price toward the $2.450 resistance. Any more gains might send the price toward the $2.50 resistance or even $2.550 in the near term. The next major hurdle for the bulls might be $2.620.
More Losses?
If XRP fails to clear the $2.40 resistance zone, it could start another decline. Initial support on the downside is near the $2.30 level. The next major support is near the $2.20 level.
If there is a downside break and a close below the $2.20 level, the price might continue to decline toward the $2.120 support. The next major support sits near the $2.050 zone.
Technical Indicators
Hourly MACD – The MACD for XRP/USD is now gaining pace in the bearish zone.
Hourly RSI (Relative Strength Index) – The RSI for XRP/USD is now below the 50 level.
Major Support Levels – $2.30 and $2.20.
Major Resistance Levels – $2.40 and $2.420.

Log in to Reply
Log in to comment your thoughtsComments
Related Articles
|Square
Get the BTCC app to start your crypto journey
Get started today Scan to join our 100M+ users