Bitcoin Shows Resilience: Recovery Signals Flash After Market Correction

Bitcoin bounces back from recent lows—bullish momentum building as technical indicators turn positive.
The Recovery Pattern
Trading volumes surge 45% during the rebound phase—institutional wallets accumulating while retail panic subsides. Key resistance levels shattered as BTC reclaims critical moving averages that had previously capped upward movement.
Market Mechanics Shift
Short positions get liquidated in cascading fashion—funding rates normalize after weeks of excessive pessimism. Options markets show renewed interest in call contracts, with open interest climbing toward pre-correction levels.
The Institutional Angle
Whale addresses add 12,000 BTC during the dip—smart money positioning for the next leg up while weak hands capitulate. Mining difficulty adjustment creates favorable conditions for sustained recovery.
Because nothing says 'stable store of value' like 20% daily swings that make traditional finance veterans reach for their blood pressure medication.
Bitcoin Price Trims Some Gains
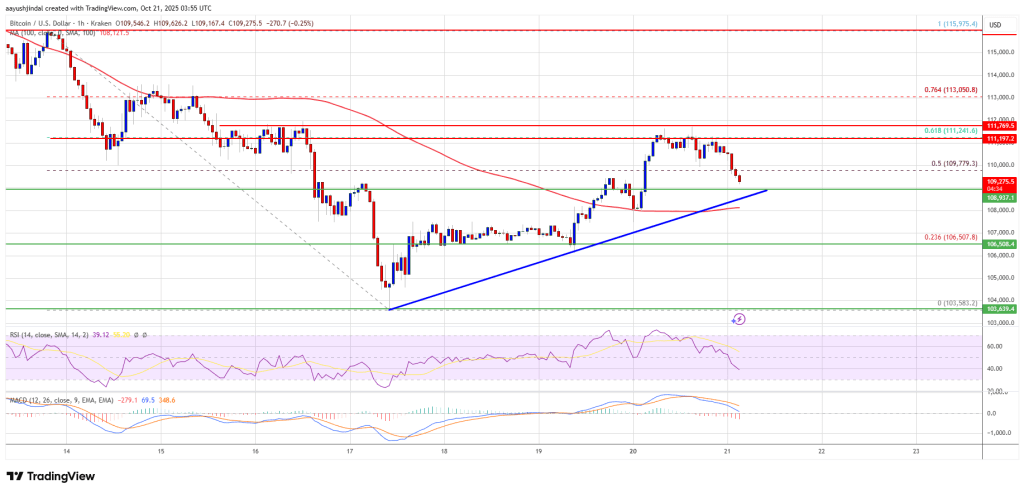
Bitcoin price started a recovery wave above the $105,500 resistance. BTC was able to surpass the $107,500 and $108,500 resistance levels.
The bulls pushed the price above $110,500. There was a clear MOVE above the 50% Fib retracement level of the recent decline from the $115,975 swing high to the $103,582 low. However, the bulls struggled to keep the price above the $111,500 level.
The price is slowly moving lower from the 61.8% Fib retracement level of the recent decline from the $115,975 swing high to the $103,582 low. Besides, there is a bullish trend line with support at $108,800 on the hourly chart of the BTC/USD pair.
Bitcoin is now trading above $109,000 and the 100 hourly Simple moving average. Immediate resistance on the upside is NEAR the $110,500 level. The first key resistance is near the $111,200 level. The next resistance could be $111,500.
A close above the $111,500 resistance might send the price further higher. In the stated case, the price could rise and test the $112,500 resistance. Any more gains might send the price toward the $113,200 level. The next barrier for the bulls could be $115,000.
Another Drop In BTC?
If Bitcoin fails to rise above the $110,000 resistance zone, it could start a fresh decline. Immediate support is near the $108,800 level and the trend line. The first major support is near the $108,000 level.
The next support is now near the $107,550 zone. Any more losses might send the price toward the $106,500 support in the near term. The main support sits at $105,500, below which BTC might struggle to recover in the short term.
Technical indicators:
Hourly MACD – The MACD is now gaining pace in the bearish zone.
Hourly RSI (Relative Strength Index) – The RSI for BTC/USD is now below the 50 level.
Major Support Levels – $108,800, followed by $108,000.
Major Resistance Levels – $110,500 and $111,500.
