Hidden Dogecoin Chart Pattern Could Trigger Massive Price Breakout: Analyst

Technical analysts are buzzing about a previously unnoticed pattern forming on Dogecoin's charts that could signal a major market shift.
The Hidden Signal
Chart technicians identified what they're calling a 'stealth accumulation pattern' that typically precedes explosive price movements. This formation suggests institutional money might be quietly positioning itself in the meme coin.
Pattern Recognition
The setup shows classic signs of a coiled spring - tight consolidation with decreasing volume, followed by subtle accumulation signals that most retail traders would miss. These patterns historically precede moves that 'change everything' about an asset's trajectory.
Market Implications
If the pattern plays out as historical precedents suggest, Dogecoin could be setting up for its most significant breakout since the 2021 retail frenzy. Because nothing says 'sound investment' like a Shiba Inu-themed cryptocurrency breaking technical analysis rules.
Traders are watching key resistance levels that, if broken, could trigger a domino effect across the entire meme coin sector. The charts are either predicting massive gains or just drawing pretty pictures - but in crypto, who can tell the difference?
CleanCore Expands Dogecoin Treasury
Reports have disclosed that CleanCore Solutions has been adding to its dogecoin holdings and now holds more than 710 million DOGE as part of a plan to reach a one-billion coin target.
The company’s treasury shows over $20 million in unrealized gains. CleanCore said the buildup follows a $175 million private placement completed on September 5, 2025, and that Bitstamp by Robinhood is its chosen trading venue for the purchases.
The Dogecoin Foundation and House of Doge are listed as partners in the broader initiative.
$Doge/4-hour
A nice pattern was caught on the #Dogecoin chart![]() pic.twitter.com/JqZkx3S7bd
pic.twitter.com/JqZkx3S7bd
— Trader Tardigrade (@TATrader_Alan) October 7, 2025
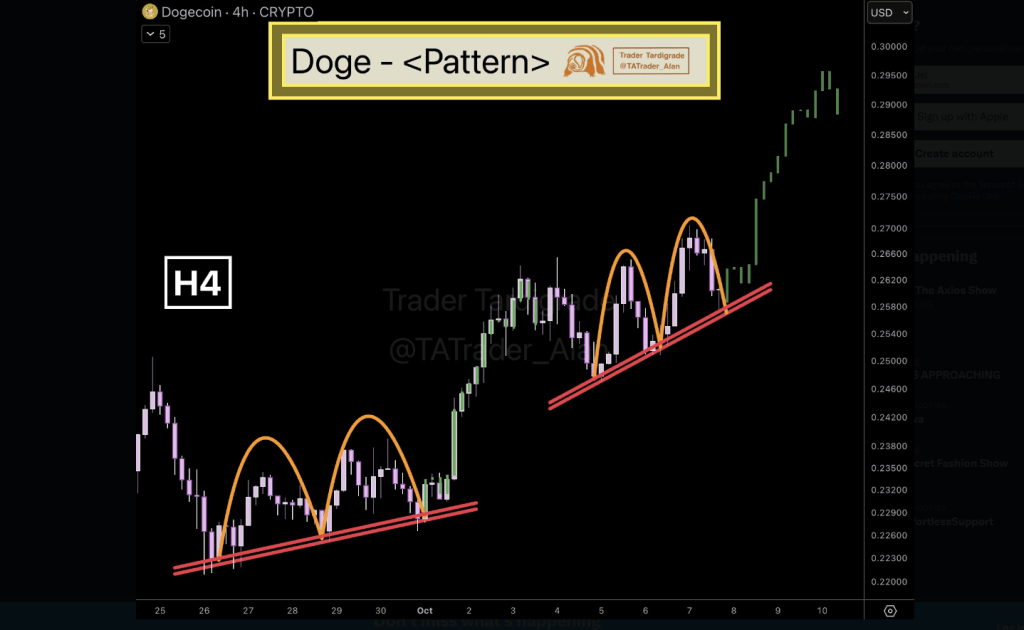
Trader Spots Repeating Setup On 4-Hour Chart
According to an X post by analyst Trader Tardigrade, the four-hour chart shows a “nice” pattern that has appeared more than once this month.
The set up involves two failed rally attempts where price climbed toward resistance but fell back, each time finding support on a rising trendline.
The recent pattern began around October 4 after DOGE slid from about $0.26. Bulls pushed prices above $0.27 on October 6, but the MOVE did not hold and the token again returned to trendline support.
A Pattern With Earlier EchoesBased on reports, the same sequence showed up in late September. That episode started near $0.22 on September 26, where an initial rally stalled at about $0.234 and then retreated to support by September 28.
A second try ended just above $0.235 on September 29. Price then found footing near the trendline and climbed from roughly $0.22 on September 30 to about $0.26 by October 3.
The repeated failure to break support in both stretches is being read by some as evidence of steady bids at those levels.
Market watchers say the key lines to follow are the rising support line identified by Tardigrade and the resistance zone near $0.27.
A sustained move above that level WOULD be seen as bullish by traders who use the four-hour timeframe. Conversely, a break below the trendline would remove a short-term floor that has held during the two prior episodes.
CleanCore’s ongoing accumulation is being tracked by observers who note that large buyers can change market dynamics when they buy on dips.
Taken together, the chart pattern and the corporate buying give investors two ways to read the market: one is technical and favors a possible repeat of late-September strength; the other is structural and looks at steady accumulation by an institutional treasury.
For now, DOGE’s mixed daily numbers show that momentum is fragile, even though both the chart and the reported treasury moves point to persistent demand at certain price levels.
Featured image from OlesyaNickolaeva/Shutterstock.com, chart from TradingView
