XRP Under Pressure - Critical Support Break Could Unleash Bearish Avalanche

XRP teeters on the edge as selling pressure intensifies
The Breaking Point
Bears circle the digital asset, testing key support levels that have held firm for weeks. Market sentiment shifts as trading volume spikes downward—traders brace for potential cascading effects if current defenses crumble.
Technical Precipice
Chart patterns suggest weakening momentum as resistance levels strengthen overhead. The cryptocurrency faces its most significant test since the last major correction, with algorithmic traders positioning for breakdown scenarios.
Market Psychology
Fear spreads through derivatives markets where open interest patterns reveal growing bearish positioning. Liquidity pools below current levels appear thin—raising concerns about slippage if large sell orders trigger.
Another day in crypto paradise where your portfolio's fate rests on whether some lines on a chart hold or break. Because what could possibly go wrong building wealth on technical analysis and trader superstition?
XRP Price Dips Further
XRP price failed to stay above $3.00 and started a fresh decline, like Bitcoin and Ethereum. The price declined below $2.950 and $2.920 to enter a short-term bearish zone.
The price tested the $2.8320 zone and recently attempted a recovery wave. It climbed above the 23.6% Fib retracement level of the downward move from the $3.05 swing high to the $2.8320 swing low. However, the bears remained active NEAR $2.920.
The price is now trading below $2.90 and the 100-hourly Simple Moving Average. Besides, there is a key bearish trend line forming with resistance at $2.880 on the hourly chart of the XRP/USD pair.
If there is a fresh upward move, the price might face resistance near the $2.880 level. The first major resistance is near the $2.920 level. A clear move above the $2.920 resistance might send the price toward the $2.950 resistance.
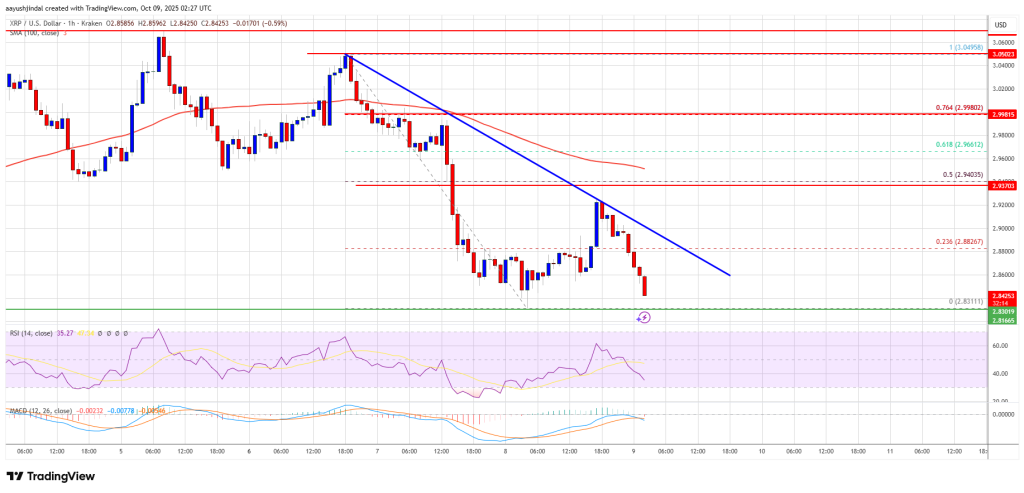
Any more gains might send the price toward the $3.00 resistance or the 76.4% Fib retracement level of the downward move from the $3.05 swing high to the $2.8320 swing low. The next major hurdle for the bulls might be near $3.050.
More Losses?
If XRP fails to clear the $2.920 resistance zone, it could start a fresh decline. Initial support on the downside is near the $2.820 level. The next major support is near the $2.80 level.
If there is a downside break and a close below the $2.80 level, the price might continue to decline toward $2.7250. The next major support sits near the $2.650 zone, below which the price could continue lower toward $2.60.
Technical Indicators
Hourly MACD – The MACD for XRP/USD is now gaining pace in the bearish zone.
Hourly RSI (Relative Strength Index) – The RSI for XRP/USD is now below the 50 level.
Major Support Levels – $2.820 and $2.80.
Major Resistance Levels – $2.920 and $2.950.
