XRP Breaks Out: Approaching Critical Resistance That Could Define the Next Major Trend

XRP surges toward key technical barrier that traders are watching like hawks.
The Momentum Builds
XRP's recent upward trajectory puts it inches away from a resistance level that could make or break the next major price movement. Market participants hold their breath as the digital asset tests waters that previously triggered significant reversals.
Technical Tension Mounts
Every chartist's screen glows with anticipation as XRP approaches this make-or-break zone. The resistance level represents more than just numbers—it's the psychological battleground where bulls and bulls clash over the asset's future direction.
Breaking Through or Bouncing Back?
A clean break above this resistance could signal the start of a fresh bullish trend, while rejection might send XRP back to recent support levels. Either way, volatility traders are licking their chops at the potential price action ahead.
Because nothing says 'stable financial system' like digital assets that swing 20% based on whether they can punch through an imaginary line on a chart.
XRP Price Faces Resistance
XRP price started a recovery wave after it found support above $2.720 and $2.770, like Bitcoin and Ethereum. The price was able to surpass the $2.80 and $2.850 resistance levels.
There was a clear MOVE above the 61.8% Fib retracement level of the downward wave from the $2.995 swing high to the $2.70 low. The bulls even pushed the price toward $2.920 before they faced resistance. Besides, there is a connecting bullish trend line forming with support at $2.8320 on the hourly chart of the XRP/USD pair.
The price is now trading above $2.850 and the 100-hourly Simple Moving Average. On the upside, the price might face resistance near the $2.925 level or the 76.4% Fib retracement level of the downward wave from the $2.995 swing high to the $2.70 low.
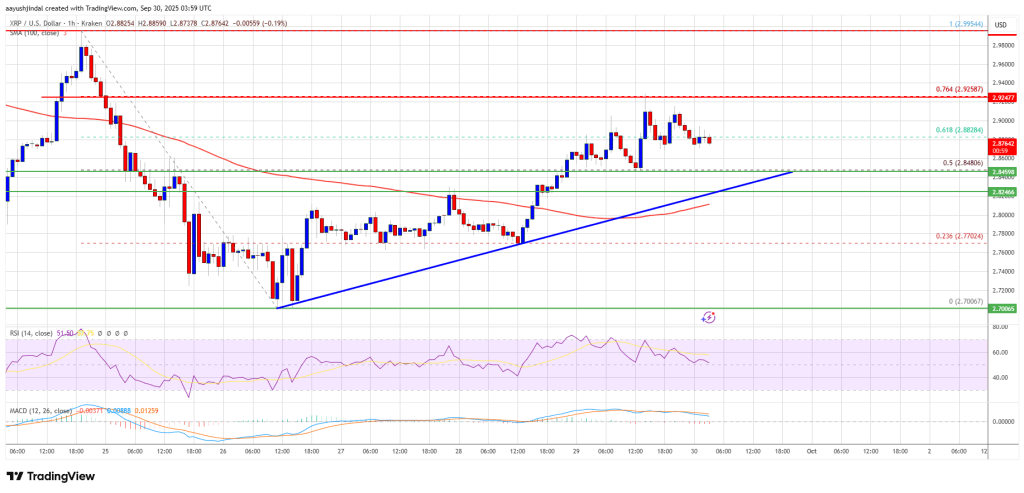
The first major resistance is near the $2.950 level. A clear move above the $2.950 resistance might send the price toward the $3.00 resistance. Any more gains might send the price toward the $3.050 resistance. The next major hurdle for the bulls might be near $3.120.
Another Decline?
If XRP fails to clear the $2.920 resistance zone, it could start a fresh decline. Initial support on the downside is near the $2.850 level. The next major support is near the $2.8320 level and the trend line.
If there is a downside break and a close below the $2.8320 level, the price might continue to decline toward $2.770. The next major support sits near the $2.720 zone, below which the price could continue lower toward $2.650.
Technical Indicators
Hourly MACD – The MACD for XRP/USD is now gaining pace in the bullish zone.
Hourly RSI (Relative Strength Index) – The RSI for XRP/USD is now above the 50 level.
Major Support Levels – $2.8320 and $2.770.
Major Resistance Levels – $2.920 and $2.950.
