Solana (SOL) Stages Comeback Rally – Can Bulls Overpower Bearish Pressure?

Solana's native token SOL flashes green across crypto dashboards as technical indicators signal potential trend reversal. The digital asset claws back from recent lows, sparking renewed optimism among blockchain enthusiasts.
Technical Breakout Patterns Emerge
Trading volumes spike 40% as SOL breaches key resistance levels. The momentum shift catches short-sellers off guard, forcing rapid position adjustments across derivatives markets.
Ecosystem Fundamentals Strengthen
Network activity surges despite recent market turbulence. Daily active addresses maintain steady growth while DeFi protocols on Solana continue attracting fresh capital inflows.
Market Sentiment Diverges
While retail traders pile into long positions, institutional players remain cautious. The classic crypto dance continues—where euphoria meets skepticism in perfect harmony. Because nothing says 'sound investment' like volatile digital assets that could either moon or crash based on Elon Musk's latest tweet.
All eyes now turn to whether SOL can sustain this upward trajectory or if the bears will once again crash the party.
Solana Price Dips Again
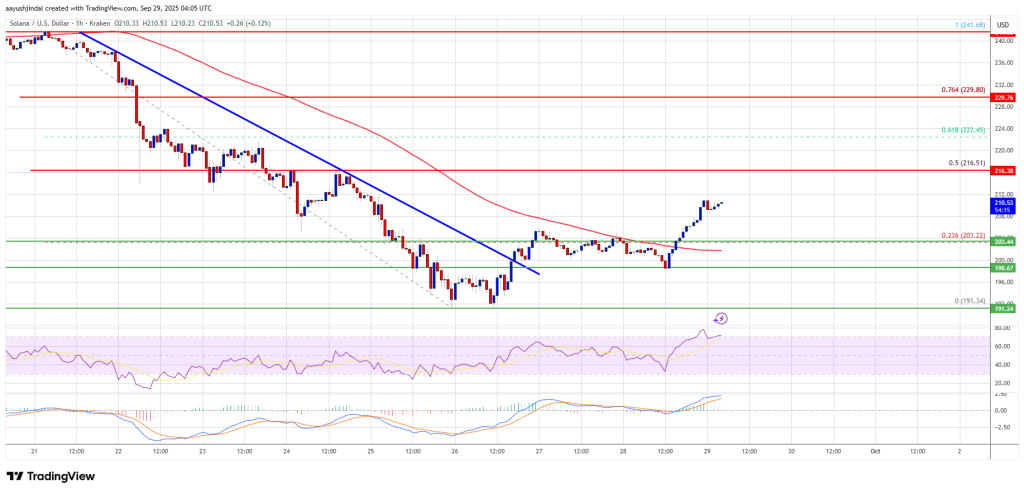
Solana price failed to stay above $220 and started a fresh decline, like Bitcoin and Ethereum. SOL traded below the $212 and $205 support levels to enter a bearish zone.
The bears even pushed the price below $200 and the 100-hourly simple moving average. A low was formed at $191 and the price recently started a recovery wave above the 23.6% Fib retracement level of the downward MOVE from the $242 swing high to the $191 low.
Besides, there was a break above a key bearish trend line with resistance at $200 on the hourly chart of the SOL/USD pair. solana is now trading above $200 and the 100-hourly simple moving average.
If there are more gains, the price could face resistance NEAR the $212 level. The next major resistance is near the $215 level or the 50% Fib retracement level of the downward move from the $242 swing high to the $191 low. The main resistance could be $220.
A successful close above the $220 resistance zone could set the pace for another steady increase. The next key resistance is $230. Any more gains might send the price toward the $242 level.
Another Decline In SOL?
If SOL fails to rise above the $215 resistance, it could continue to move down. Initial support on the downside is near the $202 zone. The first major support is near the $200 level.
A break below the $200 level might send the price toward the $192 support zone. If there is a close below the $192 support, the price could decline toward the $180 support in the near term.
Technical Indicators
Hourly MACD – The MACD for SOL/USD is gaining pace in the bullish zone.
Hourly Hours RSI (Relative Strength Index) – The RSI for SOL/USD is above the 50 level.
Major Support Levels – $202 and $200.
Major Resistance Levels – $215 and $220.
