Solana (SOL) Plummets – Is This Just the Beginning of a Deeper Correction?

Solana's sharp decline sends shockwaves through crypto markets as technical indicators flash warning signals.
Technical Breakdown
The SOL chart paints a concerning picture with key support levels crumbling under selling pressure. Trading volume spikes suggest institutional players are exiting positions rapidly.
Market Psychology
Fear grips retail traders who bought near recent highs. The fear and greed index tilts heavily toward panic as leveraged positions get liquidated.
Ecosystem Impact
Solana's DeFi protocols feel the squeeze with TVL dropping faster than a banker's credibility during a market crash. NFT trading volume on the network slows to a crawl.
What's Next?
Technical analysts point to critical levels that must hold to prevent further downside. Some see this as healthy correction while others warn of contagion risk spreading to altcoins.
Remember: In crypto, sometimes the 'fundamentals' are just fancy words for hoping the next buyer is dumber than you were.
Solana Price Dips Sharply
Solana price failed to stay above $232 and started a fresh decline, like Bitcoin and Ethereum. SOL traded below the $220 and $212 support levels to enter a bearish zone.
The bears even pushed the price below $200 and the 100-hourly simple moving average. A low was formed at $191 and the price is now consolidating losses below the 23.6% Fib retracement level of the downward MOVE from the $242 swing high to the $191 low.
Solana is now trading below $200 and the 100-hourly simple moving average. Besides, there is a key bearish trend line forming with resistance at $204 on the hourly chart of the SOL/USD pair.
If there is a recovery wave, the price could face resistance NEAR the $200 level. The next major resistance is near the $204 level or the trend line. The main resistance could be $215 or the 50% Fib retracement level of the downward move from the $242 swing high to the $191 low.
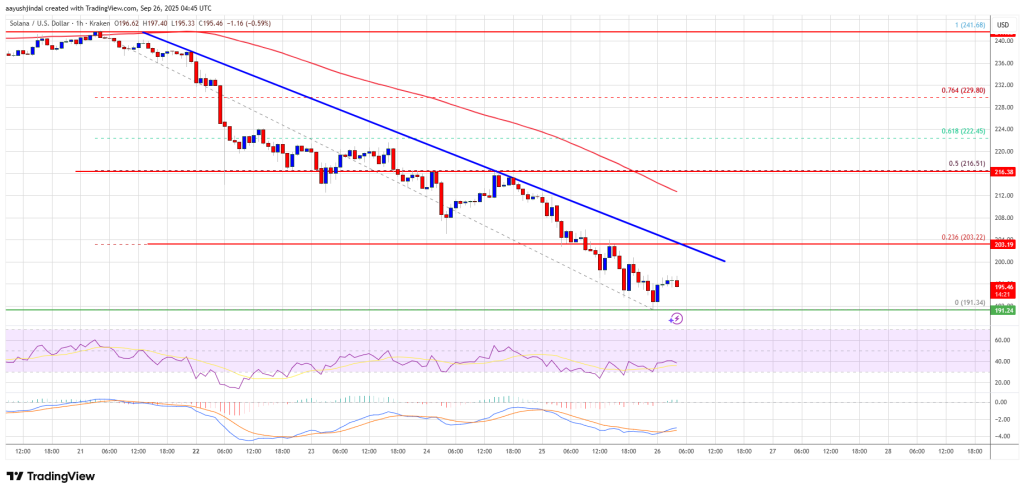
A successful close above the $215 resistance zone could set the pace for another steady increase. The next key resistance is $220. Any more gains might send the price toward the $232 level.
More Losses In SOL?
If SOL fails to rise above the $204 resistance, it could continue to move down. Initial support on the downside is near the $192 zone. The first major support is near the $188 level.
A break below the $188 level might send the price toward the $180 support zone. If there is a close below the $180 support, the price could decline toward the $174 support in the near term.
Technical Indicators
Hourly MACD – The MACD for SOL/USD is gaining pace in the bearish zone.
Hourly Hours RSI (Relative Strength Index) – The RSI for SOL/USD is below the 50 level.
Major Support Levels – $192 and $188.
Major Resistance Levels – $204 and $215.
