Ethereum Plunges Below $4,000 - Critical Support Break Signals Potential Extended Downtrend

Ethereum's foundation just cracked—the $4,000 floor gave way, sending shockwaves through crypto portfolios.
Technical Breakdown: What's Next?
Traders watched in real-time as ETH sliced through the psychological $4,000 barrier like a hot knife through butter. This isn't just another dip—it's a fundamental breach that technical analysts have been warning about for weeks. The charts don't lie, and right now they're screaming caution.
Market Psychology Shift
Fear's creeping back into the market faster than a DeFi flash loan attack. That $4,000 level wasn't just a number—it was the line in the sand between bullish confidence and bearish reality. Now that it's gone, even the diamond hands are getting sweaty.
Institutional Impact
Watch the derivatives market—liquidations are stacking up like unverified transactions in a mempool. When ETH can't hold major support levels, even the Wall Street crypto tourists start questioning their 'long-term hold' strategies. Nothing tests conviction like seeing portfolio values drop faster than NFT trading volumes.
The silver lining? Crypto markets have short memories—today's panic often becomes tomorrow's buying opportunity. But for now, the charts suggest this correction might have more room to run than a maximalist at a central banking conference.
Ethereum Price Dips Further
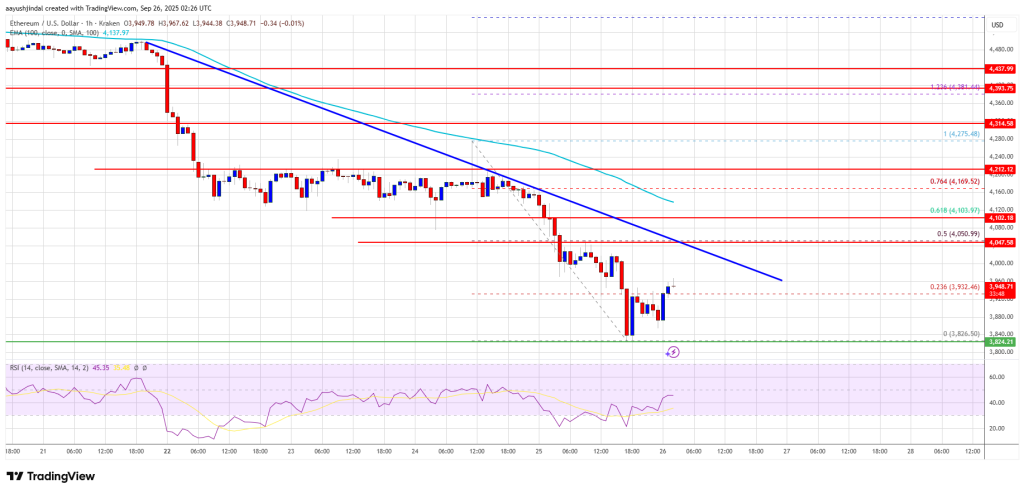
Ethereum price remained in a bearish zone after it settled below $4,250, like Bitcoin. ETH price declined below the $4,120 and $4,050 support levels.
The bears even pushed the price below $4,000. A low was formed at $3,826 and the price recently started a minor recovery wave. There was a MOVE above the 23.6% Fib retracement level of the downward wave from the $4,275 swing high to the $3,826 low.
However, the bears remained active near the $3,950 resistance zone. ethereum price is now trading below $4,000 and the 100-hourly Simple Moving Average. Besides, there is a key bearish trend line forming with resistance at $4,050 on the hourly chart of ETH/USD.
On the upside, the price could face resistance NEAR the $4,000 level. The next key resistance is near the $4,050 level or the 50% Fib retracement level of the downward wave from the $4,275 swing high to the $3,826 low. The first major resistance is near the $4,120 level. A clear move above the $4,120 resistance might send the price toward the $4,150 resistance and the trend line.
An upside break above the $4,250 region might call for more gains in the coming sessions. In the stated case, Ether could rise toward the $4,320 resistance zone or even $4,350 in the near term.
More Losses In ETH?
If ethereum fails to clear the $4,050 resistance, it could start a fresh decline. Initial support on the downside is near the $3,880 level. The first major support sits near the $3,820 zone.
A clear move below the $3,820 support might push the price toward the $3,750 support. Any more losses might send the price toward the $3,720 region in the near term. The next key support sits at $3,650.
Technical Indicators
Hourly MACDThe MACD for ETH/USD is gaining momentum in the bearish zone.
Hourly RSIThe RSI for ETH/USD is now below the 50 zone.
Major Support Level – $3,820
Major Resistance Level – $4,050
