Bitcoin Support Crumbles - Will Bulls Stage a Comeback Amid Market Uncertainty?

Bitcoin's foundation just cracked—and traders are scrambling for answers.
The Breakdown
Support levels evaporated faster than a meme coin's promises. Market watchers saw key thresholds dissolve as selling pressure intensified across exchanges. Charts now paint a grim picture of resistance turned surrender.
Bull Case Blues
Optimists point to historical patterns suggesting rebounds after sharp corrections. They whisper about institutional accumulation during dips and remind everyone this isn't Bitcoin's first rodeo. Yet even die-hards admit the momentum shift feels different this time.
Trader Psychology
Fear's creeping into crypto Twitter like an uninvited whale. The usual 'buy the dip' chorus sounds hesitant—almost as if everyone suddenly remembers these digital assets don't come with FDIC insurance. Who knew?
What's Next?
All eyes pivot to whether bulls can regroup or if this becomes a full-blown trend reversal. One thing's certain: the 'number go up' crowd just got a brutal reminder that charts move both ways—especially when traditional finance types start feeling smug about volatility.
Bitcoin Price Dips Further
Bitcoin price failed to start a recovery wave and stayed below $114,000. BTC declined below the $112,500 and $112,000 support levels to MOVE further into a bearish zone.
The decline gained pace below the $111,500 level. A low was formed at $108,680 and the price is now consolidating losses. There was a minor move toward the 23.6% Fib retracement level of the recent decline from the $113,939 swing high to the $108,680 low.
Bitcoin is now trading below $112,500 and the 100 hourly Simple moving average. Besides, there are two bearish trend lines forming with resistance at $110,500 and $113,000 on the hourly chart of the BTC/USD pair.
Immediate resistance on the upside is NEAR the $109,920 level. The first key resistance is near the $110,500 level and the trend line. The next resistance could be $111,300 or the 50% Fib retracement level of the recent decline from the $113,939 swing high to the $108,680 low.
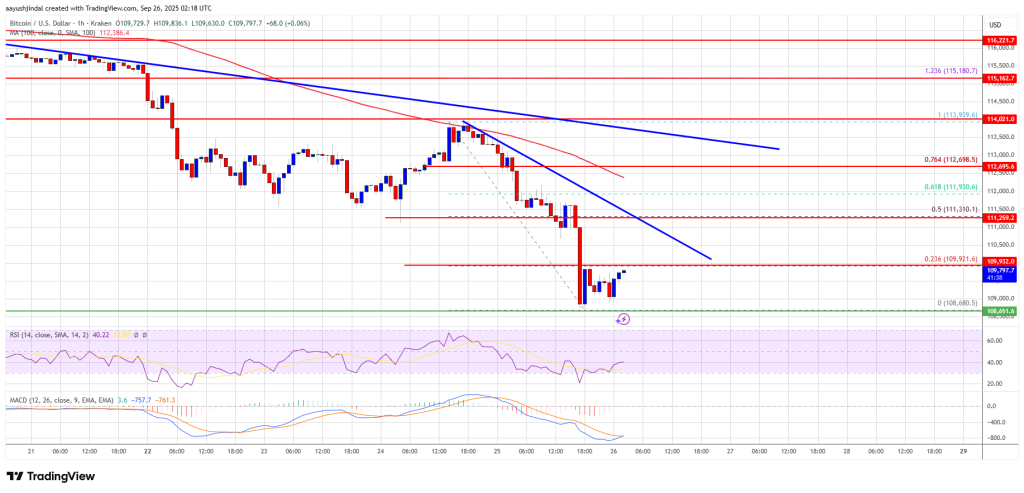
A close above the $111,300 resistance might send the price further higher. In the stated case, the price could rise and test the $112,500 resistance. Any more gains might send the price toward the $113,000 level. The next barrier for the bulls could be $114,500.
Another Decline In BTC?
If Bitcoin fails to rise above the $110,500 resistance zone, it could start a fresh decline. Immediate support is near the $108,800 level. The first major support is near the $108,200 level.
The next support is now near the $107,500 zone. Any more losses might send the price toward the $106,400 support in the near term. The main support sits at $105,500, below which BTC might struggle to recover in the short term.
Technical indicators:
Hourly MACD – The MACD is now gaining pace in the bearish zone.
Hourly RSI (Relative Strength Index) – The RSI for BTC/USD is now below the 50 level.
Major Support Levels – $108,800, followed by $108,200.
Major Resistance Levels – $110,500 and $113,000.
