XRP Price Recovery Stalls – Can Bulls Smash Through Critical Resistance?

XRP's comeback hits a wall as traders watch for bullish momentum to break key barriers.
The Standoff at Resistance
Trading volumes thin out while the digital asset tests crucial technical levels. Market sentiment hangs in the balance as buyers and sellers wrestle for control.
Breaking Point or Fakeout?
Patterns suggest consolidation before the next major move. Analysts watch for either a decisive breakout or another rejection at these levels—because nothing says 'healthy market' like watching digital fortunes hinge on lines drawn by traders who still can't agree on what's for lunch.
XRP Price Faces Hurdles
XRP price found support near $2.680 and recently started a recovery wave, beating Bitcoin and Ethereum. The price was able to surpass the $2.80 and $2.85 resistance levels.
The bulls pushed the price above the 50% Fib retracement level of the main decline from the $3.138 swing high to the $2.678 low. However, the bears are active NEAR the $3.00 resistance. The price faced rejection near $3.00 and reacted to the downside.
The price is now trading near $2.90 and the 100-hourly Simple Moving Average. Besides, there is a connecting bullish trend line forming with support at $2.850 on the hourly chart of the XRP/USD pair.
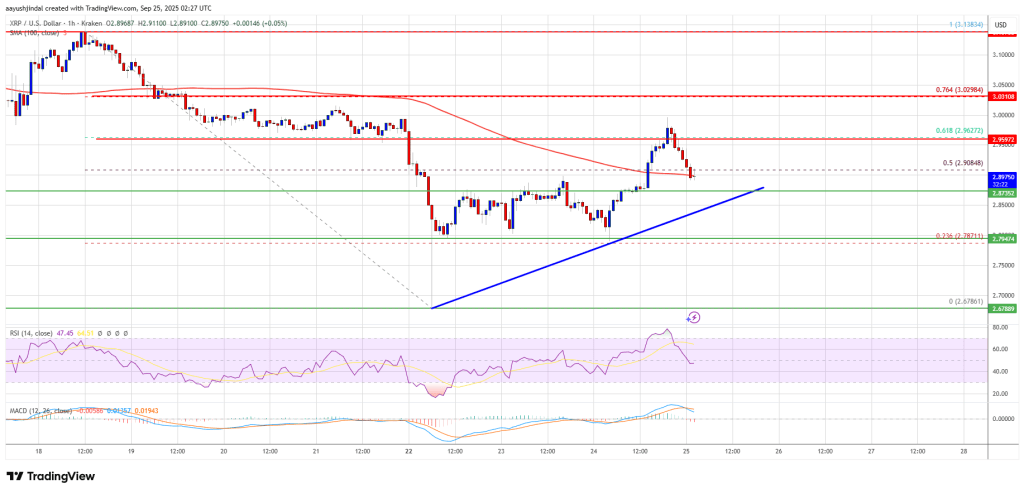
On the upside, the price might face resistance near the $2.95 level. The first major resistance is near the $2.9620 level and the 61.8% Fib retracement level of the main decline from the $3.138 swing high to the $2.678 low. A clear MOVE above the $2.9620 resistance might send the price toward the $3.00 resistance. Any more gains might send the price toward the $3.050 resistance. The next major hurdle for the bulls might be near $3.120.
Another Decline?
If XRP fails to clear the $2.9620 resistance zone, it could continue to move down. Initial support on the downside is near the $2.880 level. The next major support is near the $2.850 level and the trend line.
If there is a downside break and a close below the $2.850 level, the price might continue to decline toward $2.780. The next major support sits near the $2.70 zone, below which the price could gain bearish momentum.
Technical Indicators
Hourly MACD – The MACD for XRP/USD is now gaining pace in the bearish zone.
Hourly RSI (Relative Strength Index) – The RSI for XRP/USD is now below the 50 level.
Major Support Levels – $2.880 and $2.850.
Major Resistance Levels – $2.9620 and $3.00.
