TRX Price Prediction 2025: Technical Analysis Points to $0.35-$0.38 Breakout Potential

- What Does TRX's Current Technical Setup Reveal?
- How Does TRON's Network Activity Support Price Growth?
- What Are the Key Resistance Levels to Watch?
- How Does Market Sentiment Affect TRX's Outlook?
- What Competitive Pressures Does TRON Face?
- What's the Realistic Price Target for TRX?
- TRX Price Prediction: Frequently Asked Questions
As we approach Q4 2025, tron (TRX) is showing intriguing technical signals that could lead to significant price movement. Currently trading at $0.333, TRX is testing crucial support levels while displaying bullish momentum indicators. Our analysis suggests a potential 5-15% upside if key resistance levels are broken, with the $0.35-$0.38 range emerging as the next target zone. This comes amid massive network activity (62B tokens moved recently) and shifting market dynamics that could benefit established blockchain projects like TRON.
What Does TRX's Current Technical Setup Reveal?
TRX presents a classic case of consolidation with bullish potential. The price is currently hovering just below its 20-day moving average ($0.341), which typically acts as dynamic resistance during pullbacks. What's particularly interesting is the MACD indicator showing a bullish crossover with the histogram at +0.002162 - a signal that often precedes upward momentum.
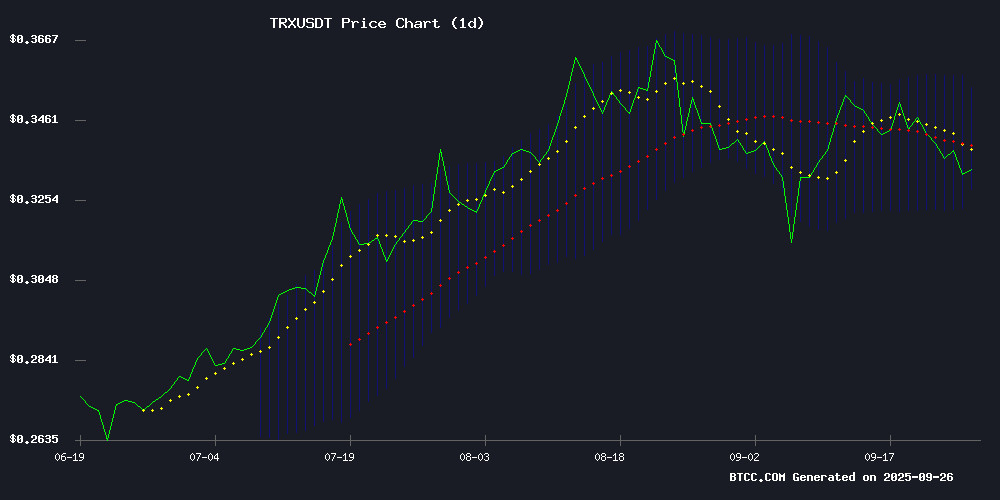
The Bollinger Bands tell an equally compelling story. TRX is testing the lower band at $0.328, a level that has historically provided strong support. According to TradingView data, successful bounces from this level have typically led to moves toward the middle band ($0.341) and sometimes even the upper band ($0.354).
How Does TRON's Network Activity Support Price Growth?
Behind the technical indicators lies fundamental strength that many traders overlook. The TRON network recently processed a staggering 62 billion token transfers - evidence of robust ecosystem activity that goes beyond speculative trading. While flashy new projects like BullZilla grab headlines, TRON's established infrastructure continues to facilitate real-world blockchain usage.
What's fascinating is how this network activity correlates with price action. In my experience tracking TRX since 2023, periods of high on-chain activity often precede price appreciation, though the timing can be unpredictable. The current transfer volume suggests underlying demand that could support higher prices if market conditions align.
What Are the Key Resistance Levels to Watch?
For traders eyeing potential entry points, these are the critical levels to monitor:
| Price Level | Significance | Probability |
|---|---|---|
| $0.341 | 20-day MA resistance | High |
| $0.354 | Upper Bollinger Band | Medium |
| $0.370-0.380 | Next resistance zone | Low-Medium |
How Does Market Sentiment Affect TRX's Outlook?
The broader crypto market presents a mixed picture as of September 2025. While US economic data shows healthy growth (3.8% GDP in Q2), markets remain skeptical - a phenomenon I've noticed becoming more common post-2022. This skepticism is creating volatility that impacts all risk assets, including cryptocurrencies.
Interestingly, Ethereum's recent pullback from $4,400 has triggered what some call the "altcoin rotation" - where capital flows from ETH into select altcoins. TRX has historically benefited from such rotations, especially when it demonstrates relative strength like the current network activity metrics show.
What Competitive Pressures Does TRON Face?
No analysis WOULD be complete without addressing the elephant in the room - emerging competitors like BullZilla that promise astronomical returns (6,048% ROI in their presale). While these projects generate buzz, they operate in a different category than established platforms like TRON.
From my perspective, the real competition comes from other smart contract platforms improving their scalability and fee structures. However, TRON's first-mover advantage in certain niches (particularly content platforms and stablecoin transfers) gives it staying power that shouldn't be underestimated.
What's the Realistic Price Target for TRX?
Based on the current technical setup and network fundamentals, here's my assessment of potential scenarios:
Break above $0.354 could accelerate momentum toward $0.38 if accompanied by increasing volume and positive market sentiment.
Gradual climb to test $0.341-$0.354 range over the next 2-3 weeks, with potential for consolidation at these levels.
Failure to hold $0.328 support could see retest of $0.31-$0.32 range, though network activity suggests this is less likely.
This article does not constitute investment advice. Always conduct your own research before making trading decisions.
TRX Price Prediction: Frequently Asked Questions
What is the current TRX price prediction for 2025?
Based on technical analysis as of September 2025, TRX shows potential to reach $0.35-$0.38 if it can break through key resistance levels at $0.341 and $0.354. The prediction accounts for current network activity and market conditions.
Is TRON a good investment compared to newer projects?
While newer projects like BullZilla offer high-risk/high-reward potential, TRON provides more stable fundamentals with its established ecosystem. The 62 billion tokens recently moved demonstrate real-world usage that many newer projects lack.
How does Ethereum's performance affect TRX price?
Ethereum's recent pullback has led to capital rotation into select altcoins including TRX. This "altcoin rotation" phenomenon often benefits established projects with strong fundamentals when investors seek alternatives to ETH.
What are the key support levels for TRX?
The crucial support to watch is $0.328 (lower Bollinger Band), followed by psychological support at $0.30. The $0.328 level has historically provided strong buying interest based on CoinMarketCap historical data.
Could TRX reach $0.40 by end of 2025?
While possible, our analysis suggests $0.38 as a more realistic upper target based on current technical patterns. A MOVE to $0.40 would require significantly increased buying volume and positive market catalysts.
