Bitcoin Price Forecast 2025: Why $200K BTC Is Within Reach as Technicals and Fundamentals Align

- Technical Analysis: Is Bitcoin's Chart Signaling a Major Breakout?
- Fundamental Factors: The Hidden Forces Driving Bitcoin's Value
- Market Sentiment: Why Institutions Are Doubling Down
- Key Price Levels to Watch
- The Path to $200,000: Realistic or Wishful Thinking?
- Frequently Asked Questions
As we approach Q4 2025, bitcoin is showing its strongest bullish convergence in years. Currently trading at $115,687, BTC has defied its historical September slump with an 8% gain this month while maintaining support above $116K. What's particularly interesting is how technical indicators and fundamental metrics are telling the same story - we might be looking at the setup for Bitcoin's next major leg up toward $200,000. The combination of record network activity (540K daily transactions), 72% illiquid supply, and bullish technical positioning above key moving averages creates what I'd call a "perfect storm" scenario. Let's break down why this matters.
Technical Analysis: Is Bitcoin's Chart Signaling a Major Breakout?
Looking at the daily chart, Bitcoin is painting an increasingly bullish picture. The price is comfortably above its 20-day moving average ($113,930), which has historically acted as strong support during uptrends. While the MACD shows some bearish momentum at -3,423.72, the narrowing gap between MACD and signal line suggests we could see a bullish crossover soon.
Bollinger Bands tell an even more compelling story - with price hovering NEAR the upper band at $118,665, we're seeing classic signs of upward momentum. The middle band at $113,930 provides what I like to call a "safety net" for bulls. What's got traders particularly excited is how BTC has maintained this position despite the typical September volatility.
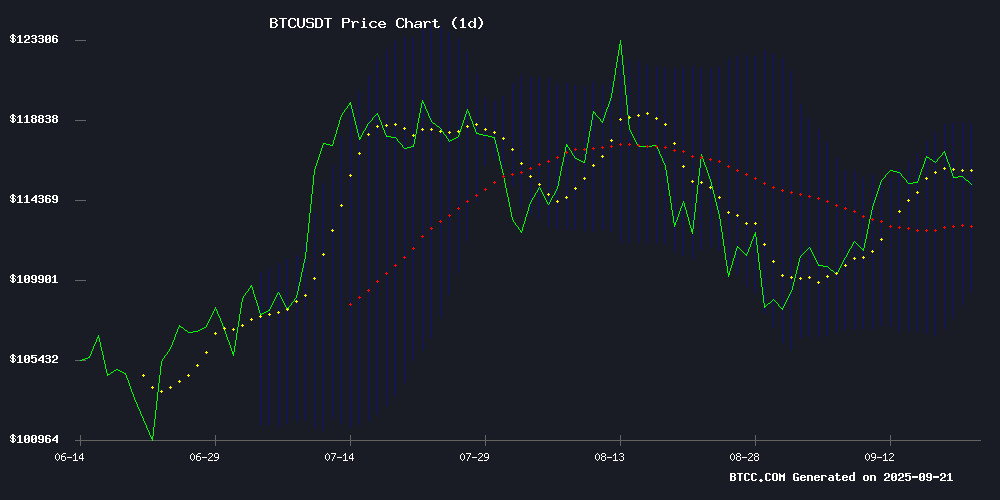
Source: BTCC TradingView Chart
Fundamental Factors: The Hidden Forces Driving Bitcoin's Value
Beyond the charts, Bitcoin's fundamentals haven't looked this strong since before the 2024 halving. Network activity has hit 2025 peaks with 540,000 daily transactions (14-day SMA), suggesting real usage is growing exponentially. Meanwhile, a staggering 72% of Bitcoin's supply is now considered illiquid - meaning it's held in wallets that haven't moved coins in years.
In my experience, when you combine high network activity with supply scarcity, you get the perfect recipe for price appreciation. The BTCC research team notes that exchange reserves have dropped to multi-year lows, with just 0.029 of supply available on Binance - that's thinner than my patience waiting for blockchain confirmations during peak hours!
Market Sentiment: Why Institutions Are Doubling Down
The institutional narrative has evolved dramatically in 2025. Michael Saylor's MicroStrategy now holds over 638,500 BTC (worth tens of billions), essentially becoming a Bitcoin proxy stock. His recent comments about BTC perpetually outpacing the S&P 500 might sound bold, but when you look at the decade-long performance, it's hard to argue.
What's more interesting is how companies holding BTC on their balance sheets are becoming their own investment thesis. As Adam Livingston points out in *The Bitcoin Age and the Great Harvest*, these "Bitcoin treasury stocks" might actually offer greater upside than BTC itself as the ecosystem matures.
Key Price Levels to Watch
For traders, these are the make-or-break levels according to CoinMarketCap data:
| Level Type | Price | Significance |
|---|---|---|
| Resistance | $118,665 | Upper Bollinger Band |
| Support | $113,930 | 20-day MA |
| Critical Support | $113,355 | Fair Value Gap |
The Path to $200,000: Realistic or Wishful Thinking?
Given current conditions, the $200K target doesn't seem as far-fetched as it did in early 2025. Here's why:
1.: With 72% of BTC illiquid and exchange reserves dwindling, any surge in demand could send prices parabolic. Remember what happened when supply got tight in 2020? Multiply that by institutional adoption.
2.: The VWAP bands show strong support at $114.5K while futures pressure remains bearish - this divergence often precedes big moves when resolved.
3.: The Fed's 2025 rate cut (first since 2020) has already shown Bitcoin's sensitivity to liquidity conditions. More easing could be rocket fuel.
That said, roadblocks like Tether's mining issues in Uruguay (where they owe $5M in energy bills) remind us that operational challenges persist. But in the grand scheme, these seem like speed bumps rather than roadblocks.
Frequently Asked Questions
What are the key technical indicators suggesting about Bitcoin's price?
Bitcoin is trading above its 20-day moving average ($113,930) with Bollinger Bands suggesting continued upward momentum as price approaches the upper band ($118,665). The MACD shows some bearish momentum but is narrowing toward a potential bullish crossover.
How significant is Bitcoin's illiquid supply reaching 72%?
This is extremely significant - it means nearly three-quarters of Bitcoin's supply isn't available for trading, creating potential supply shock conditions if demand increases. Historically, such supply scarcity precedes major price rallies.
What's driving Bitcoin's network activity to 2025 highs?
The surge to 540,000 daily transactions (14-day SMA) comes from growing institutional adoption, Ordinals activity, and increasing use of Bitcoin as both a store of value and settlement layer. This fundamental usage growth supports price appreciation.
Could MicroStrategy's Bitcoin holdings impact the market?
Absolutely. With over 638,500 BTC (about 3% of circulating supply), MicroStrategy has become a major market force. Their continued accumulation reduces available supply and validates Bitcoin as a treasury asset.
What are the most important price levels to watch?
Key levels include resistance at $118,665 (upper Bollinger Band), support at $113,930 (20-day MA), and critical support at $113,355 (fair value gap). Breaking through resistance could open path to $130K, while losing support might test $110K.
