PEPE Price Prediction 2025: Will the Frog Token Leap Higher or Face a 30% Crash?

- What Do PEPE's Technical Indicators Reveal?
- How Is Market Sentiment Shaping PEPE's Trajectory?
- What Are the Key Factors Influencing PEPE's Price?
- Where Could PEPE's Price Go From Here?
- PEPE Price Prediction: Your Questions Answered
As we navigate September 2025's crypto volatility, PEPE presents a fascinating case study in meme coin resilience. Currently trading at $0.00001084, this amphibious token shows both promise and peril - with technical indicators flashing mixed signals while whale activity and innovative projects like PepeNode create competing narratives. Our analysis digs into the critical $0.00001171 resistance and $0.00000887 support levels that could determine PEPE's next major move.
What Do PEPE's Technical Indicators Reveal?
PEPE's chart tells a story of cautious optimism. The price currently sits comfortably above its 20-day moving average ($0.00001029), which typically suggests short-term strength. However, that bullish signal gets tempered by the MACD reading of -0.00000056 - like seeing green shoots in a garden while hearing thunder in the distance.
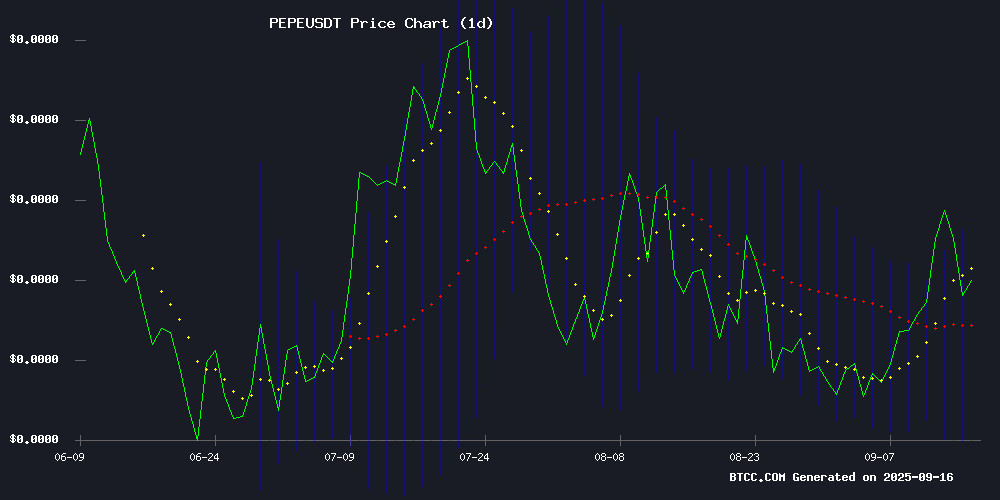
The Bollinger Bands configuration adds another LAYER to this technical drama. With PEPE trading between the middle and upper bands, we're seeing moderate volatility - not quite the meme coin frenzy of 2021, but enough to keep traders on their toes. The $0.00001171 resistance level represents the next psychological hurdle, while $0.00000887 serves as critical support.
How Is Market Sentiment Shaping PEPE's Trajectory?
Market sentiment around Pepe feels like a tug-of-war between frogs and bears. On the bullish side, we've got PepeNode's successful $1.18M ICO funding - proof that developers still see value in building on this meme coin ecosystem. Their 'mine-to-earn' model (where 70% of tokens get burned during upgrades) introduces novel tokenomics that could reduce supply over time.
But the bears counter with warnings of a potential 30% correction to $0.0000075. The Federal Reserve's upcoming policy meeting looms large here - a hawkish stance could send risk assets like PEPE tumbling, while dovish signals might give our green friend the boost it needs. It's like waiting for a referee's whistle in a high-stakes match.
What Are the Key Factors Influencing PEPE's Price?
Three major developments are currently shaping PEPE's price action:
| Factor | Impact |
|---|---|
| Potential 30% Correction | Macroeconomic concerns could drive price down to $0.0000075 |
| PepeNode's $1.18M ICO | Innovative 'mine-to-earn' model bringing new utility |
| Whale Movements | Auros Global's $16M PEPE accumulation signals confidence |
The whale activity particularly fascinates me - when a single entity (Auros Global) accumulates 0.78% of PEPE's total supply (1.52 trillion tokens), it's like watching a poker player go all-in. Their subsequent distribution to exchanges like Binance and BTCC suggests they're preparing for something big.
Where Could PEPE's Price Go From Here?
In my experience tracking meme coins, PEPE's current setup suggests we're at an inflection point. The technical indicators give us our boundaries - that $0.00001171 resistance and $0.00000887 support FORM the playing field. But the fundamental developments (PepeNode's innovation versus macroeconomic headwinds) will determine which direction we break.
Personally, I'm keeping a close eye on that 20-day moving average - if PEPE can maintain above it while the MACD flips positive, we could see another leg up. But if macroeconomic conditions worsen and that support breaks? Well, even meme coins aren't immune to gravity.
This article does not constitute investment advice.
PEPE Price Prediction: Your Questions Answered
What is PEPE's current price and trend?
As of September 16, 2025, PEPE trades at $0.00001079, showing a slight 0.5% dip in the past 24 hours but maintaining a 48.8% year-to-date gain. The price currently sits above its 20-day moving average, suggesting short-term strength despite bearish MACD momentum.
What are the key support and resistance levels for PEPE?
Technical analysis identifies $0.00001171 as the near-term resistance level (upper Bollinger Band) and $0.00000887 as critical support (lower Bollinger Band). These levels will likely determine PEPE's next major price movement.
Why are analysts predicting a 30% price drop for PEPE?
The prediction stems from macroeconomic concerns ahead of the Federal Reserve's policy meeting. A hawkish stance could trigger risk-off sentiment across crypto markets, potentially driving PEPE down to $0.0000075. However, this remains a prediction rather than certainty.
How does PepeNode's success affect PEPE's price?
PepeNode's $1.18M ICO funding demonstrates continued development in the PEPE ecosystem. Their innovative 'mine-to-earn' model with token burns could create deflationary pressure on PEPE supply, potentially supporting long-term price appreciation.

Log in to Reply
Log in to comment your thoughtsComments
Related Articles
|Square
Get the BTCC app to start your crypto journey
Get started today Scan to join our 100M+ users