Bitcoin Scarcity Index Surges For First Time Since June: Is Major Accumulation Underway?

Bitcoin's scarcity metrics just flashed a bullish signal not seen in over three months—and smart money might already be positioning.
The Scarcity Index, which tracks Bitcoin's relative rarity against traditional assets, spiked dramatically this week. This marks the first significant upward movement since June, suggesting renewed institutional interest as traditional markets wobble.
Behind the Numbers
While exact figures vary, the index's movement correlates with increased accumulation patterns among large wallets. Whales aren't just dipping toes—they're diving in headfirst while retail investors remain distracted by shiny new altcoins.
Market Implications
Historical patterns show scarcity spikes often precede major price movements. This time? The timing coincides with traditional finance's quarterly rebalancing—because nothing says 'hedge against inflation' like moving from overpriced stocks into digital gold.
Whether this signals another run toward ATH or just clever whales playing musical chairs remains to be seen. But one thing's clear: when the scarcity index talks, crypto veterans listen—even if Wall Street still thinks Bitcoin's just for buying pizza.
Bitcoin Scarcity Index Signals Market Crossroads
According to Arab Chain on CryptoQuant, the recent spike in the bitcoin Scarcity Index reflects a sudden imbalance between buyers and available supply. The index jumps when immediate buying power overwhelms market liquidity, often creating a scenario where investors race to acquire BTC before prices move higher. Historically, such spikes have coincided with positive developments or inflows of fresh capital. In fact, the same pattern occurred last June and lasted several days, fueling Bitcoin’s rally to nearly $124,000.
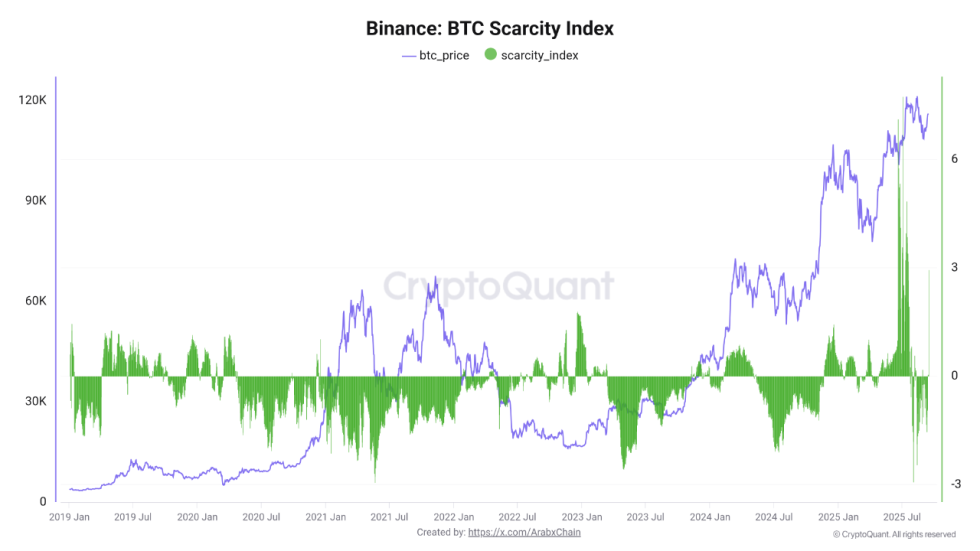
If the current reading remains elevated for multiple sessions, it could signal the start of a strong accumulation phase. Such conditions often precede sustained uptrends as whales and institutions absorb supply, reducing the amount of Bitcoin available on exchanges. However, the index also carries risk signals. A sharp rise followed by a rapid decline, as appears to be unfolding now, may suggest speculative behavior or forced liquidations. This dynamic typically leads to a period of cooling, marked by sideways consolidation or even short-term corrections.
The broader context complicates the picture. In recent months, the index reached record highs—above +6—only to collapse back toward neutral and even negative territory. This stark contrast reveals that while price remains strong, underlying demand momentum may be weakening. If exchange withdrawals slow or supply increases, the scarcity effect could fade.
With the Federal Reserve’s decision on interest rates just ahead, the question remains whether this spike reflects true accumulation or another fleeting burst of speculative activity. The next few days will provide clarity.
Bitcoin Price Analysis: Testing Mid-Range Levels
Bitcoin’s 3-day chart shows the price consolidating around $115,479, following a recovery from early September’s dip NEAR $110,000. The structure highlights a mid-range battle, as BTC trades between the 200-day SMA near $82,600 and resistance at $123,217, the level that capped the July rally.
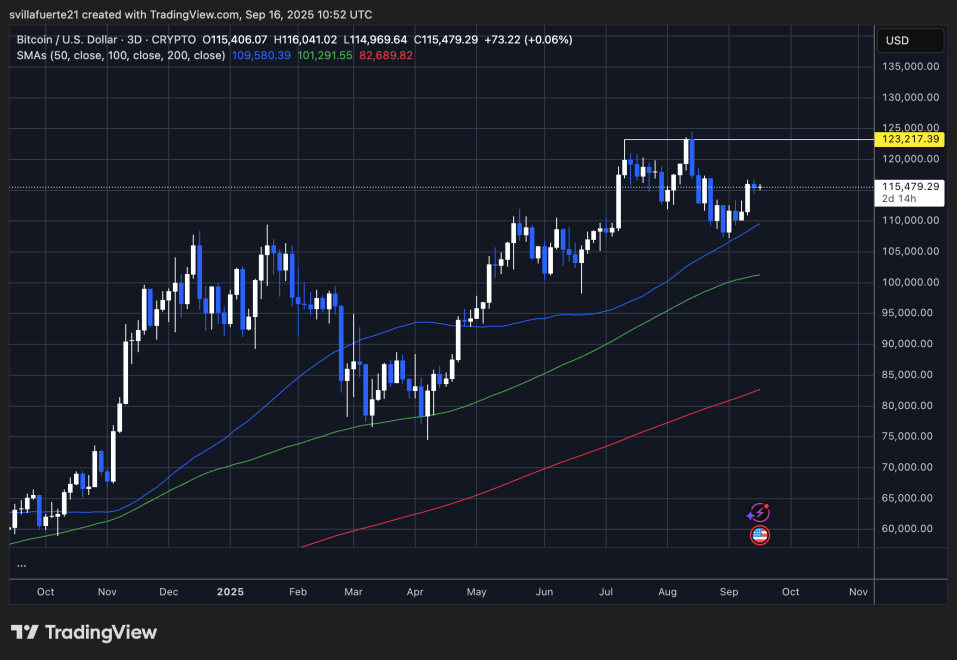
The 50-day SMA at $109,580 is acting as dynamic support, preventing deeper retracement despite repeated tests. Meanwhile, the 100-day SMA at $101,291 remains comfortably below the current price, reflecting an overall bullish medium-term structure. BTC has consistently defended higher lows since April, suggesting accumulation remains present.
However, upside momentum appears capped, with sellers stepping in near $116,000–$117,000. A decisive breakout above $123,217 WOULD likely trigger a push toward uncharted territory, potentially targeting $130,000+. On the other hand, failure to maintain support above $110,000 could open the door to deeper retracements, with $105,000 emerging as the first major downside target.
The chart reflects a market at a turning point: steady accumulation is supporting the price, yet resistance remains strong. With the Fed’s interest rate decision approaching, volatility is expected to rise. Bitcoin’s ability to either break past $123K or hold the $110K floor will define the next trend.
Featured image from Dall-E, chart from TradingView
