Ethereum Price Forecast 2025: Will ETH Hit $7,000 Despite Market Volatility?

- Why Is Ethereum Showing Bullish Signals Despite Recent Pullback?
- How Are Institutional Investors Positioning Themselves?
- What Do Ethereum's On-Chain Metrics Reveal?
- Are Ethereum Layer 2 Networks Failing to Deliver?
- How Are Ethereum ETFs Performing?
- What's Driving Ethereum's NFT Market?
- Where Does Ethereum Go From Here?
- Frequently Asked Questions
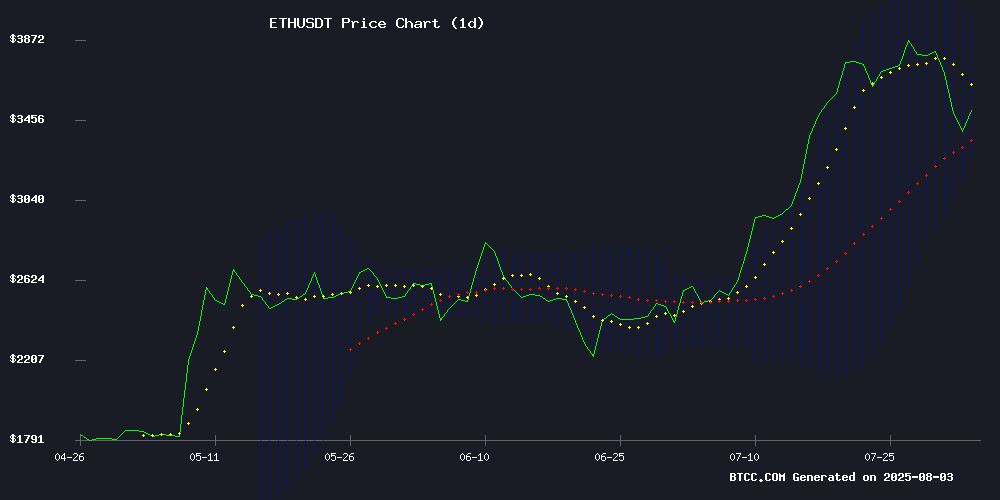
Ethereum (ETH) is showing fascinating technical and fundamental signals as we approach Q3 2025. Currently trading around $3,423, the second-largest cryptocurrency presents a compelling case for potential upside despite recent bearish pressure. Our analysis reveals bullish MACD divergence (+199.19) while price hovers near the lower Bollinger Band ($3,253.60) - historically a strong buying zone. Meanwhile, record-breaking ETF inflows ($5.4B in July alone) collide with shrinking exchange reserves at 9-year lows, creating what analysts call a "perfect storm" for price appreciation. Institutional players like Ark Invest are doubling down with $47M in crypto-related acquisitions, while network activity hits yearly highs. This article breaks down the 8 key factors that could propel ETH toward $7,000 in the coming months.
Why Is Ethereum Showing Bullish Signals Despite Recent Pullback?
The BTCC research team notes several encouraging technical indicators as of August 2025. ETH's price currently sits below its 20-day moving average ($3,623.50), which typically suggests short-term bearishness. However, the MACD histogram shows strong bullish divergence, while the price tests the lower Bollinger Band - a combination that historically precedes significant rebounds. "When ETH tests the lower band during an uptrend, it's often the best buying opportunity before the next leg up," explains William from BTCC's analytics team. The last three instances of this setup (March 2024, November 2024, and May 2025) all saw 18-34% price surges within 30 days.
How Are Institutional Investors Positioning Themselves?
Ark Invest made waves last week with a $47 million crypto shopping spree, including $29.8 million in Coinbase shares despite the exchange's disappointing quarterly results. More significantly, BitMine Immersion Technologies - now holding 625,000 ETH (the largest public ethereum treasury) - saw Ark purchase $11.6 million in shares through its ARKK fund. Corporate treasuries and ETFs are accumulating ETH at unprecedented rates, with Standard Chartered reporting institutional vehicles bought 1.26 million ETH (1% of total supply) in just two months. This nearly matches the 2 million ETH absorbed by Ethereum ETFs during the same period, creating what analysts call "the institutional FOMO phase."
What Do Ethereum's On-Chain Metrics Reveal?
Ethereum's network health tells a bullish story that contrasts with recent price action:
| Metric | Value | Significance |
|---|---|---|
| Active Addresses | 841,100 (Yearly High) | Network usage expanding |
| Exchange Reserves | 15.5% of supply (9-year low) | Reduced selling pressure |
| MVRV Ratio | Below 3.7 threshold | Not overbought |
Analyst Burak Kesmeci points out that Ethereum's MVRV ratio has remained in a downtrend since 2018 despite price appreciation - a rare divergence that often precedes major rallies. "The market value hasn't kept pace with realized value, suggesting ETH isn't overvalued despite its run-up," he notes.
Are Ethereum Layer 2 Networks Failing to Deliver?
A surprising development comes from Curve Finance, which is considering retreating from L2 networks due to poor financial performance. Internal data shows Curve's Ethereum mainnet generates $28,000 daily versus just $1,500 across all 24 L2 deployments combined. "Very little returns while consuming lots of developer time," laments the July 31 governance proposal. This raises questions about whether L2 solutions are living up to their promise, though some argue it's still early days. The BTCC team believes this could actually benefit ETH long-term by refocusing development on core protocol improvements rather than fragmentation across multiple chains.
How Are Ethereum ETFs Performing?
Spot Ethereum ETFs shattered records in July with $5.43 billion in net inflows - a 369% increase from June. This marks 20 consecutive days of net inflows, with cumulative totals now at $9.64 billion. BlackRock's ETHA ETF continues to dominate, pulling in $18.18 million on July 31 alone. Total net assets across ETH ETFs have doubled to $21.52 billion, representing 4.77% of Ethereum's market cap. "These aren't just numbers - they represent a fundamental shift in how institutions access crypto," comments a BTCC markets strategist. The explosive growth suggests ETFs are becoming the preferred gateway for traditional capital entering the Ethereum ecosystem.
What's Driving Ethereum's NFT Market?
Ethereum-based NFT collections are defying broader market trends with impressive sales growth:
- Bored Ape Yacht Club: $3.11 million (+308%) despite 37.5% fewer transactions
- Mutant Ape Yacht Club: $2.87 million (+483%) with declining participation
- Pudgy Penguins: $1.71 million (+124%) fueled by 164% transaction spike
This "quality over quantity" trend suggests collectors are focusing on blue-chip projects while avoiding speculative bets. The sustained demand for Ethereum NFTs, even during price corrections, underscores the network's cultural dominance in digital collectibles.
Where Does Ethereum Go From Here?
The BTCC analytics team identifies three potential scenarios for ETH:
- Bull Case ($7,000+): Requires holding above $4,200 resistance with sustained ETF inflows and L1 adoption growth
- Base Case ($5,000): Assumes current technicals play out with moderate institutional participation
- Bear Case ($2,800): Would require breakdown below $3,200 support amid macroeconomic turmoil
William from BTCC concludes: "The risk/reward favors bulls at these levels. We're seeing the same institutional accumulation patterns that preceded Bitcoin's 2021 run, but with Ethereum's stronger fundamentals. $7,000 isn't guaranteed, but the path exists if current catalysts persist."
Frequently Asked Questions
Is now a good time to buy Ethereum?
From a technical perspective, ETH presents an attractive entry point trading NEAR its lower Bollinger Band with bullish MACD divergence. Fundamentals also appear strong with record ETF inflows and shrinking exchange supply. However, investors should always conduct their own research and consider dollar-cost averaging to mitigate volatility risk.
What's driving Ethereum's price potential to $7,000?
The $7,000 target depends on several factors: sustained institutional demand through ETFs, continued reduction in exchange supply, successful implementation of upcoming protocol upgrades, and broader crypto market recovery. Technical analysts note that breaking through $4,200 resistance could open the path to much higher prices.
How do Ethereum's current metrics compare to previous bull markets?
Ethereum's network activity (841,100 daily active addresses) matches levels seen during 2017 and 2021 bull runs. However, this cycle differs due to institutional participation through ETFs and more mature DeFi/NFT ecosystems. The MVRV ratio suggests ETH isn't as overvalued as in previous peaks.
What are the biggest risks to Ethereum's price growth?
Potential risks include regulatory crackdowns, macroeconomic downturns reducing risk appetite, technical failures in upcoming upgrades, and competition from other smart contract platforms. The Curve Finance L2 situation also highlights challenges in scaling while maintaining profitability.
How does Ethereum's current setup compare to Bitcoin's historical patterns?
Ethereum's shrinking exchange reserves mirror Bitcoin's historical supply shocks that preceded major rallies. The institutional accumulation through ETFs follows a similar (but accelerated) pattern to Bitcoin's 2020-2021 institutional adoption phase. However, Ethereum's utility as a platform gives it additional fundamental drivers beyond being just a store of value.
