Bitcoin at $118K: Can BTC Really Hit $200,000 in 2025? Expert Analysis Reveals Key Signals
- BTC Technical Analysis: The Bullish and Bearish Signals
- The Institutional Dichotomy: Accumulation vs. Distribution
- The $9 Billion Whale Move That Shook Markets
- The Corporate Treasury Boom: Dot-Com Parallels?
- Technical Warnings: The Inverse Head-and-Shoulders Threat
- The Path to $200K: What Would It Take?
- Frequently Asked Questions
can BTC really reach $200,000 this cycle? Our DEEP dive into technical indicators, institutional activity, and market psychology reveals a complex picture. While corporate treasuries are accumulating at record pace, massive whale movements and bearish technical signals create crosscurrents that could make or break Bitcoin's next major move. Here's what the charts, the whales, and the institutions are telling us about BTC's potential path to $200K.
BTC Technical Analysis: The Bullish and Bearish Signals
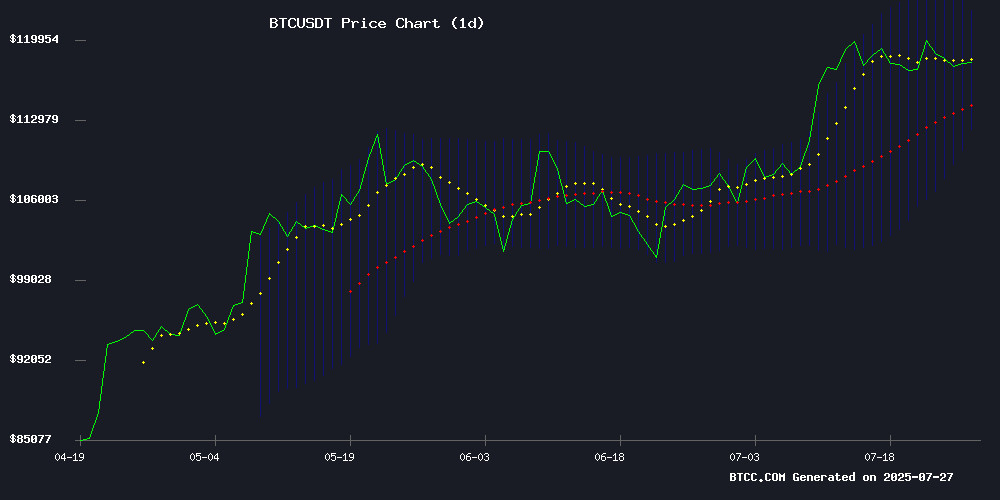
Bitcoin currently trades at $117,871, dancing just above its 20-day moving average of $117,323 - a critical short-term support level. The MACD indicator shows a bearish crossover, but there's a silver lining: the gap between the MACD line and signal line has narrowed significantly from -4,353 to -2,485, suggesting weakening downward momentum.

Bollinger Bands paint an interesting picture with prices trapped between $112,116 (lower band) and $122,531 (upper band). "This compression typically precedes big moves," notes the BTCC research team. "The key question is whether we break up through $122K resistance or down through $112K support."
The Institutional Dichotomy: Accumulation vs. Distribution
While retail investors watch price charts, institutions are making billion-dollar moves. Two conflicting narratives dominate:
| Bullish Signal | Bearish Signal |
|---|---|
| Corporate treasury buying (MicroStrategy, Metaplanet) | Galaxy's $9B BTC sale from dormant wallets |
| ETF inflows continuing | Exchange whale ratio at 0.52 (historically bearish) |
| Realized cap surpassing $1 trillion | Long liquidations accelerating |
This institutional tug-of-war creates what analysts call a "compressed spring" scenario - the more energy builds up from these opposing forces, the more explosive the eventual breakout could be.
The $9 Billion Whale Move That Shook Markets
Galaxy Digital's execution of an 80,000 BTC ($9B) sale represents one of the largest single transactions in bitcoin history. CryptoQuant CEO Ki Young Ju traced these coins to the defunct MyBitcoin platform, dormant for 14 years. The market's ability to absorb this sell pressure without collapsing below $115K suggests remarkable underlying demand.
"When you see this much BTC move after over a decade," observes veteran trader Scott Melker, "it makes you wonder how many other sleeping giants might wake up." The transaction highlights Bitcoin's maturation - what WOULD have crashed markets in 2017 now gets digested with relative ease.
The Corporate Treasury Boom: Dot-Com Parallels?
Public companies now hold over $200 billion in Bitcoin on their balance sheets. Swan Bitcoin notes this accumulation differs fundamentally from past cycles: "This isn't retail FOMO - it's cold, calculated corporate strategy." Some analysts draw parallels to the dot-com era's treasury investments, but with a crucial difference - Bitcoin's fixed supply versus endless tech share issuance.
The math is compelling: if just 5% of Fortune 500 companies allocated 1% of their cash reserves to BTC, that's $50+ billion in demand against an annual supply of just 162,000 new coins. This supply-demand dynamic fuels the $1M price speculation among Bitcoin maximalists.
Technical Warnings: The Inverse Head-and-Shoulders Threat
Not all signals point upward. Chartered Market Technician Aksel Kibar warns of a potential drop to $109,000, citing an inverse head-and-shoulders pattern on weekly charts. This formation, typically bullish when breaking upward, suggests bearish reversal potential in the current context.
Supporting this caution, the URPD metric shows sparse historical transaction volume between $110K-$115K - creating a potential "air pocket" where prices could fall rapidly if support breaks. Below $110K, however, lies dense support from accumulated positions between $90K-$110K.
The Path to $200K: What Would It Take?
Reaching $200,000 from current levels requires a 70% surge - ambitious but not unprecedented in Bitcoin's history. Key milestones would include:
- Breaking through $122,531 (Bollinger upper band)
- Recapturing $123,091 (recent high)
- Clearing $150,000 (psychological resistance)
- Sustaining above $175,000 (Fibonacci extension level)
The BTCC team notes that while technicals suggest potential, "The institutional confirmation is what could sustain a rally beyond $150K." Corporate treasury announcements, ETF inflows, and sovereign adoption news would likely serve as catalysts.
Frequently Asked Questions
What's the most important support level for Bitcoin right now?
The $115,000-$118,000 zone represents critical short-term support, with the 20-day MA at $117,323 acting as immediate confirmation. Below this, $110K and $105K become important psychological levels.
How significant was Galaxy's $9B Bitcoin sale?
It ranks among the top 10 largest BTC transactions ever, but the market absorbed it relatively well. More concerning is whether it signals early holders taking profits en masse.
Are we in a Bitcoin bubble similar to dot-com?
There are parallels in corporate treasury behavior, but Bitcoin's fixed supply creates fundamentally different dynamics. The current rally shows less retail euphoria than previous cycles.
What would trigger a drop below $100K?
Sustained break below $110K could open path to $100K, especially if combined with macroeconomic shocks or regulatory crackdowns. However, institutional demand appears strong at these levels.
When might Bitcoin hit $200K if the bull run continues?
In optimistic scenarios, late 2025 remains possible, but would require sustained institutional inflows and no major macroeconomic setbacks. More conservative estimates suggest 2026.

