Sui Price Prediction: SUI Bulls Eye Double-Digit Surge Targeting $4.44 Milestone

SUI's charging ahead—bulls are loading up for a potential breakout that could push prices toward that coveted $4.44 target.
Market Momentum Builds
Fresh capital's flowing into Sui as traders bet on a double-digit climb. The token's showing strength while traditional assets wobble—another reminder that crypto moves faster than your average hedge fund's quarterly report.
Technical Signals Flash Green
Breaking resistance levels could open the path toward higher gains. No guarantees, of course—but then again, when has crypto ever offered those?
Watch those key levels. Miss this pump, and you’re just another spectator.
Sui on-chain and derivatives show bullish sentiment
DeFiLlama data show that SUI’s decentralized exchange (DEX) trading volume ROSE from $552.91 million on Saturday to $561.63 million on Thursday, marking the highest volume in September and indicating growing trader interest and liquidity, which bolsters the platform’s bullish outlook.
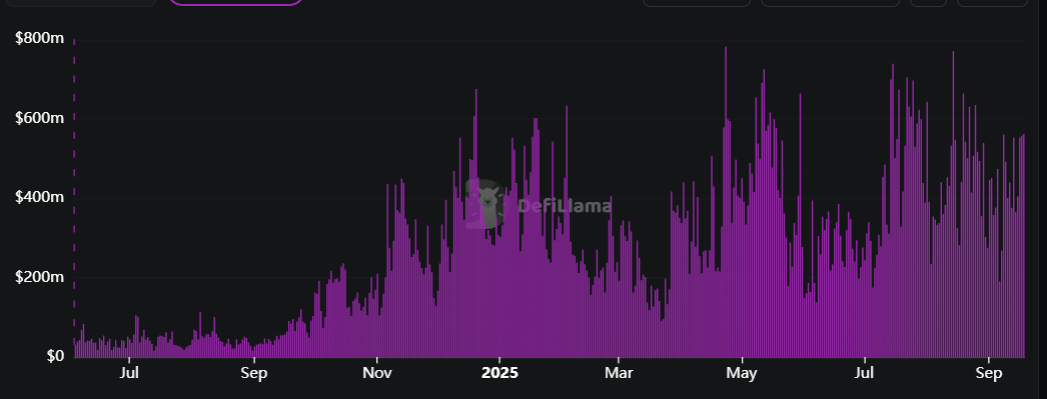
SUI DEX trading volume chart. Source: DefiLlama
Apart from rising trading volume, derivatives data also support a rally for Sui. Coinglass’s OI-Weighted Funding Rate data shows that the number of traders betting that the price of SUI will slide further is lower than those anticipating a price increase.
The metric is rising positively and stands at 0.0091% on Thursday, indicating that longs are outperforming shorts and supporting the bullish sentiment.
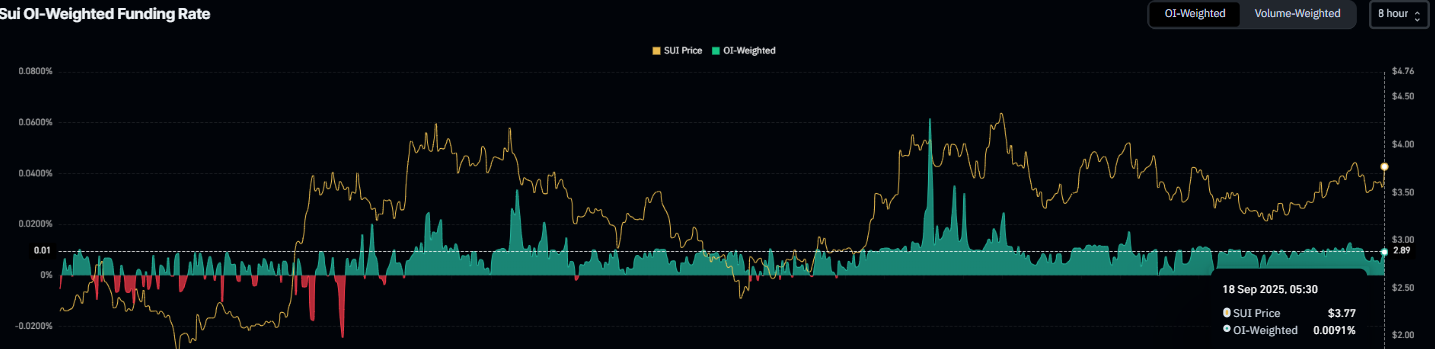
Sui funding rate chart. Source: Coinglass
Sui Price Forecast: Bulls aiming for 16% gains
Sui price broke above the falling wedge pattern on September 10 and rallied nearly 10% by Saturday. However, on Sunday, SUI failed to maintain the upward momentum and corrected 7.83% until the next day. On Tuesday, SUI retested and found support around the 50-day Exponential Moving Average (EMA) at $3.55 and rose 4.76% the next day. At the time of writing on Thursday, SUI continues to trade at a higher level around $3.82.
If SUI continues its upward momentum, it could extend the rally by 16% from its current level to reach its July 28 high at $4.44.
The Relative Strength Index (RSI) on the daily chart reads 59, above its neutral level of 50, and points upward, indicating that bullish momentum is gaining traction. The Moving Average Convergence (MACD) indicator on the same chart displayed a bullish crossover on September 7, which remains in effect, indicating sustained bullish momentum and an upward trend ahead.

SUI/USDT daily chart
However, if SUI faces a correction, it could extend the decline toward its 50-day EMA at $3.55.
