Polkadot Price Forecast: Failed Supply Control Referendum Fails to Lift Investor Sentiment - What’s Next for DOT?

Polkadot's latest governance vote crashes and burns—investors shrug as supply control proposal gets rejected. The community's bid to tighten DOT's monetary policy just hit a brick wall, leaving traders questioning the network's deflationary momentum.
Market Reaction Tells the Story
Prices barely flinched on the news—proof that crypto voters love theory more than action. While other chains aggressively burn tokens or cap supplies, Polkadot's decentralized democracy just opted for the status quo. No supply shock, no hype cycle, just another day in governance theater.
Where Does DOT Go From Here?
Without artificial scarcity mechanisms, Polkadot must rely on actual adoption to drive value. That means parachain activity, developer growth, and real-world utility—you know, the boring fundamentals that never seem to moon as hard as a good token burn narrative. Maybe next referendum they'll propose something truly innovative, like a committee to study the committee that studies supply issues.
Another day, another crypto proposal that promised change but delivered more meeting notes than market moves. At this rate, Wall Street's old-school brokers might start looking like efficient decision-makers by comparison.
New referendum fails to uplift investors' confidence
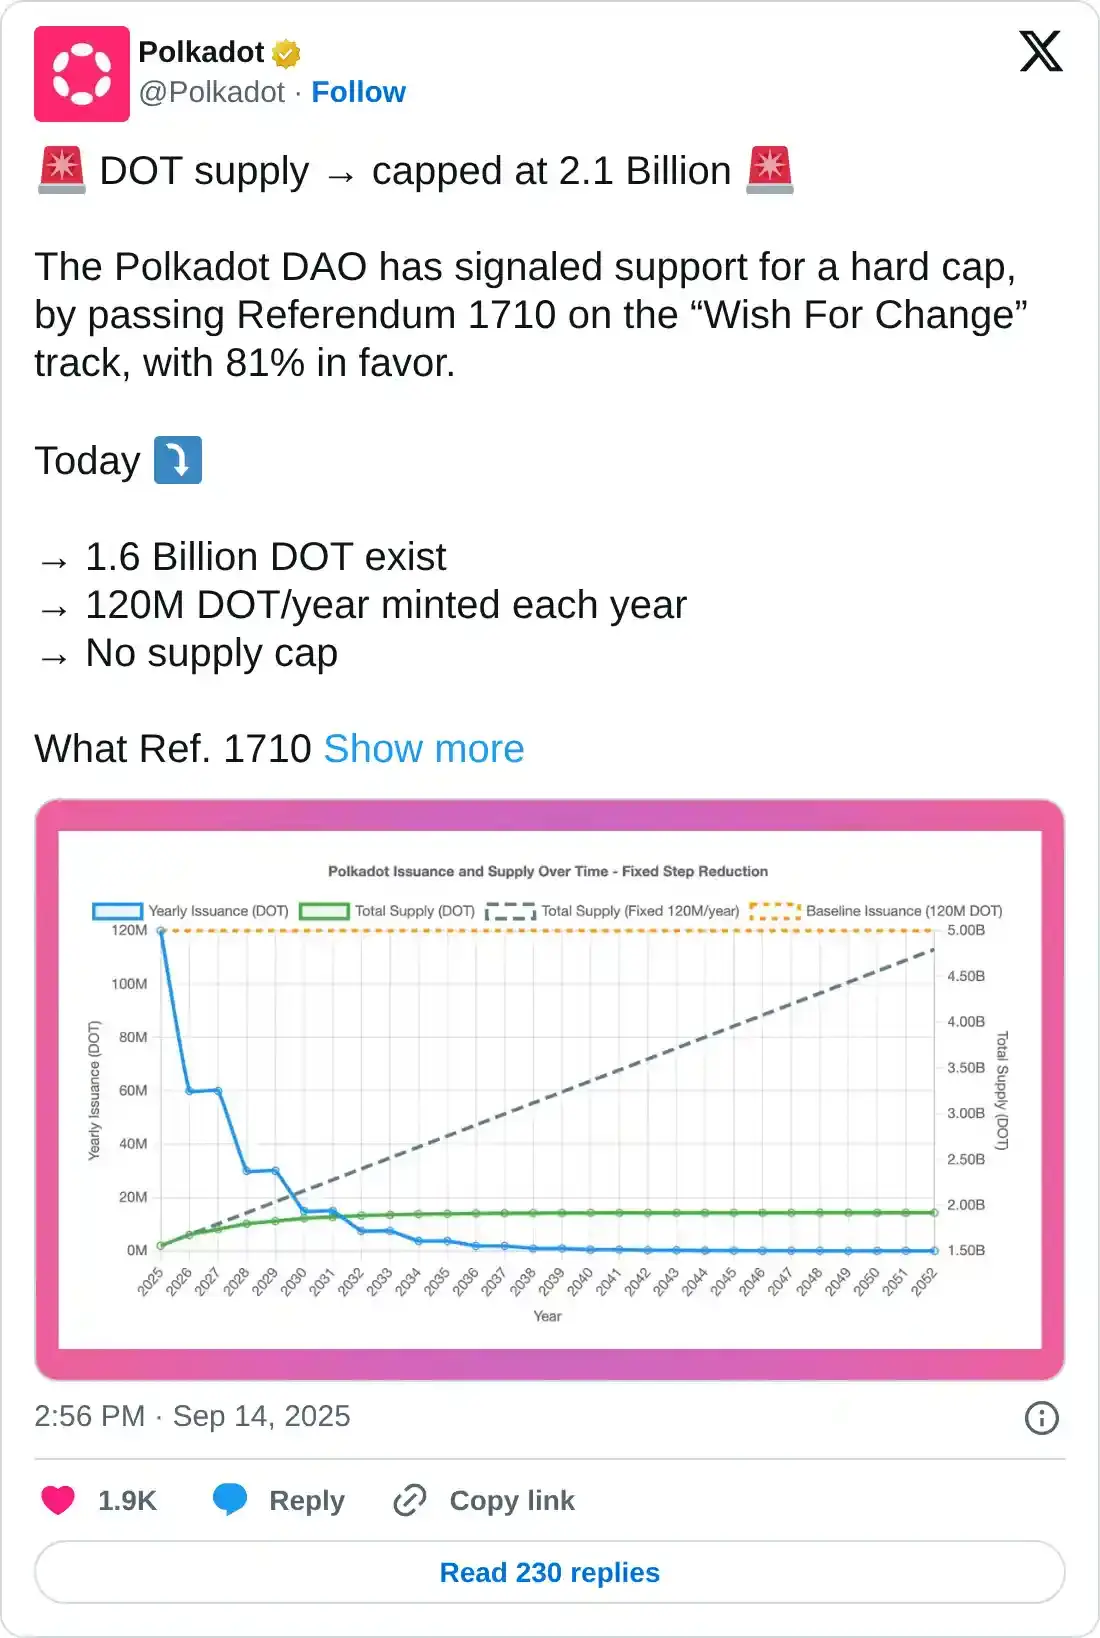
Polkadot’s DAO passed the “Wish For Change” referendum on Sunday with an 81% support, limiting the maximum supply of DOT tokens to 2.1 billion. This marks a shift from the previous policy of no supply cap, which could result in a lowered selling pressure, aligning with the broader market trend of buybacks and token burns.
The referendum also introduces a step-down feature in DOT token issuance every 2 years on Pi Day (March 14), which will reduce the current 120 million DOT issued annually and reach a supply of 1.91 billion tokens by 2040.
Polkadot struggles to hold above $4
Despite the Polkadot ecosystem’s active effort to change its tokenomics, DOT reacted negatively, resulting in the previous two consecutive days of losses. At the time of writing, DOT ticks higher by nearly 1%, holding above the broken trendline of a symmetrical triangle pattern on the daily chart.
CoinGlass data shows that the DOT Open Interest has declined by nearly 5% over the last 24 hours, reaching $575.9 million. This indicates a large outflow from Polkadot derivatives as traders lose interest.
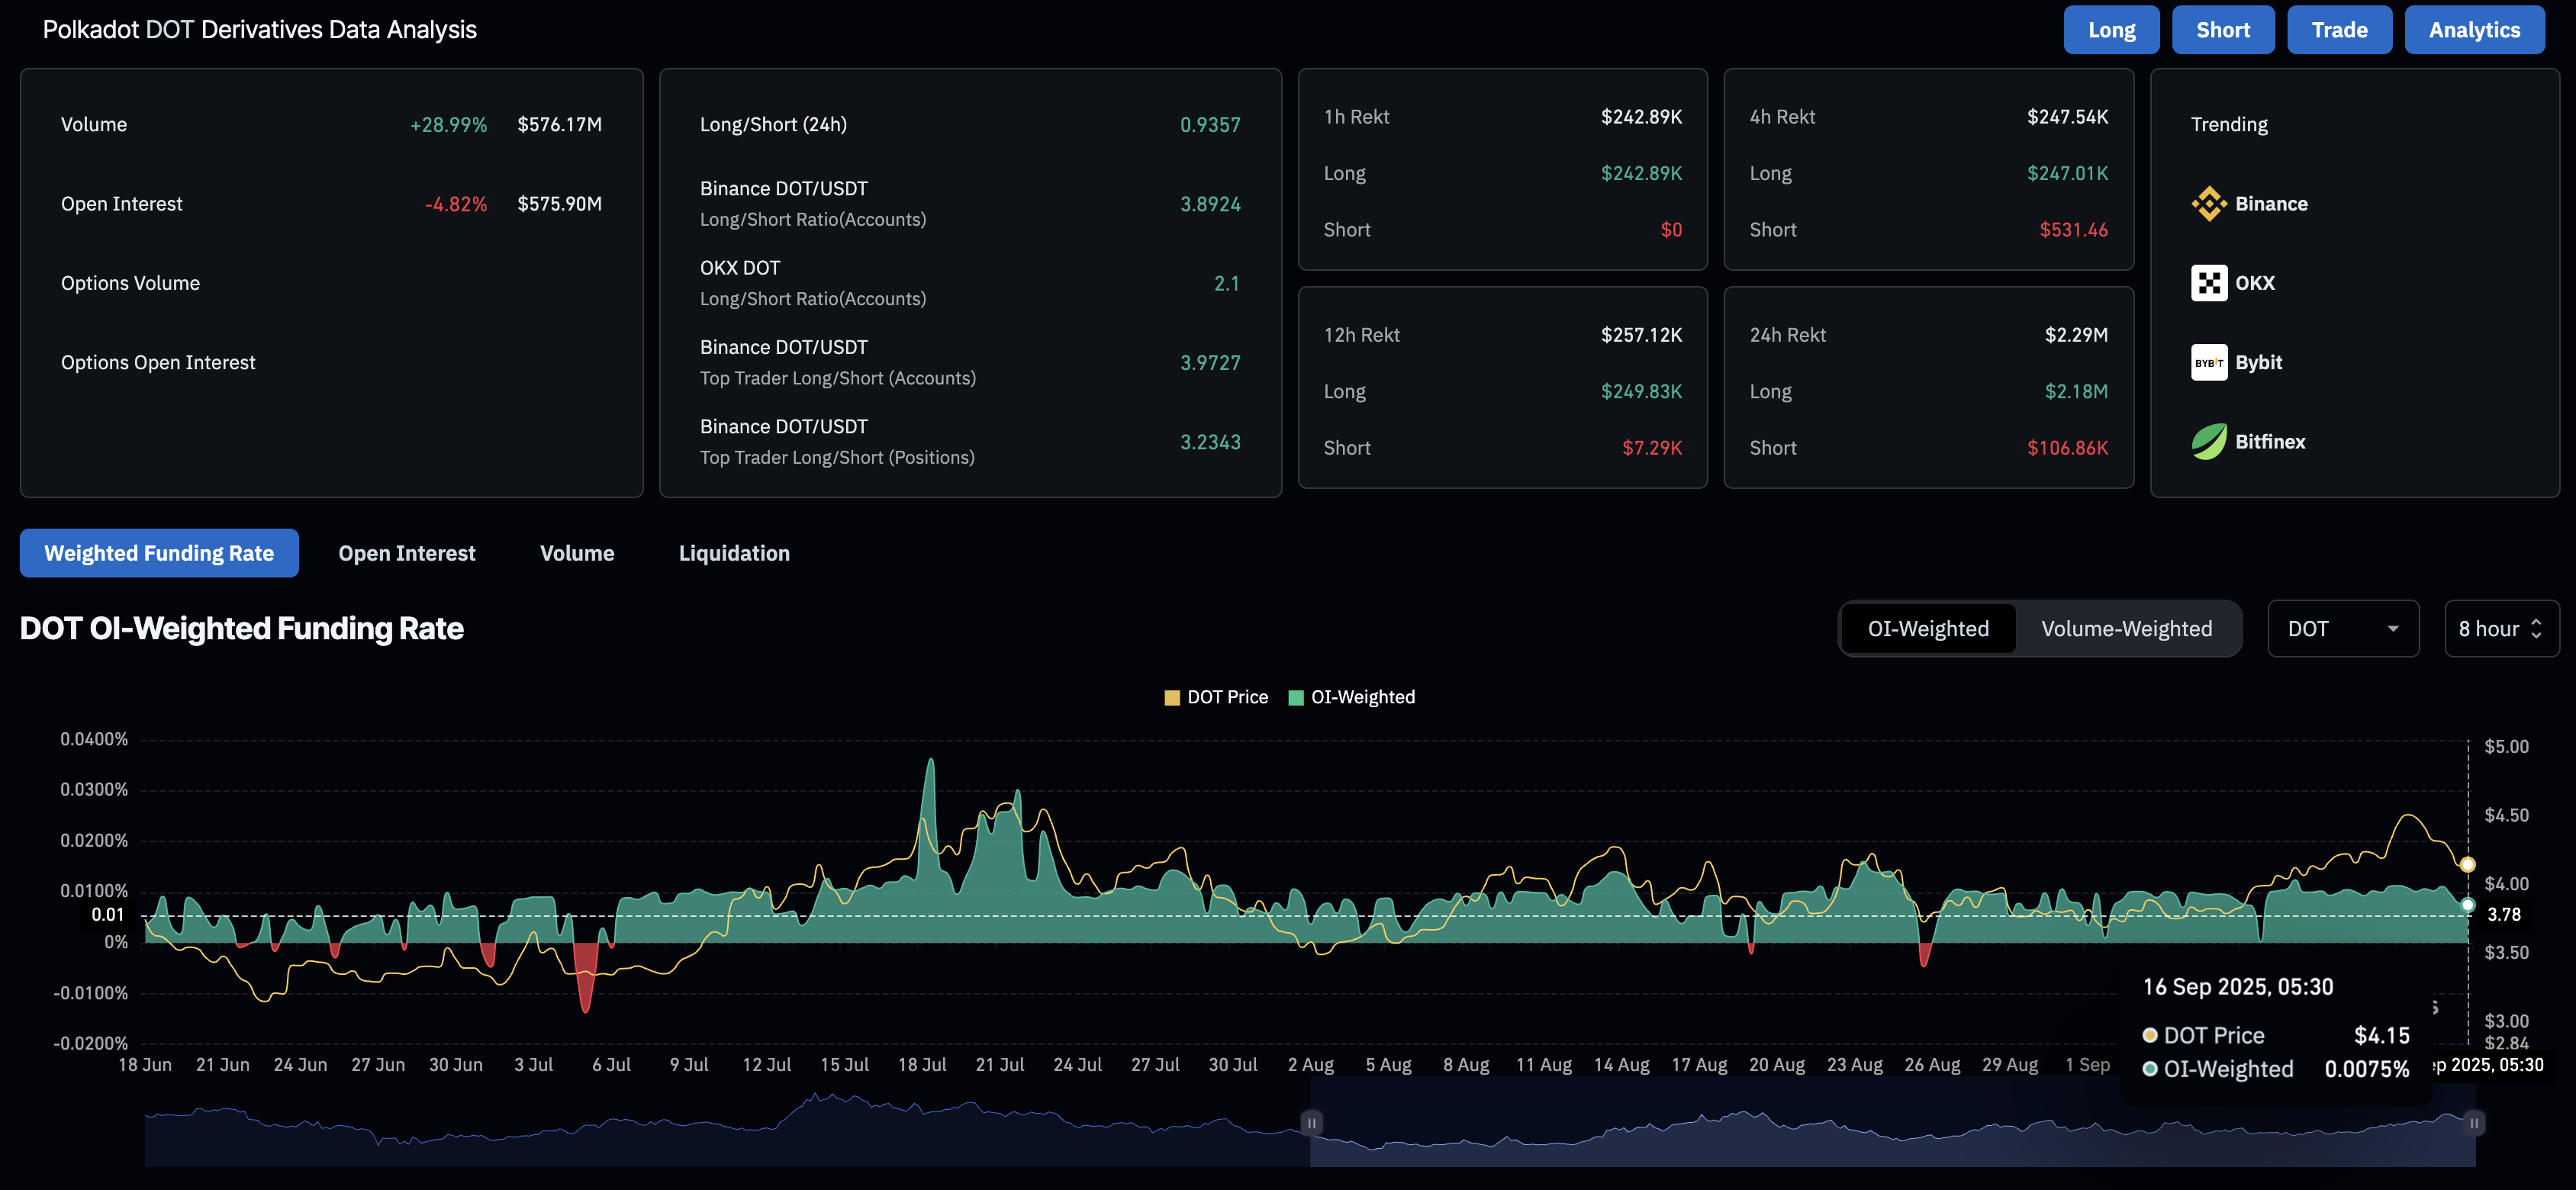
DOT derivatives. Source: CoinGlass
Looking down, a drop below the 100-day Exponential Moving Average (EMA) at $4.011 WOULD invalidate the chances of a bounce back. In such a case, DOT could extend the decline to $3.689, last tested on September 2.
The technical indicators on the daily chart indicate a significant decline in bullish momentum as the Relative Strength Index (RSI) drops to 54 from NEAR the overbought boundary. At the same time, the Moving Average Convergence Divergence (MACD) retraces to its signal line, hinting at a potential crossover that would indicate a bearish shift in trend momentum, triggering a sell signal for sidelined investors.
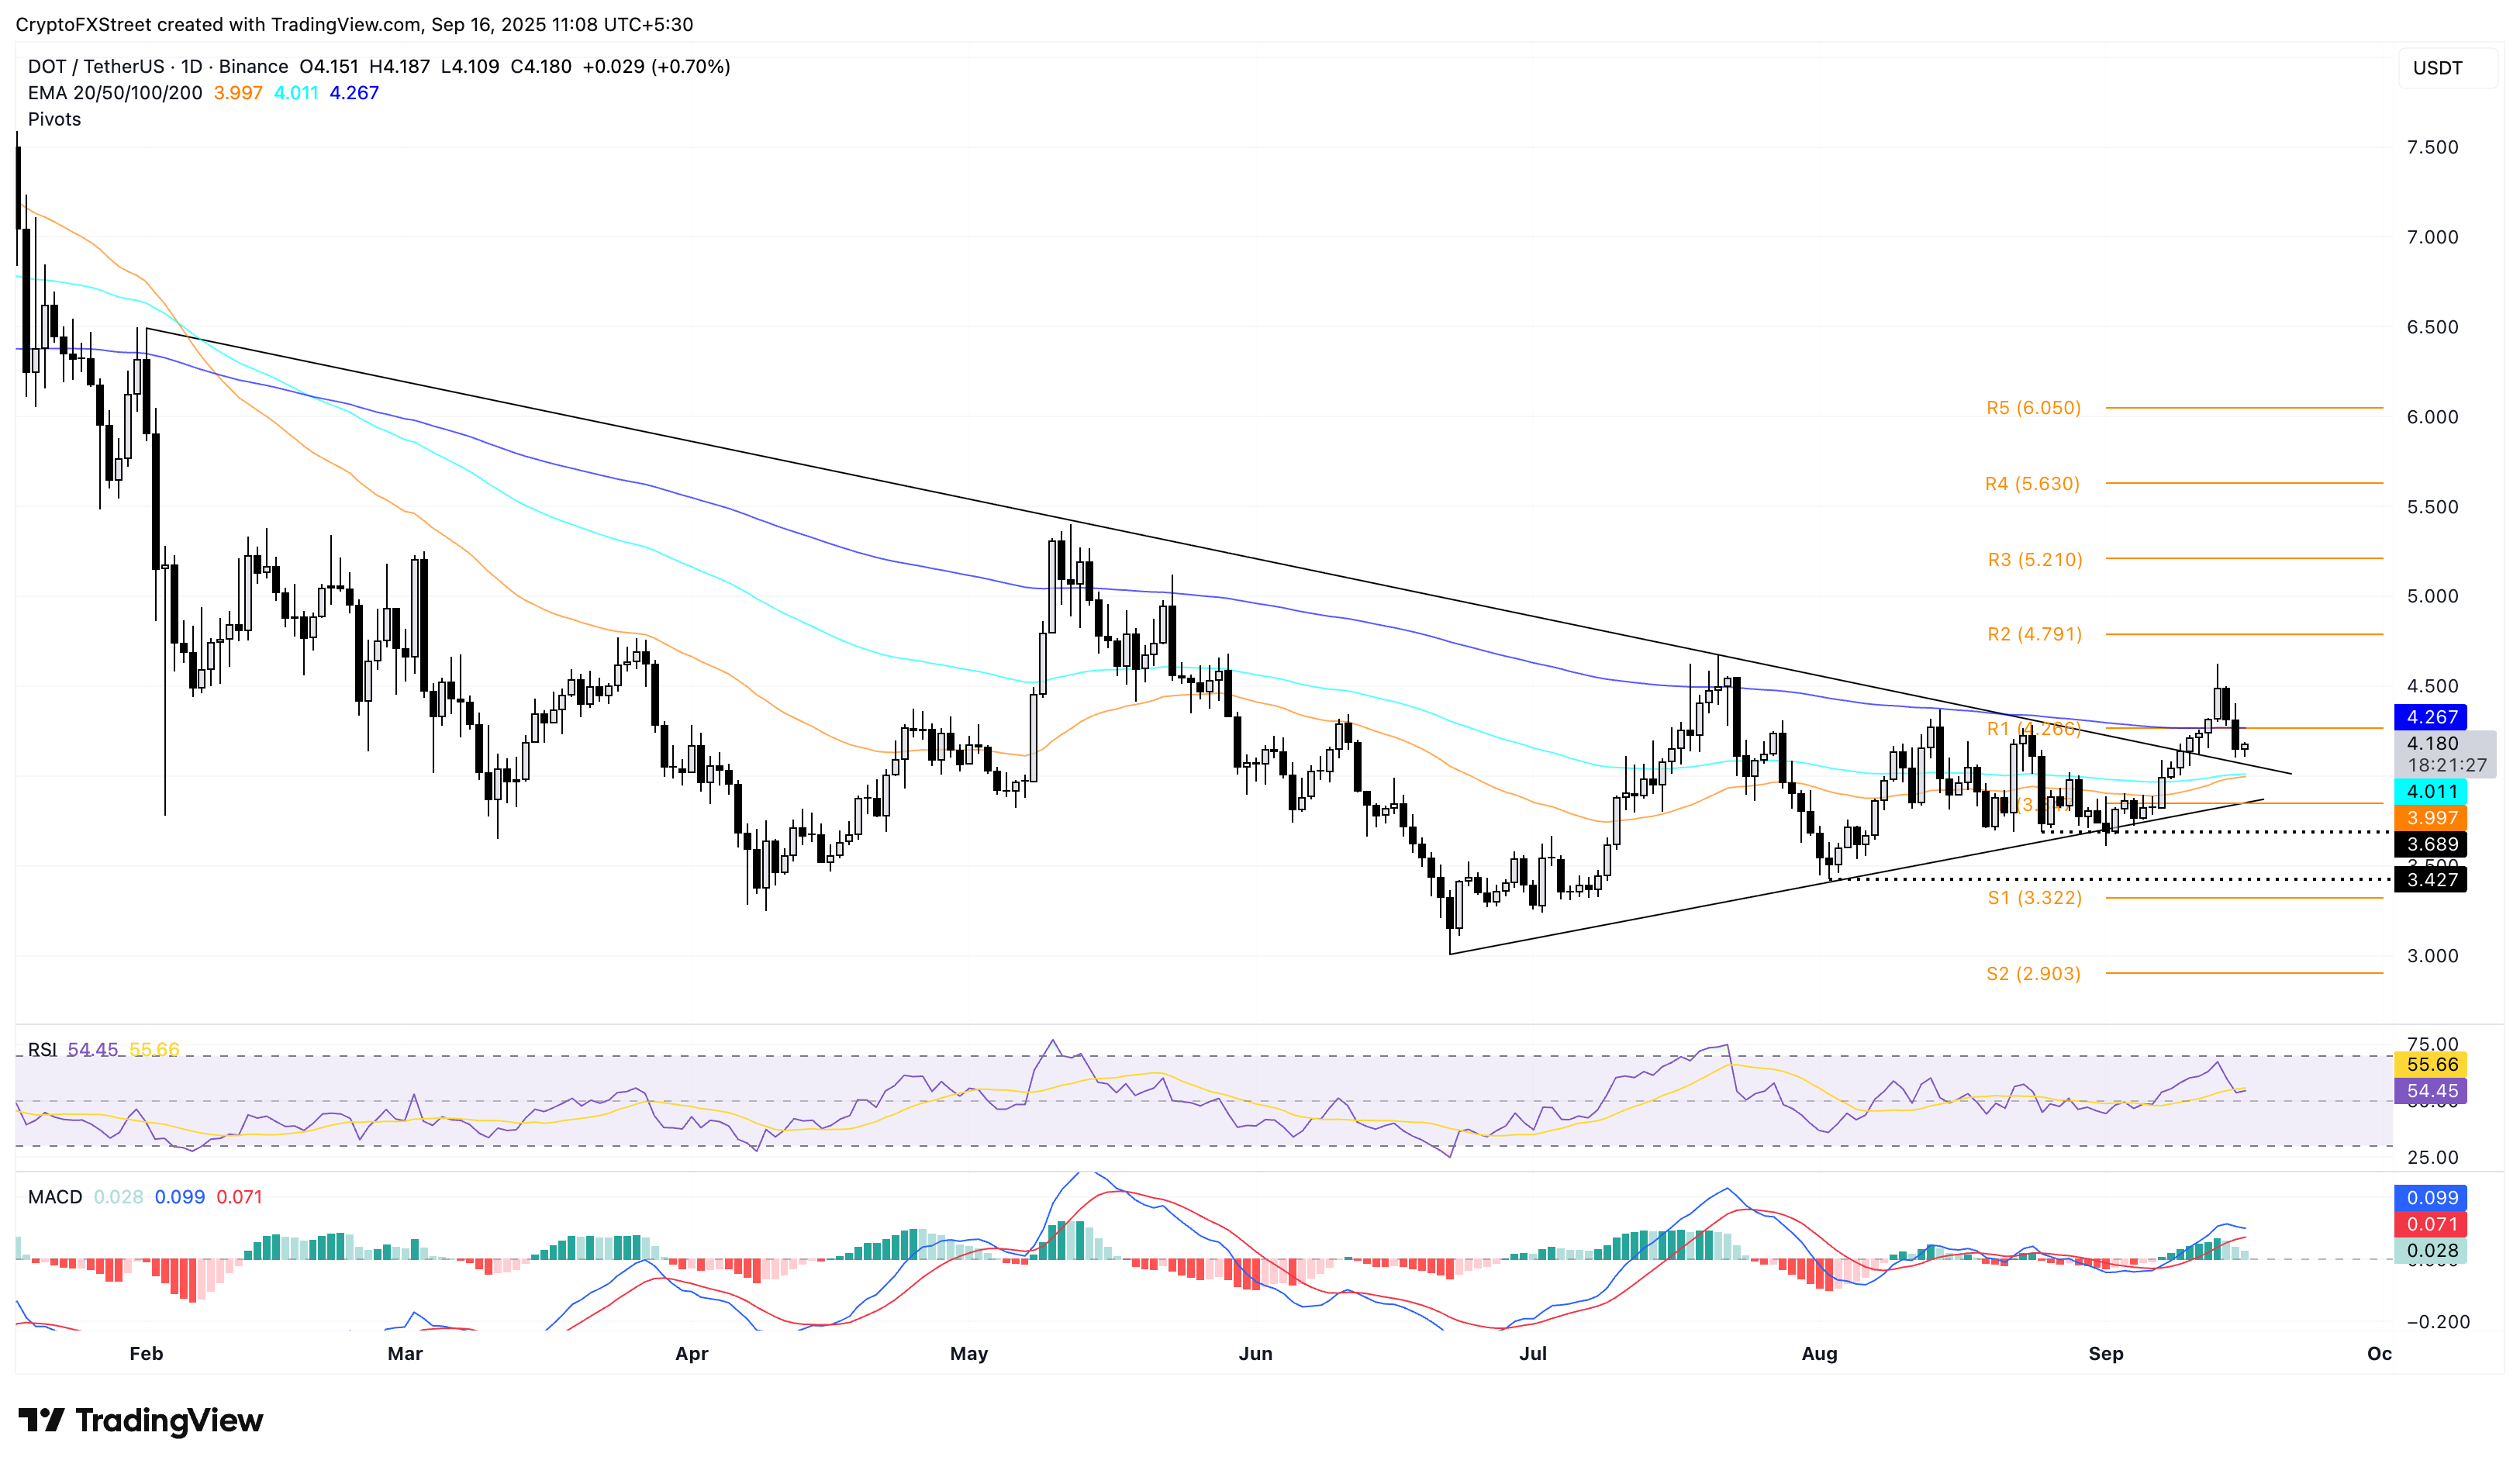
DOT/USDT daily price chart.
On the flip side, the intraday recovery should surpass the R1 pivot level at $4.266, aligning with the 200-day Exponential Moving Average (EMA), to reinforce an uptrend. A potential upside extension could target the R2 pivot level at $4.791.
