Tron’s Remarkable Recovery Surges as Retail Demand Defies Revenue Decline

TRX bulls are back in charge—retail traders are piling in despite the platform's revenue taking a hit. Mainstream finance might not get it, but the crowd's voting with their wallets.
Retail FOMO Ignites Rally
Forget what the balance sheets say—Tron's network activity tells a different story. Transaction volumes are climbing, new addresses are popping up, and the community's doubling down while traditional metrics waver.
Revenue Dip? What Revenue Dip?
Sure, the numbers might show a pullback in protocol earnings, but since when did crypto investors care about fundamentals? The momentum's building, and sometimes that's all that matters in this space.
Defying the Odds—And Logic
Tron's latest push proves once again that in crypto, narrative often trumps math. While Wall Street analysts scratch their heads, retail's busy stacking TRX—because nothing makes sense until it suddenly does.
Tron retail demand surges, ignoring revenue slump
The retail demand for TRON is on the rise, resulting in a surge in TRX Open Interest (OI) and short liquidations. CoinGlass data shows that the TRX OI has surged by nearly 2% over the last 24 hours, reaching $476.95 million. This upsurge in capital inflows in TRX highlights the increased demand among traders.
Additionally, the short liquidations over the last 24 hours stand at $245,750, outpacing the long liquidations of $35,310, reflecting a larger wipeout of bearish-aligned positions. This boosts the long-to-short ratio to 1.0255, where values above 1 indicate a greater number of active long positions.
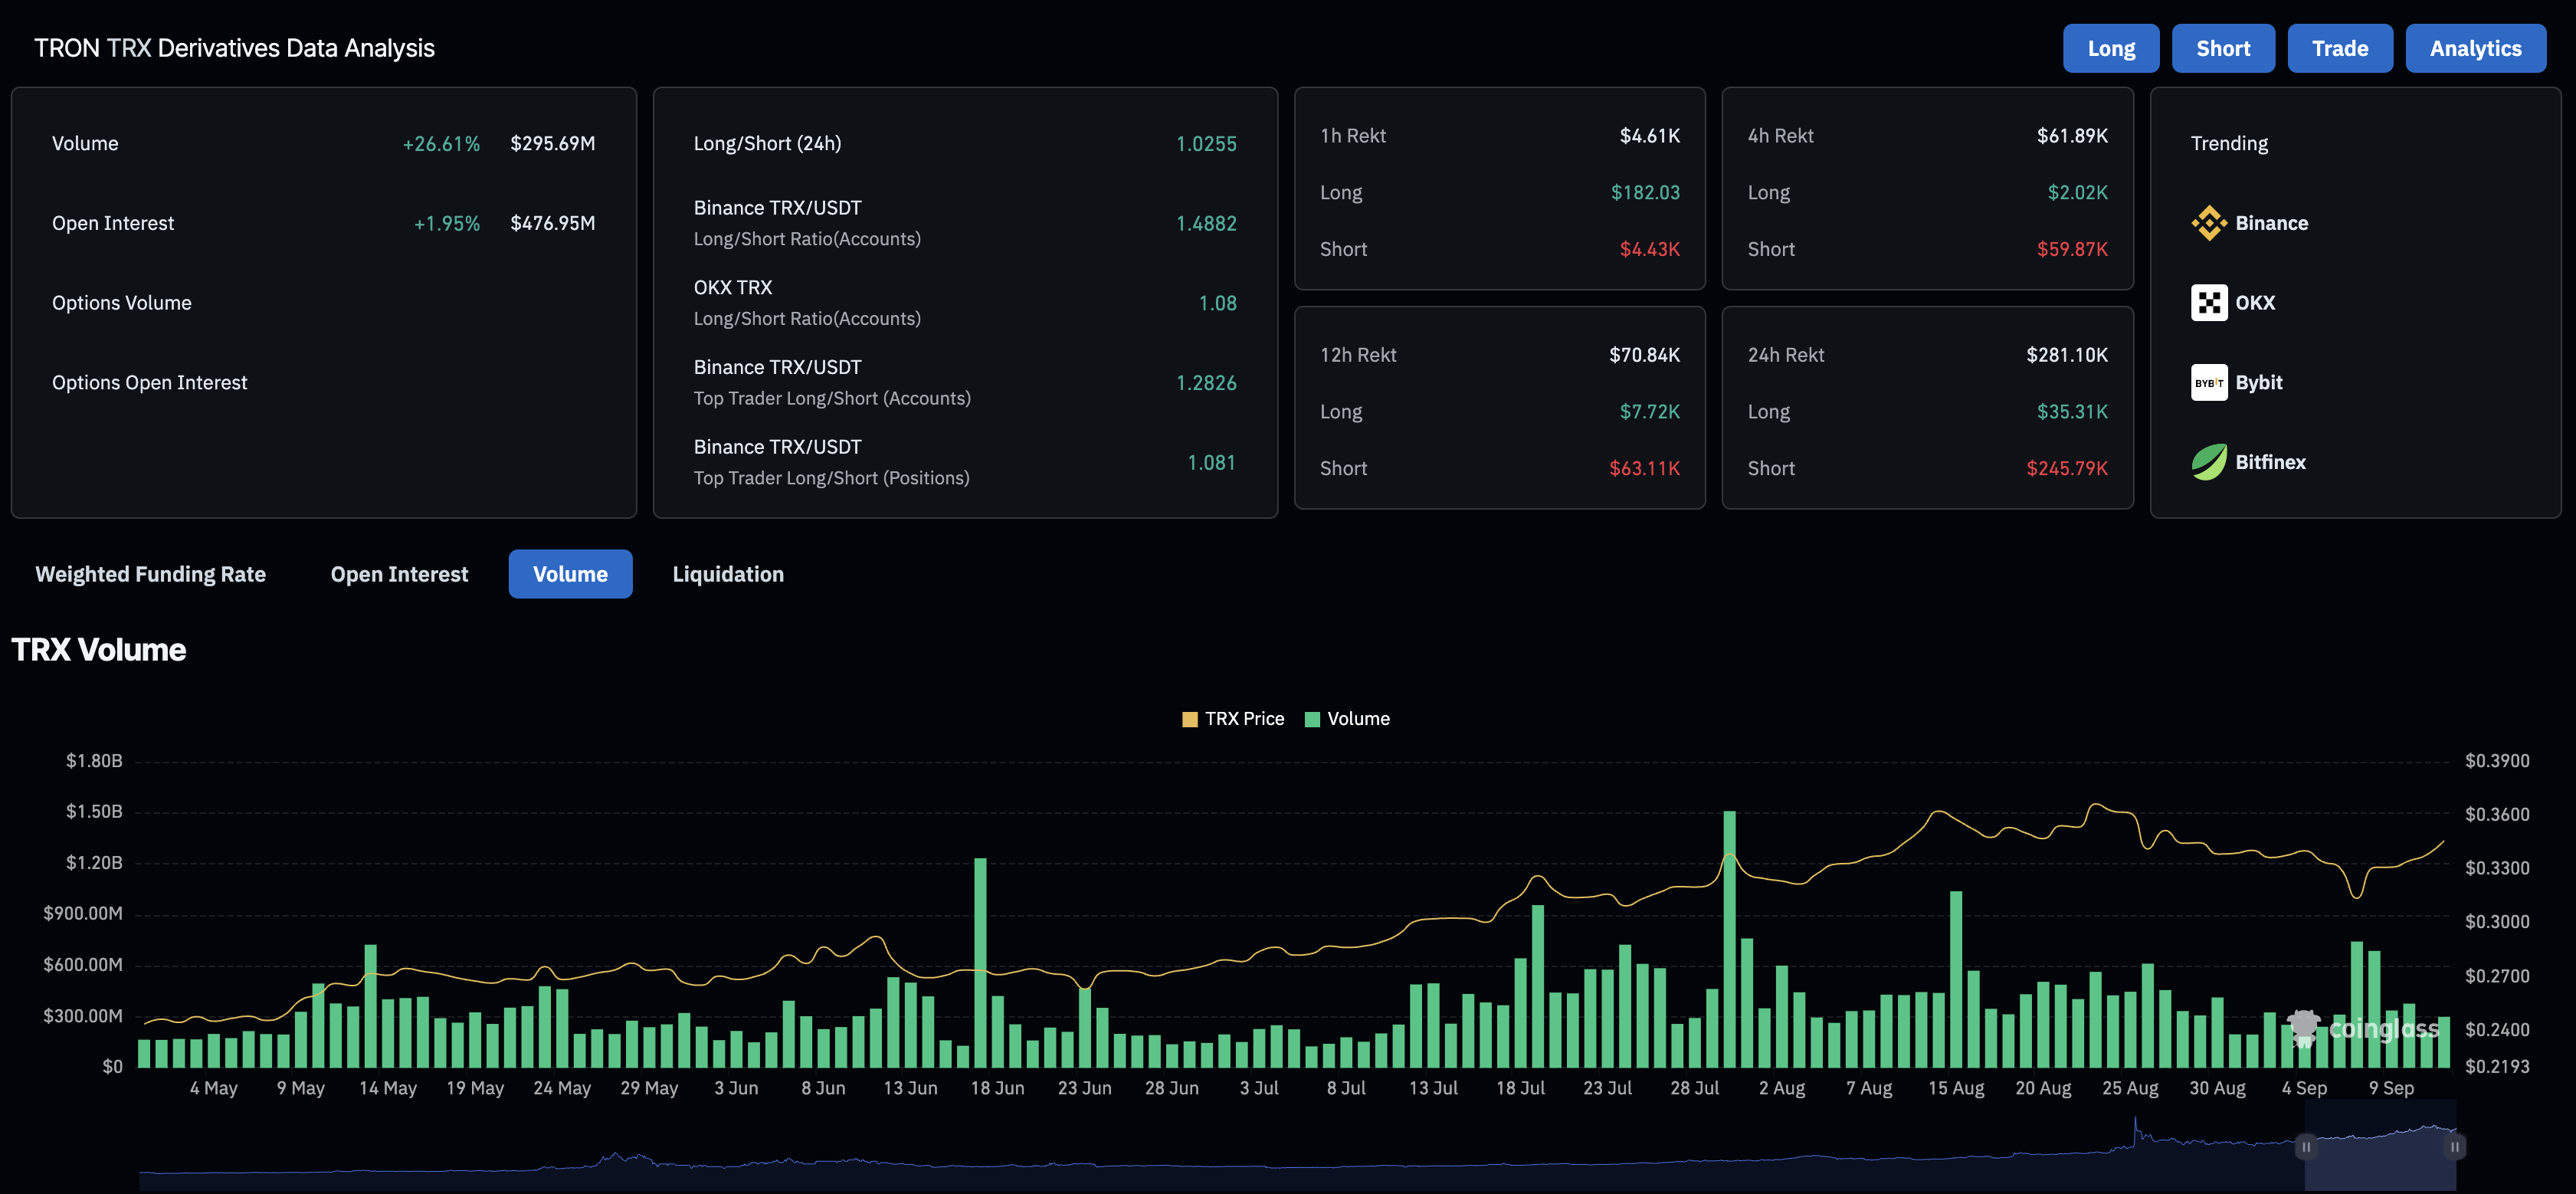
TRX Derivatives. Source: Coinglass
Meanwhile, the on-chain data reveals an underlying weakness, as network revenue has dropped significantly this week. TronScan data shows that the total protocol revenue collected on Thursday amounted to $7.99 million. This represents a significant decrease in revenue compared to the late August collections of over $15 million.
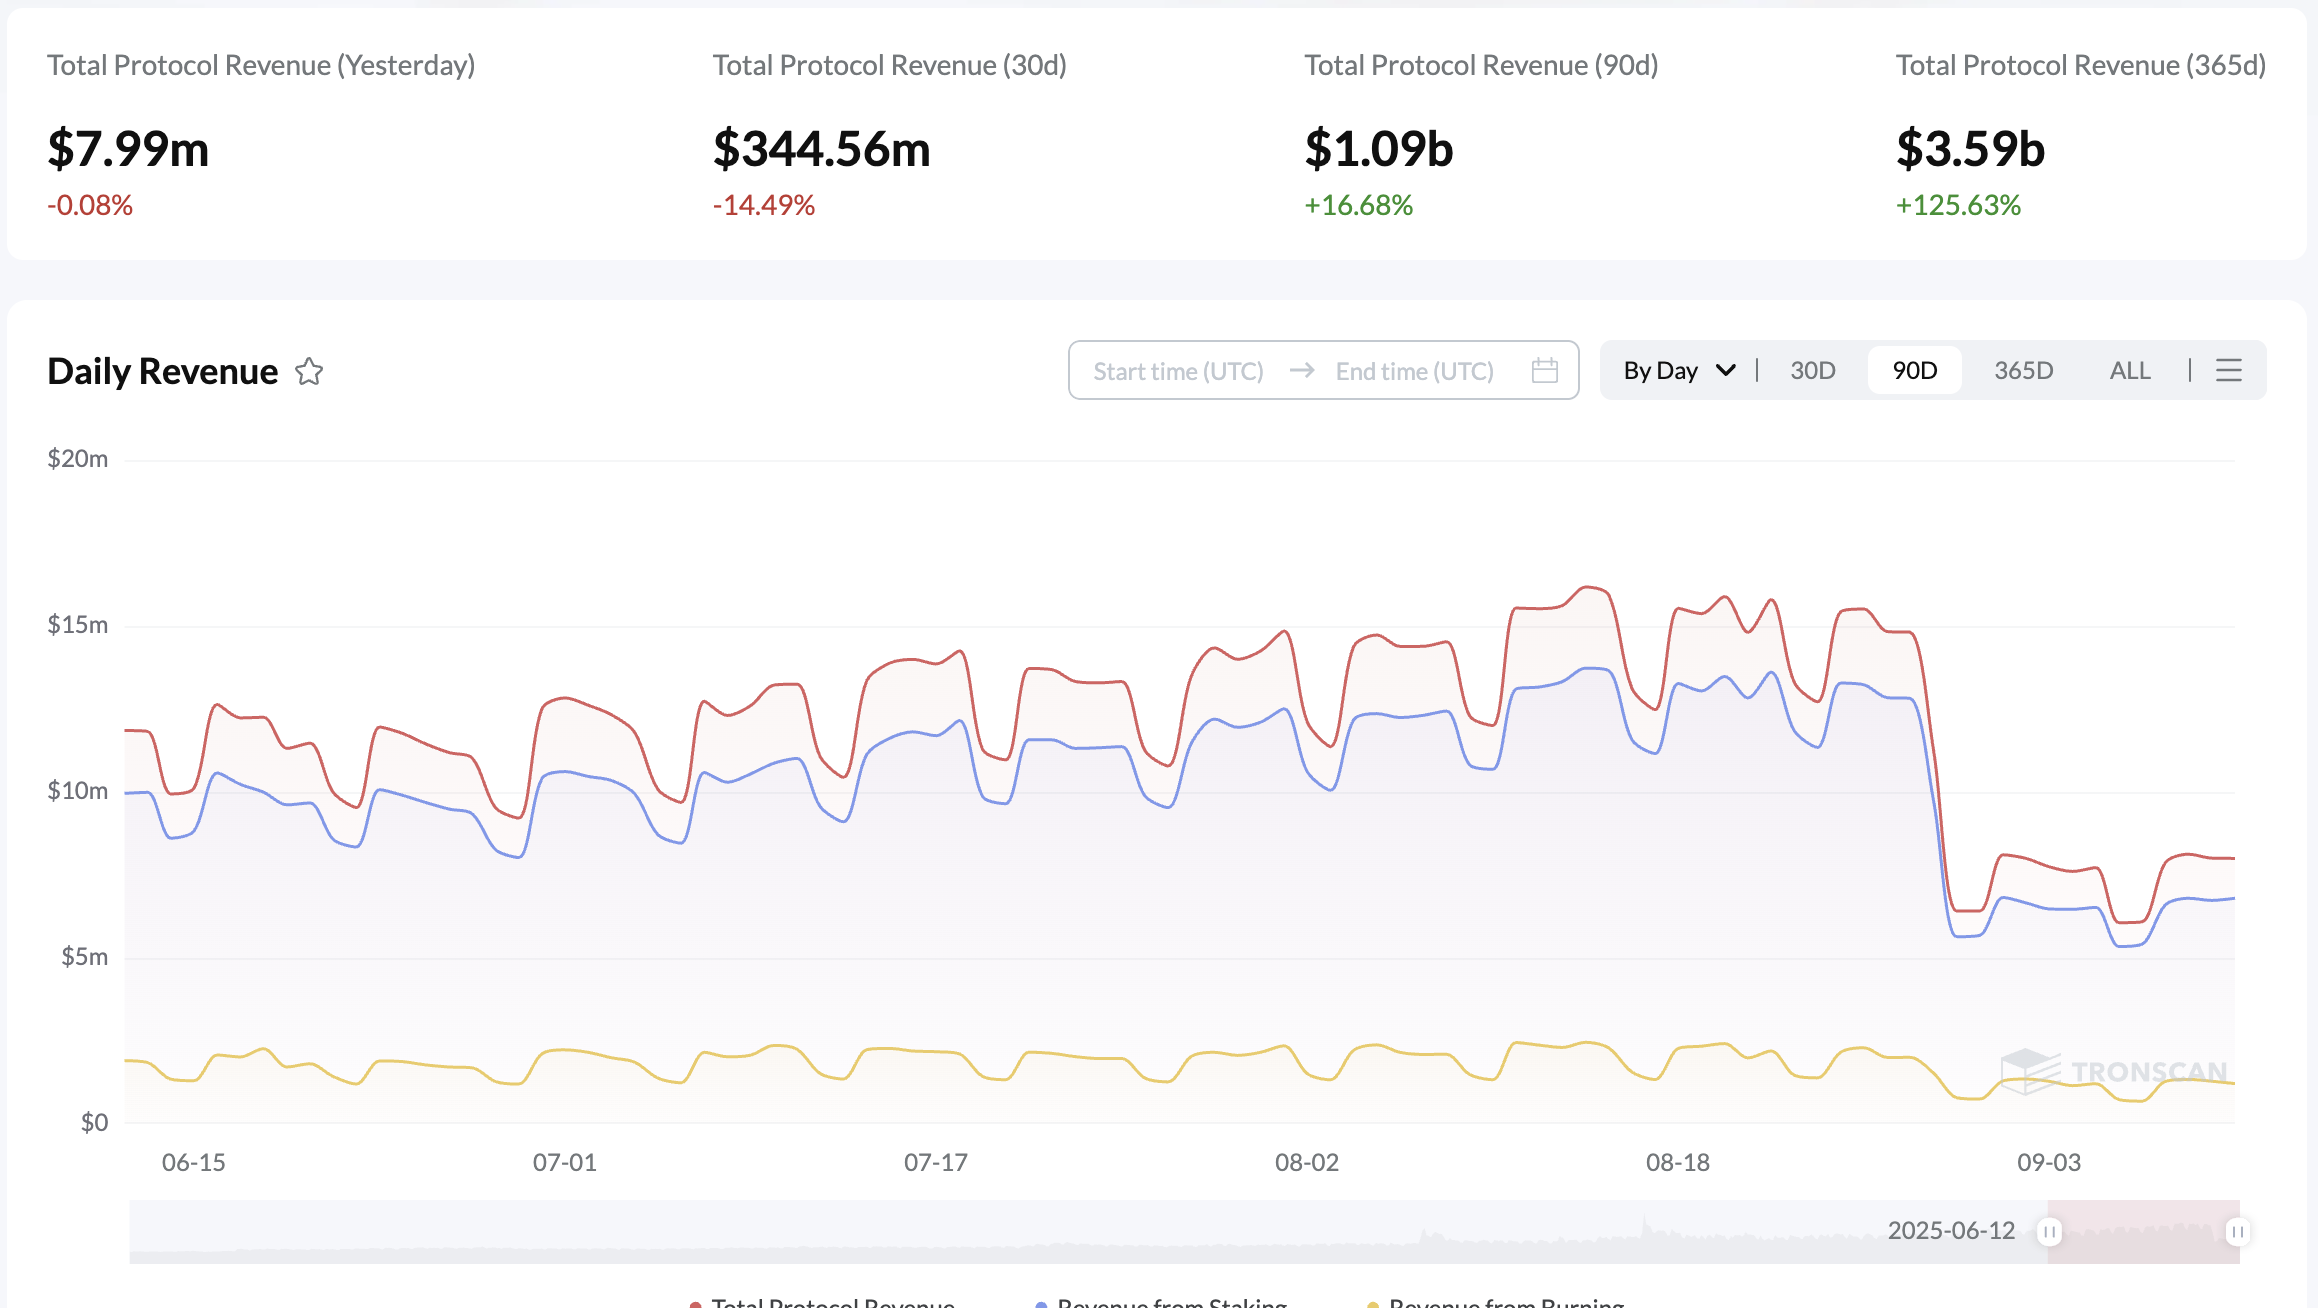
Tron network revenue. Source: TronScan
Tron eyes a V-shaped pattern breakout
Tron forms a V-shaped recovery pattern on the daily chart by bouncing off the 100-day Exponential Moving Average following the rising channel breakdown in late August. At the time of writing, tron trades above $0.3400 on Friday, inching close to the $0.3510 resistance marked by the July 29 high, which also acts as the neckline of the V-shaped pattern.
A decisive close above this level could prolong the Tron rally to the $0.3700 mark, aligning with the August 14 high.
Adding to the bullish potential, the momentum indicators on the daily chart project a positive shift. The Moving Average Convergence Divergence (MACD) crosses above its signal line, resulting in a fresh green histogram bar above the zero line, which indicates that the bullish momentum is resurfacing.
Additionally, the Relative Strength Index (RSI) at 57 slopes upward toward the overbought zone, suggesting that the buying pressure is increasing.
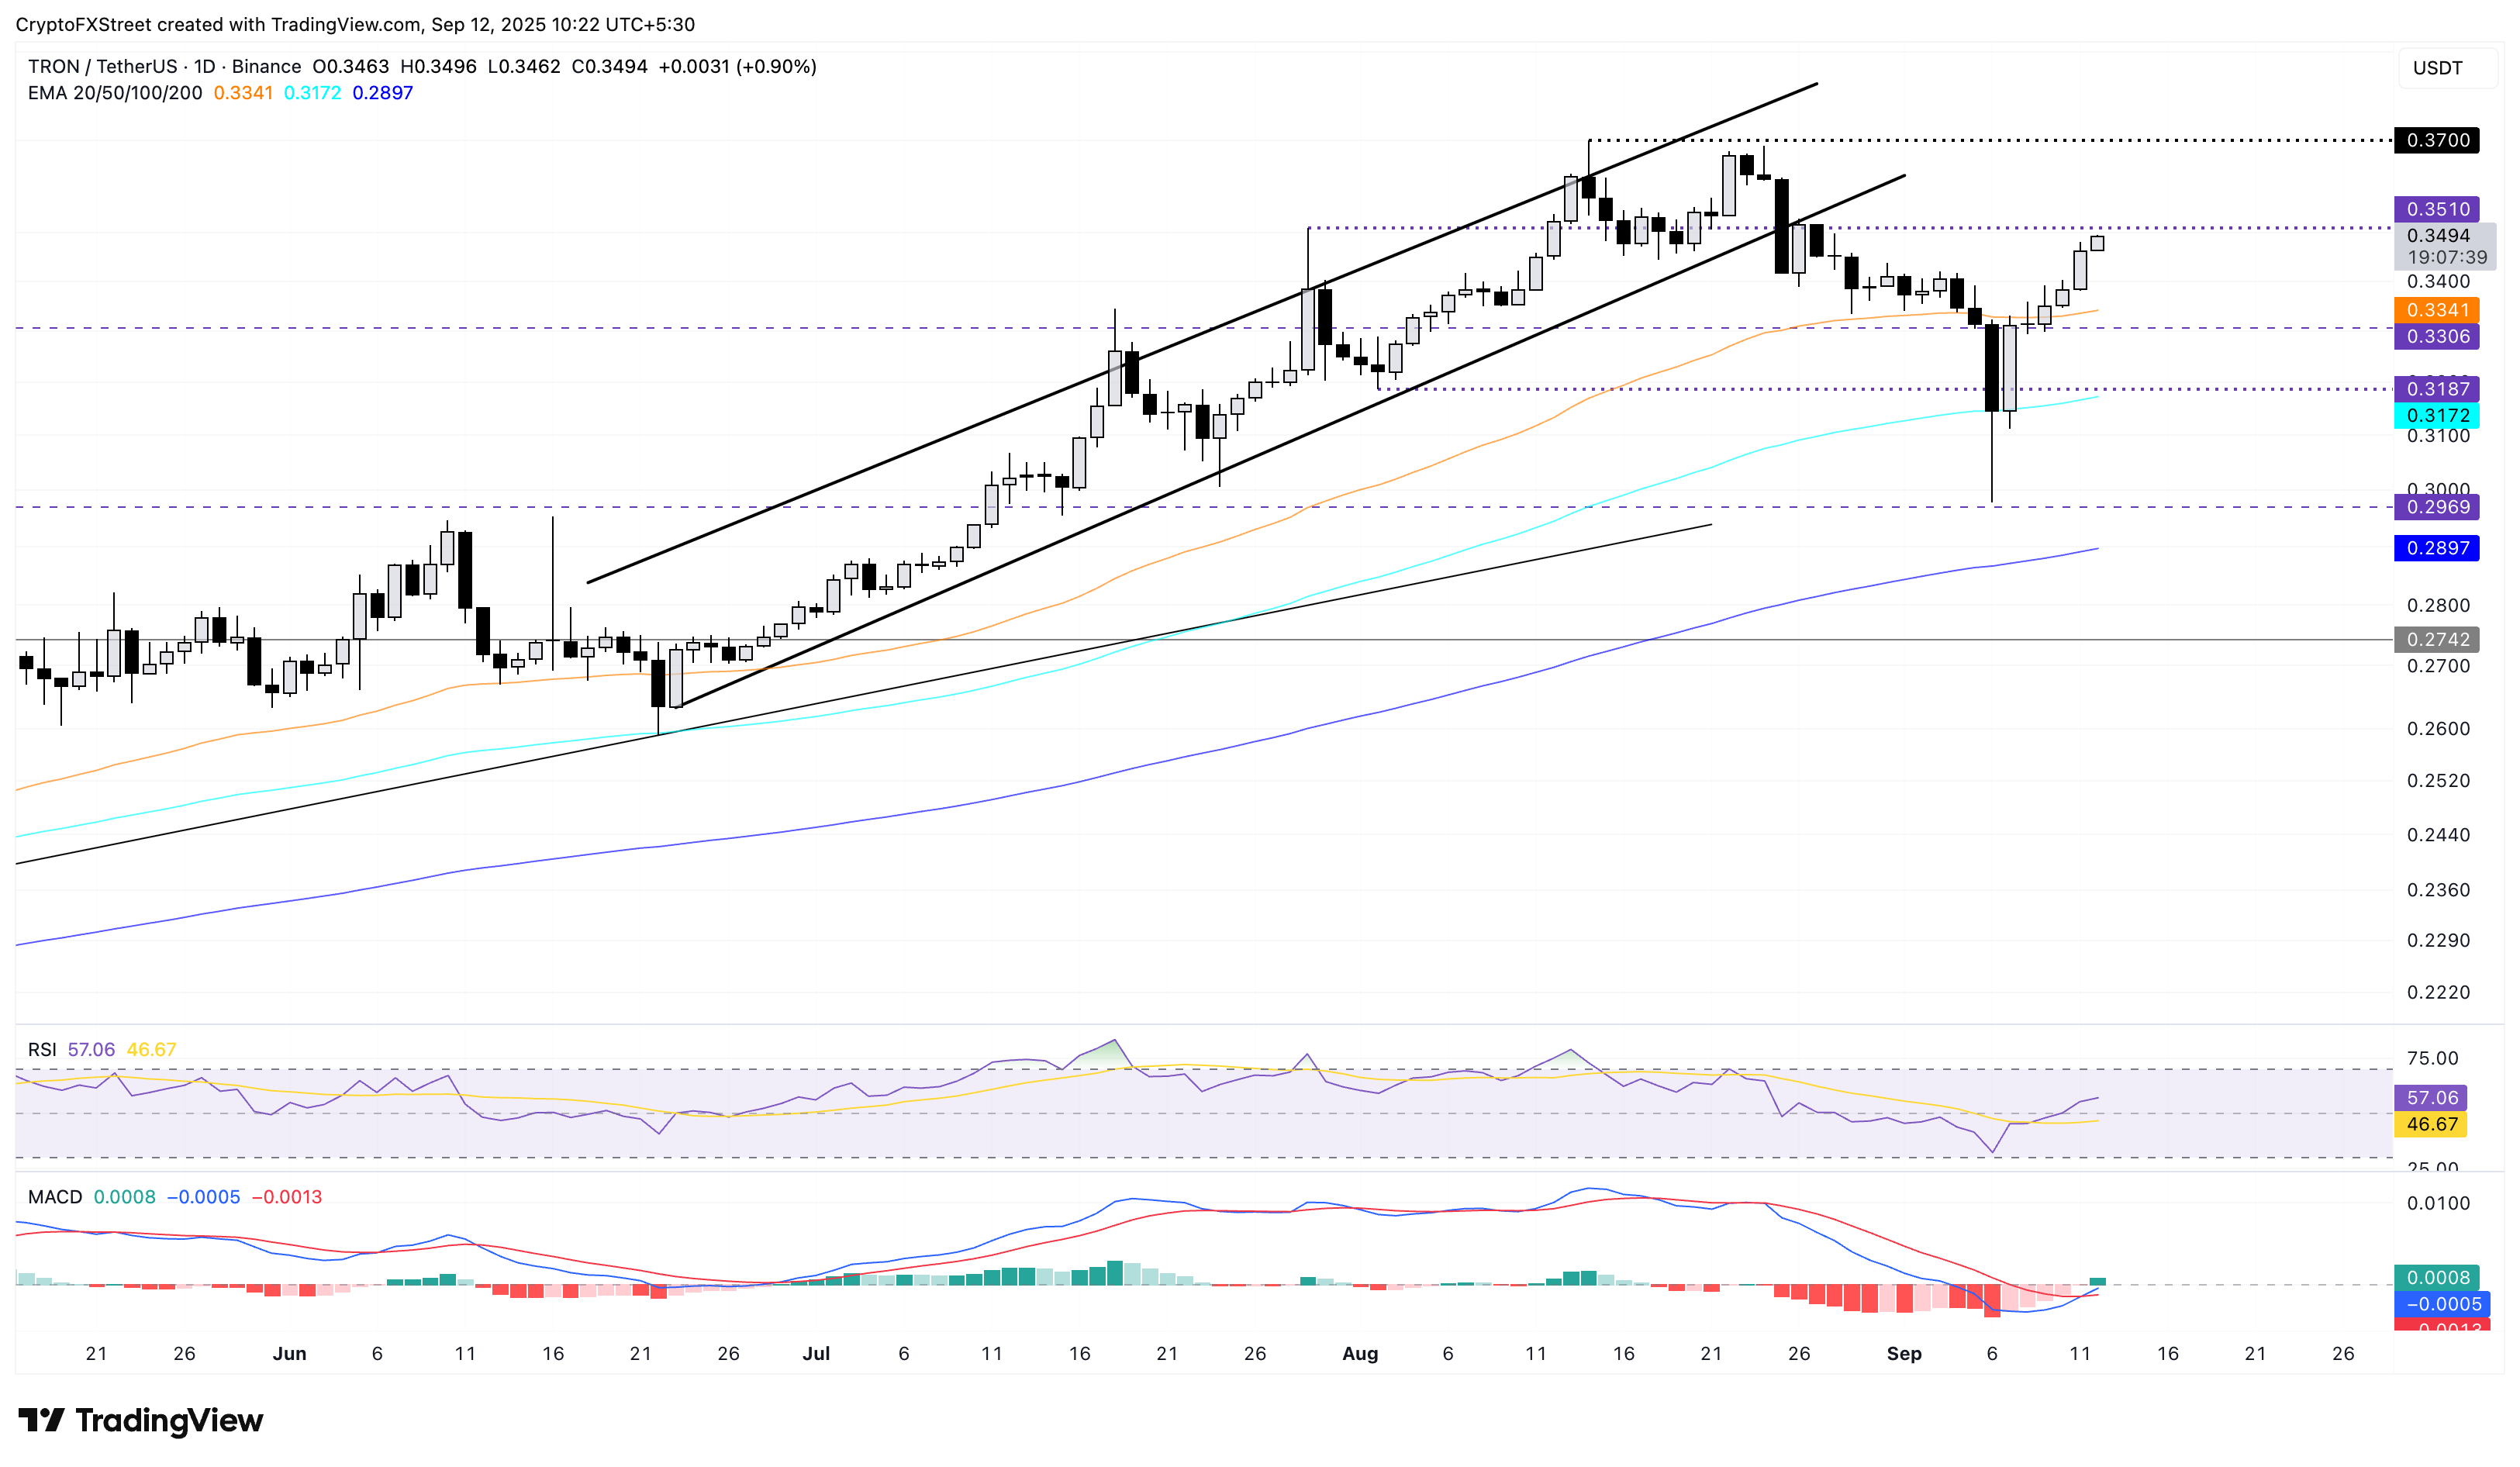
TRX/USDT daily price chart.
Looking down, if TRX flips from the $0.3510 resistance level, it could decline to the 50-day EMA at $0.3341.
