🚀 Bitcoin Eyes $120K, Ethereum Targets $5K, Ripple Aims for $3.4 – Here’s Why Bulls Are Taking Over

Crypto markets roar back as institutional money floods in—ignoring traditional finance's skepticism.
Bitcoin's Next Leap
Analysts spot bullish patterns suggesting a run toward $120,000. Increased adoption and shrinking supply fuel the momentum.
Ethereum's Ascent
Smart contract activity and scaling upgrades push ETH toward the $5,000 mark. DeFi isn’t slowing down—it’s accelerating.
Ripple's Resurgence
Legal clarity and cross-border payment demand could propel XRP to $3.40. Because nothing says 'disruption' like bypassing SWIFT.
Sure, Wall Street still thinks crypto is a casino—but who’s laughing now as portfolios hit all-time highs?
Bitcoin bulls aiming for the $120,000 mark
Bitcoin price kicked off the week with modest gains, initially facing rejection at the 50-day Exponential Moving Average (EMA) at $113,129 before regaining momentum midweek. It rallied over 2% on Wednesday to close above this key level and extended its advance the following day. At the time of writing on Friday, it is nearing its daily resistance at $116,000.
If BTC closes above the daily resistance at $116,000 on a daily basis, it could extend gains toward its key psychological level at $120,000.
The Relative Strength Index (RSI) on the daily chart reads 58, which is above its neutral level of 50, showing that bullish momentum is gaining traction. The Moving Average Convergence Divergence (MACD) indicator displayed a bullish crossover on Saturday, which remains in effect, indicating sustained bullish momentum and an upward trend ahead.
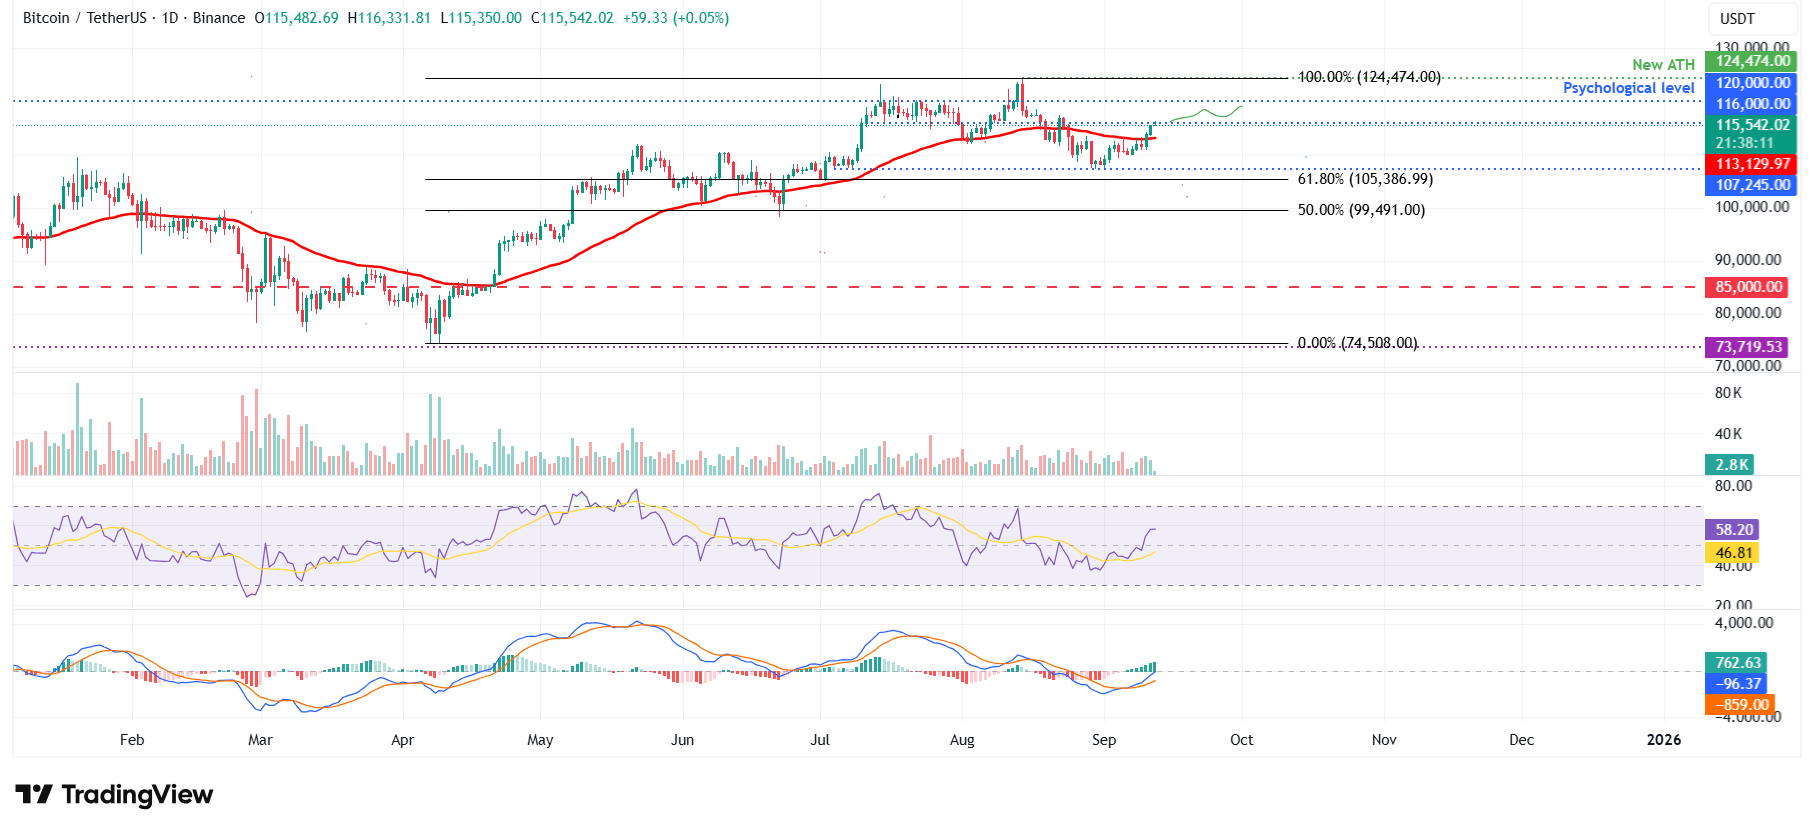
BTC/USDT daily chart
On the contrary, if BTC faces a correction from the daily resistance at $116,000, it could extend the decline toward its 50-day EMA at $113,129.
Ethereum heading toward record high
Ethereum price has been trading sideways between $4,232 and $4,488 for the last 13 days, since August 29. At the time of writing on Friday, it is nearing its upper consolidating boundary at $4,488.
If ETH breaks and closes above the upper boundary at $4,488 on a daily basis, it could extend the rally towards its record high at $4,956.
The RSI on the daily chart reads 58 above its neutral level of 50, showing that bullish momentum is gaining traction. The MACD lines are also about to flip a bullish crossover, further supporting the bullish thesis.
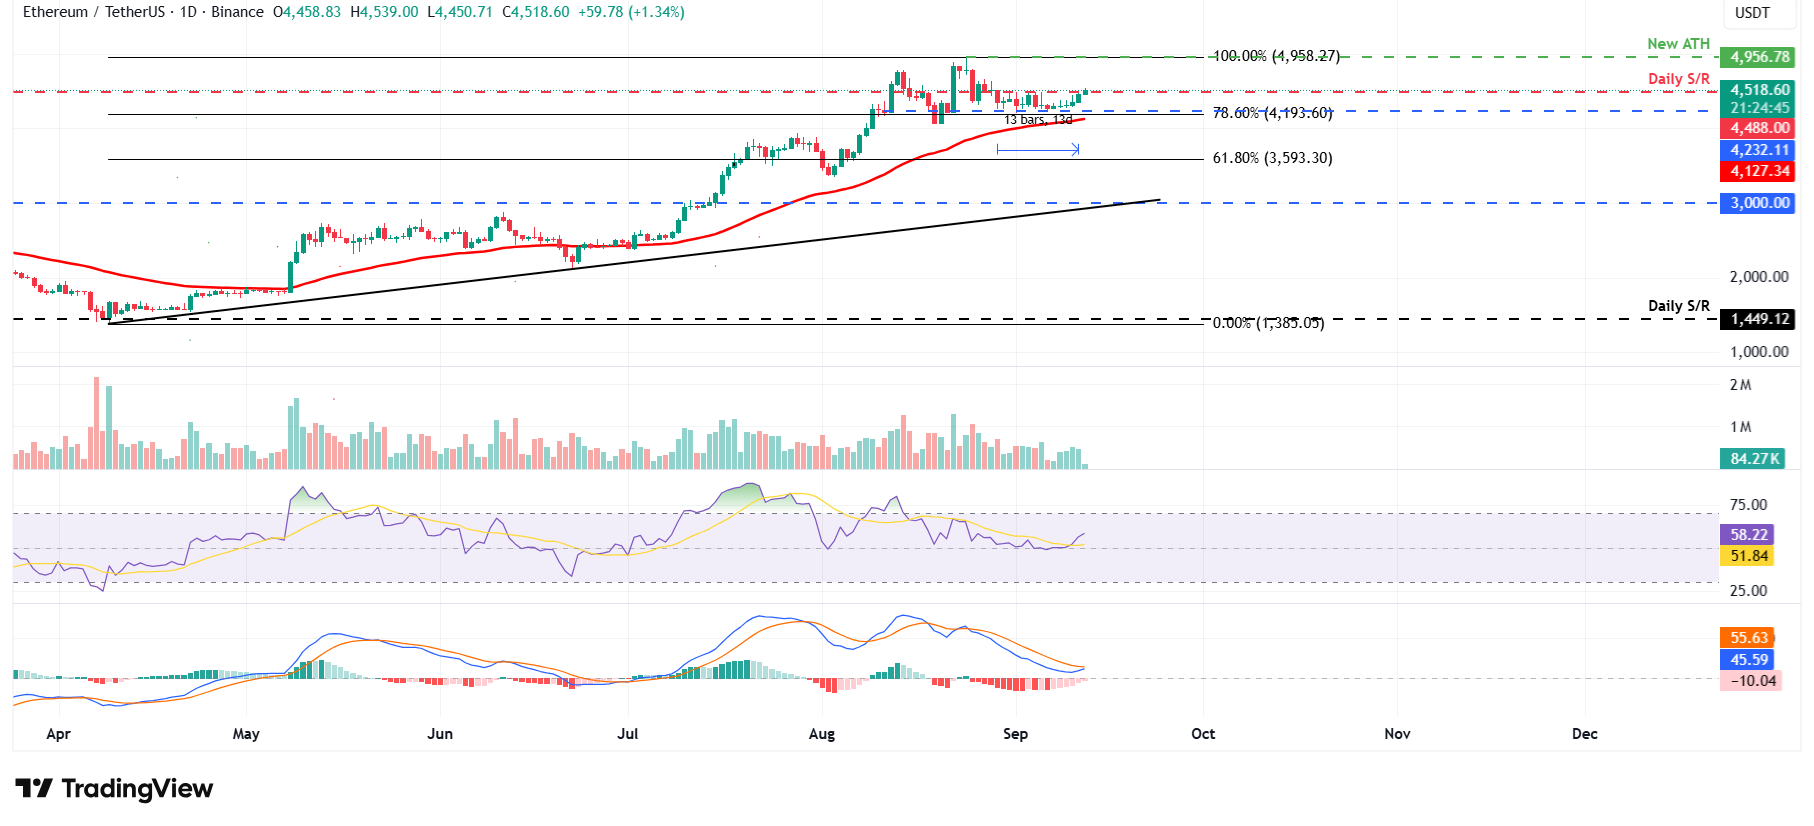
ETH/USDT daily chart
If ETH fails to close above the $4,488 resistance level, it could extend the decline toward the lower boundary at $4,232.
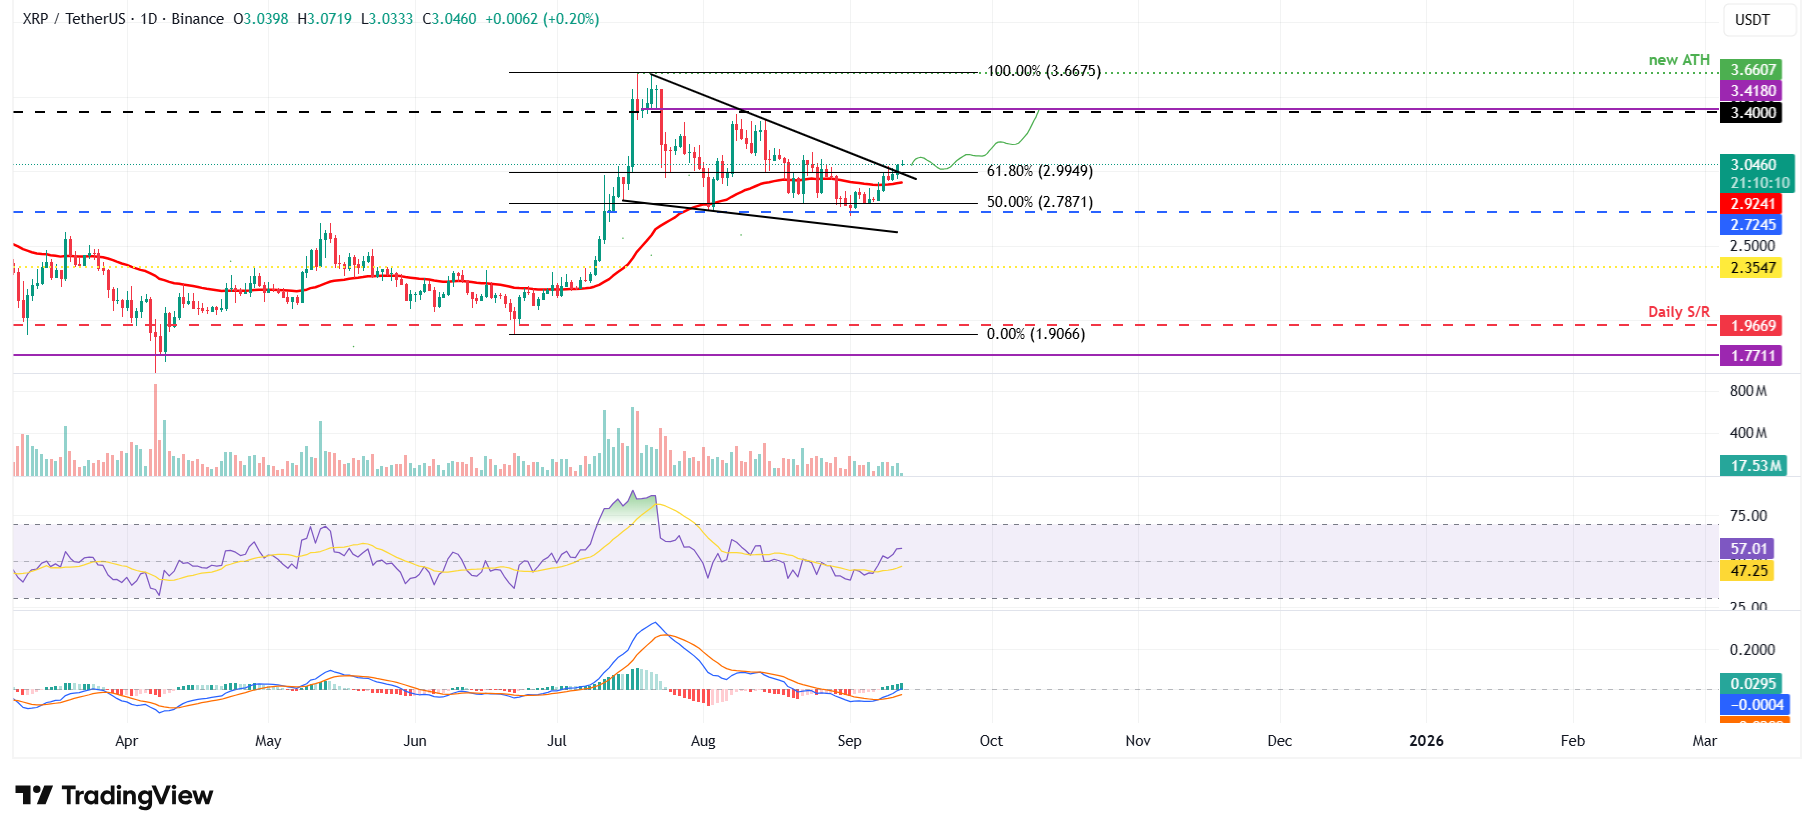
Ripple breaks above the falling wedge pattern
Ripple price broke above the falling wedge pattern (drawn by connecting multiple highs and lows with two trendlines since mid-July) on Thursday; a breakout of this pattern favors the bulls. At the time of writing on Friday, it hovers at around $3.04.
If XRP continues its upward momentum, it could extend the rally toward its daily resistance at $3.40.
Like Bitcoin and Ethereum, XRP’s RSI stands above the neutral level of 50, indicating bullish momentum. Additionally, the MACD showed a bullish crossover on Monday, giving buy signals and indicating improving momentum, which supports the bullish view.
XRP/USDT daily chart
On the other hand, if XRP faces a correction, it could extend the decline toward its 50-day EMA at $2.92.
Cryptocurrency metrics FAQs
What is circulating supply?
The developer or creator of each cryptocurrency decides on the total number of tokens that can be minted or issued. Only a certain number of these assets can be minted by mining, staking or other mechanisms. This is defined by the algorithm of the underlying blockchain technology. On the other hand, circulating supply can also be decreased via actions such as burning tokens, or mistakenly sending assets to addresses of other incompatible blockchains.
What is market capitalization?
Market capitalization is the result of multiplying the circulating supply of a certain asset by the asset’s current market value.
What is trading volume?
Trading volume refers to the total number of tokens for a specific asset that has been transacted or exchanged between buyers and sellers within set trading hours, for example, 24 hours. It is used to gauge market sentiment, this metric combines all volumes on centralized exchanges and decentralized exchanges. Increasing trading volume often denotes the demand for a certain asset as more people are buying and selling the cryptocurrency.
What is the funding rate?
Funding rates are a concept designed to encourage traders to take positions and ensure perpetual contract prices match spot markets. It defines a mechanism by exchanges to ensure that future prices and index prices periodic payments regularly converge. When the funding rate is positive, the price of the perpetual contract is higher than the mark price. This means traders who are bullish and have opened long positions pay traders who are in short positions. On the other hand, a negative funding rate means perpetual prices are below the mark price, and hence traders with short positions pay traders who have opened long positions.
