Hedera Price Forecast: HBAR Bulls Charge Ahead as Critical Support Holds Strong

HBAR defies market turbulence as key support level refuses to break—bulls aren't just optimistic, they're loading up.
Technical Resilience Meets Market Momentum
Hedera's native token showcases textbook defensive action at crucial price floors. That support hold isn't just technical—it's psychological fuel for traders betting on the next leg up. While traditional finance still puzzles over blockchain utility, HBAR's network keeps processing real-world transactions at institutional scale.
The Pattern Every Bull Wants to See
Consolidation near support typically signals one thing: accumulation. Smart money positions while retail hesitates. HBAR's holding pattern mirrors classic pre-breakout behavior seen in assets primed for momentum runs. The network's enterprise adoption continues growing quietly while price action captures attention.
When Fundamentals Back the Charts
Hedera's governance model attracts Fortune 500 players actually building on-chain—not just speculating. Real utility meets technical strength while other projects rely purely on hype and hopeful whitepapers. Of course, Wall Street will probably 'discover' this right after the 100% pump.
Bottom line: Support holds until it doesn't—but for now, bulls control the narrative and the charts. Just remember: in crypto, 'critical support' is always one Elon tweet away from becoming yesterday's memory.
Hedera derivatives flash mixed signals
CoinGlass data shows Hedera’s Open Interest (OI) declined below the $400 million mark to $391.83 million on Tuesday, down from $409.16 million on Monday. The drop in OI relates to increased capital outflow from HBAR derivatives due to increased liquidation.

HBAR Open Interest. Source: Coinglass
Despite the outflow, Optimism among investors is gradually increasing, as the Taker buy jumps to 48.55% from 47.63% on Monday. The long-to-short ratio has increased to 0.9436 during the same time period.
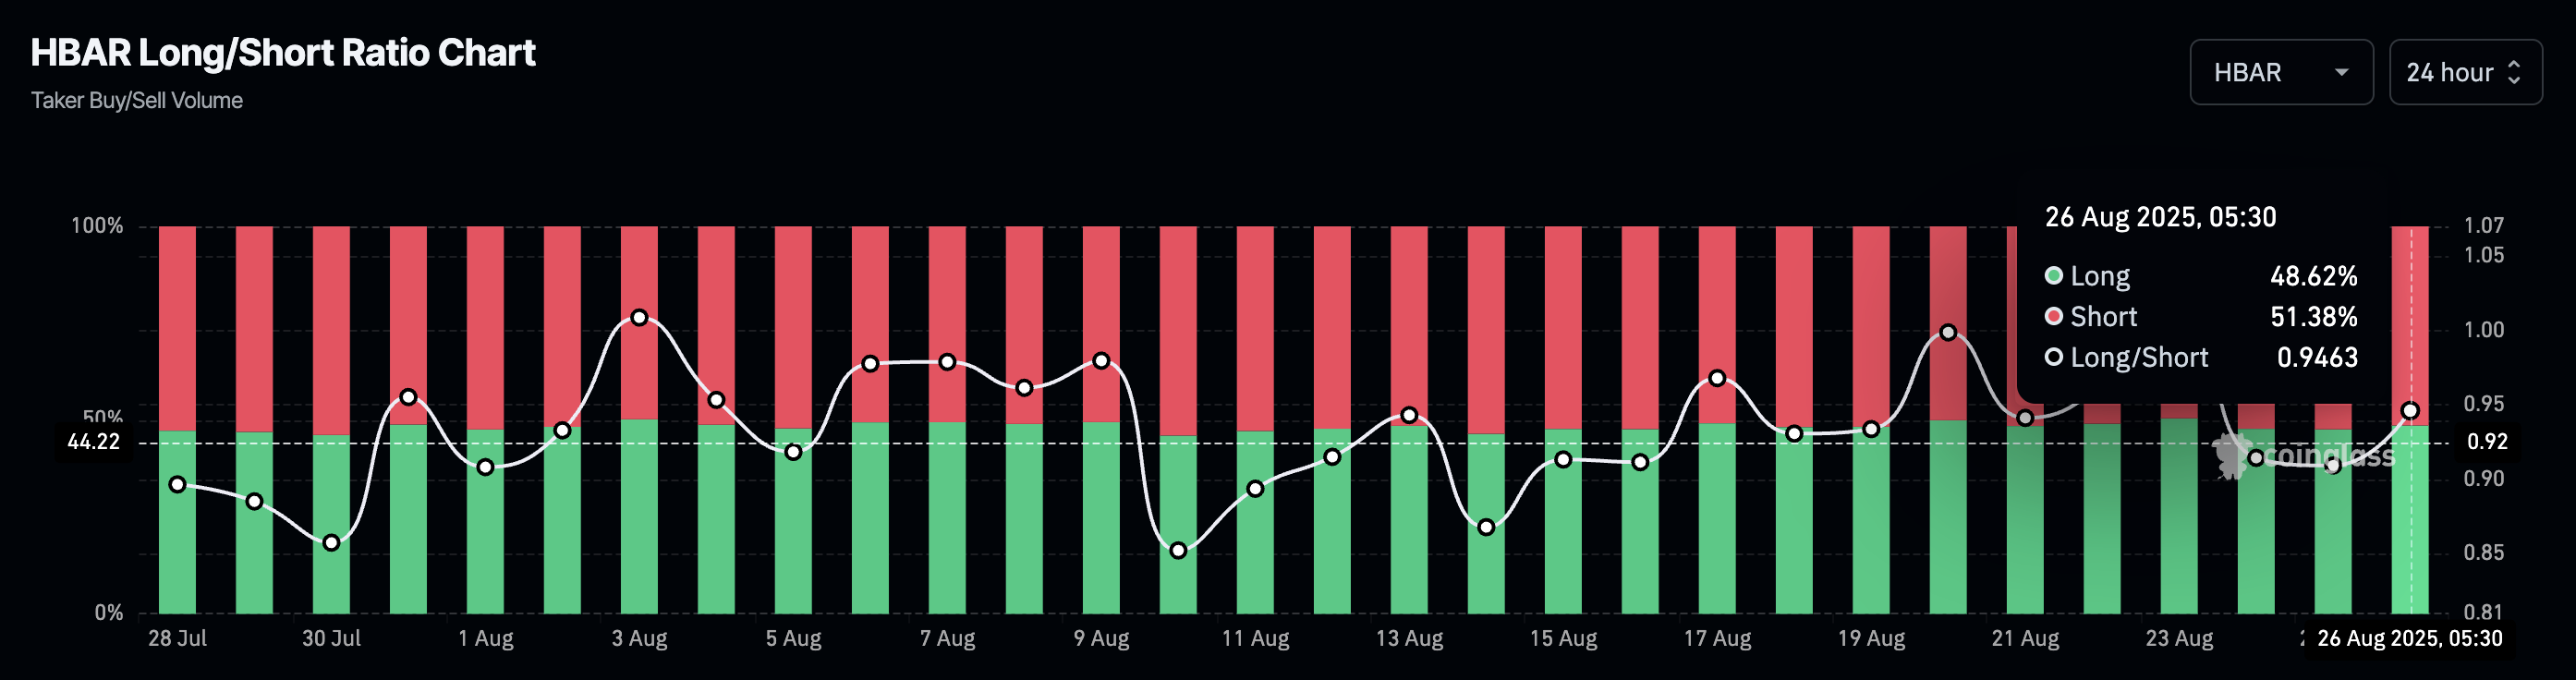
HBAR Long/Short ratio chart. Source: Coinglass
Hedera leaps off from a crucial support
Hedera bounces off the $0.22885 support level by nearly 2% on the day, halting the three-day streak of downfall. The public ledger token eyes to reclaim the 50-day Exponential Moving Average (EMA) at $0.23643, which could reinstate a recovery run.
A potential close above this dynamic average line could target the $0.26606 level, last tested on August 14.
The Moving Average Convergence Divergence (MACD) and its signal line are on the verge of falling below the zero line. This WOULD signal a sell signal with a bearish shift in trend momentum
The Relative Strength Index (RSI) at 45 hovers slightly under the halfway line, maintaining a neutral stance.
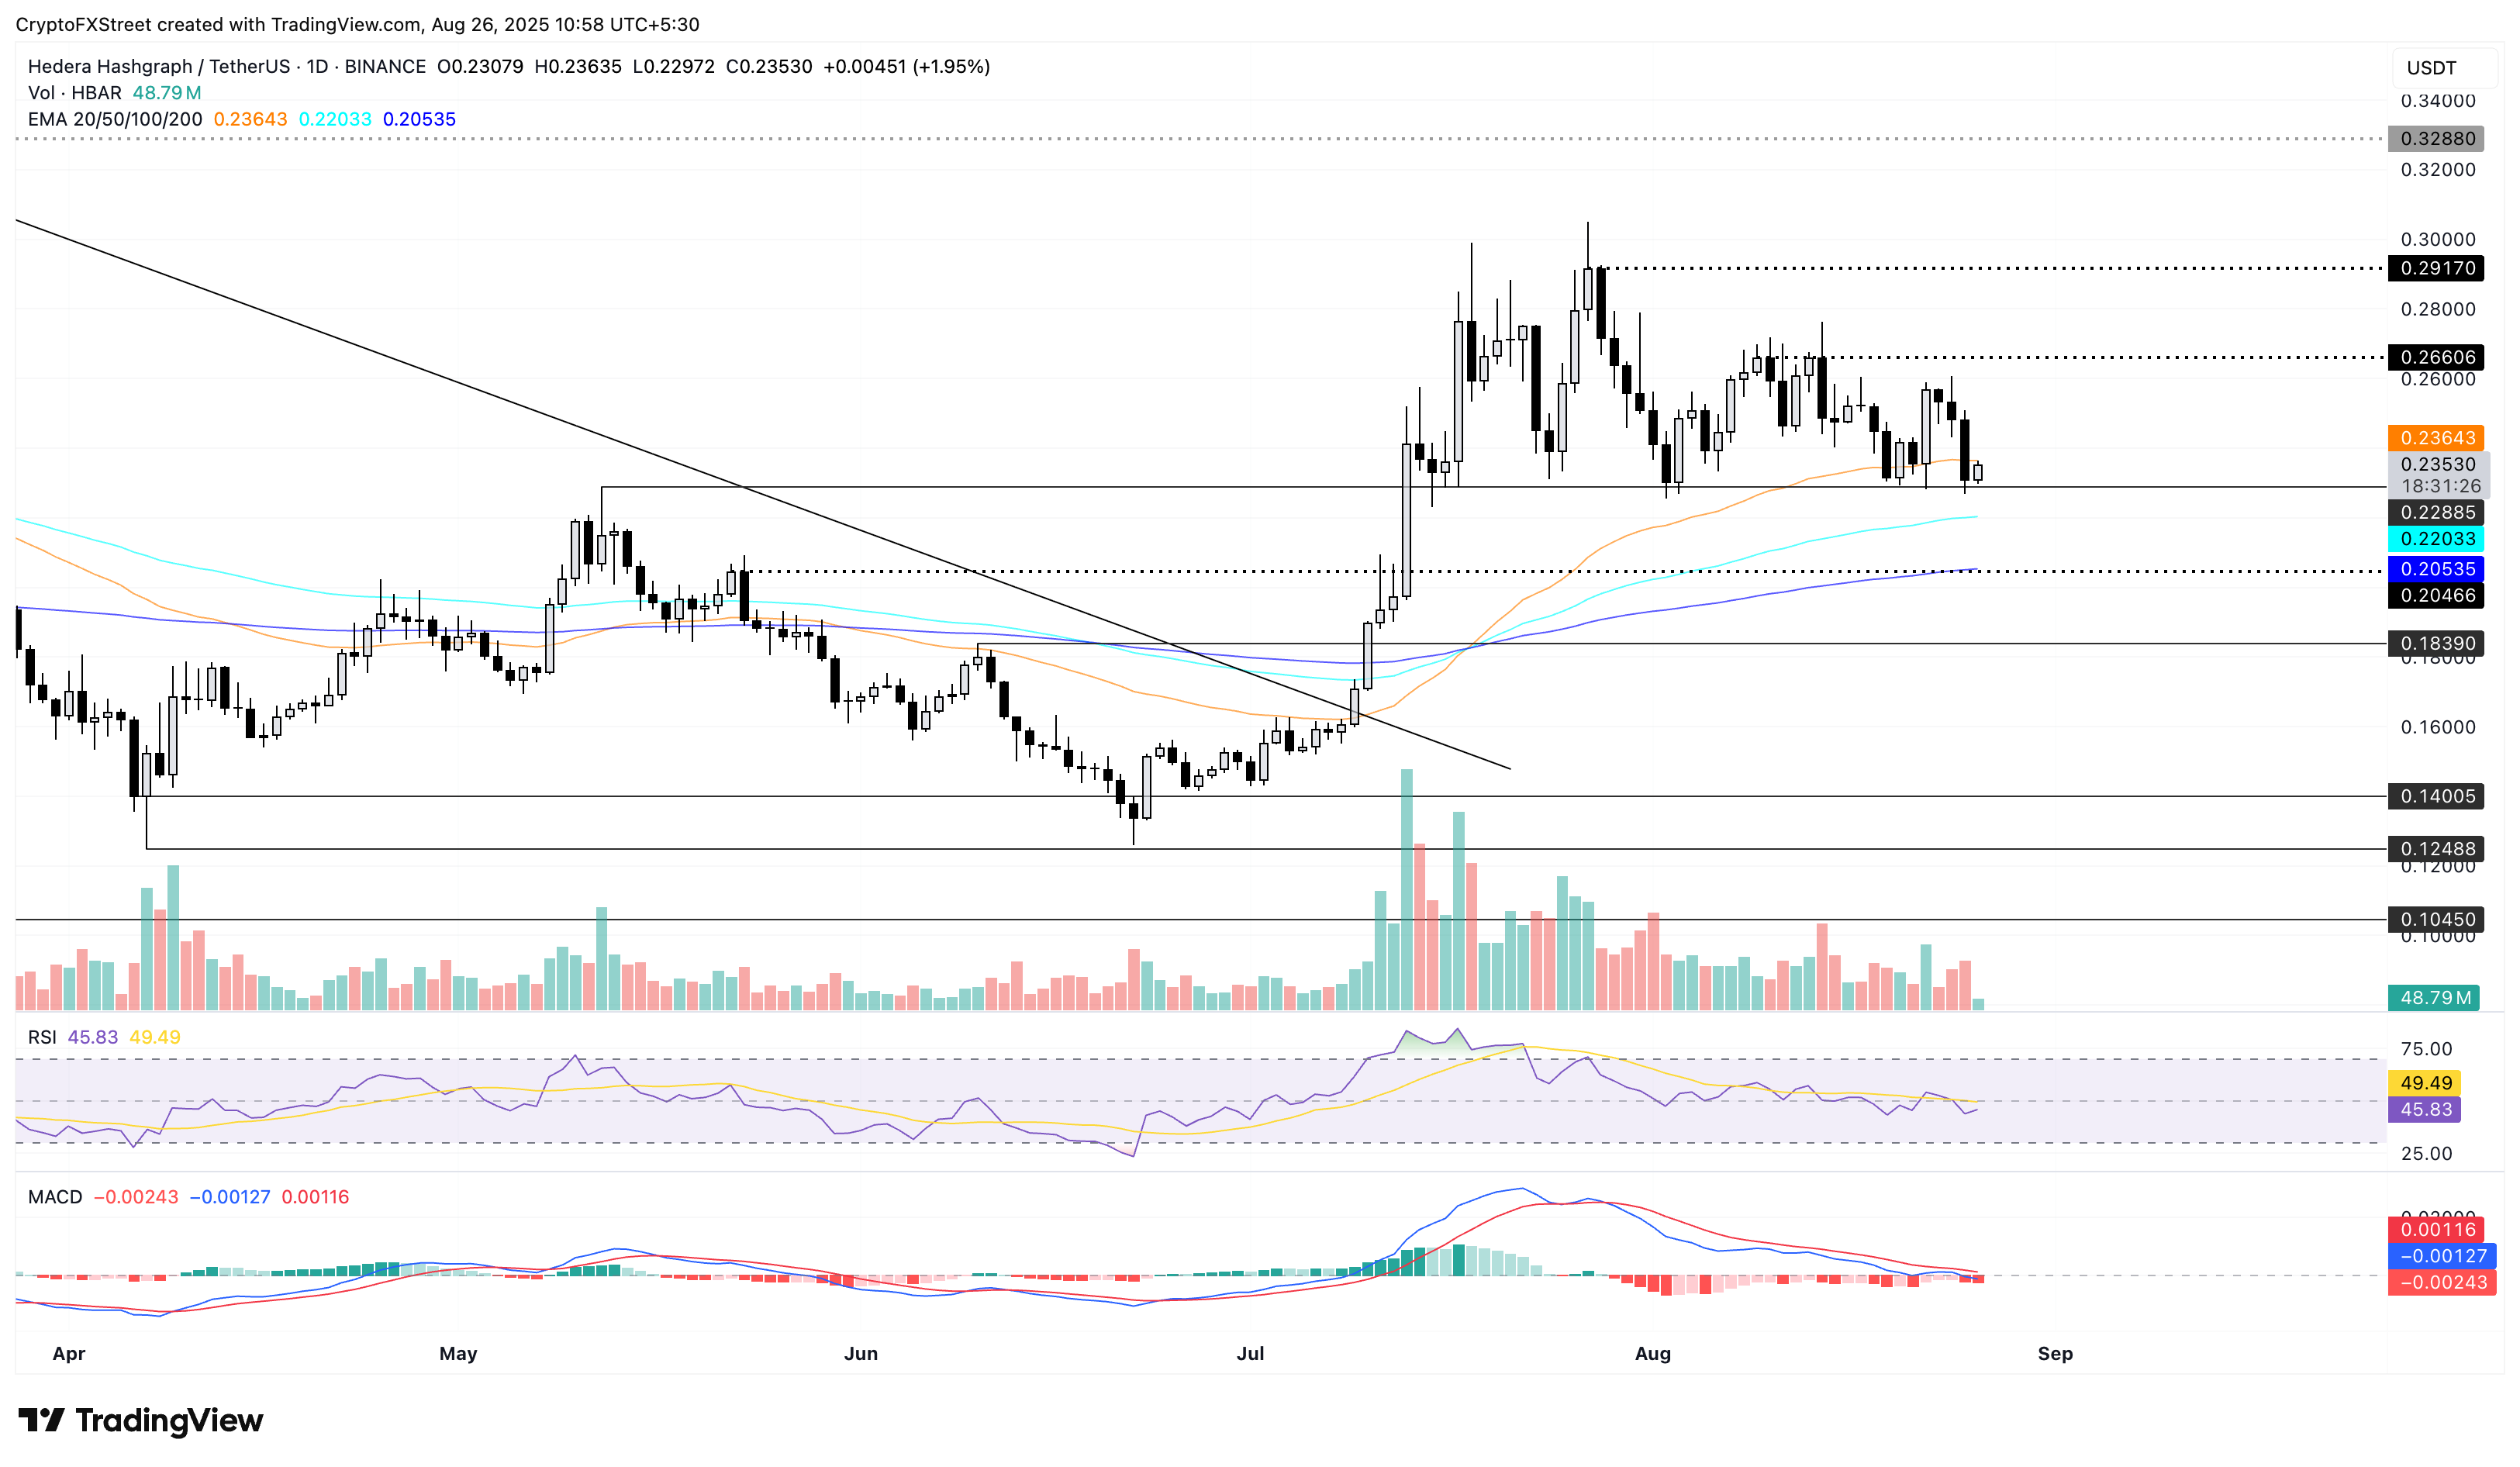
HBAR/USDT daily price chart.
Looking down, if HBAR slips below the $0.22885 level, it could extend the decline to the 100-day EMA at $0.22033.
