Bitcoin, Ethereum, Ripple Price Prediction: Top 3 Cryptos Brace for Powell-Induced Volatility at Jackson Hole
Markets hold their breath as Powell takes the Jackson Hole stage—crypto's big three face the music.
Bitcoin's Make-or-Break Moment
BTC teeters at a critical juncture. Powell's words could either fuel a rally or trigger a selloff. Traders watch every tick, every whisper from the Fed chair. No room for error here.
Ethereum's Nervous Energy
ETH mirrors the tension. Smart contract activity slows as whales hesitate. The merge feels distant when macro winds blow this hard. Institutional players hedge while retail holds on tight.
Ripple's Regulatory Limbo
XRP dances on a knife's edge. Legal uncertainties compound macro pressures. One speech could amplify its struggles or offer unexpected relief. Traders gamble on both outcomes.
Jackson Hole becomes crypto's unofficial referendum on central bank credibility. Powell speaks, markets react—same old story, just with fancier technology and more volatile assets. Because nothing says 'sound monetary policy' like hanging on every word of a bureaucrat in Wyoming.
Bitcoin consolidates above its key support at $111,980
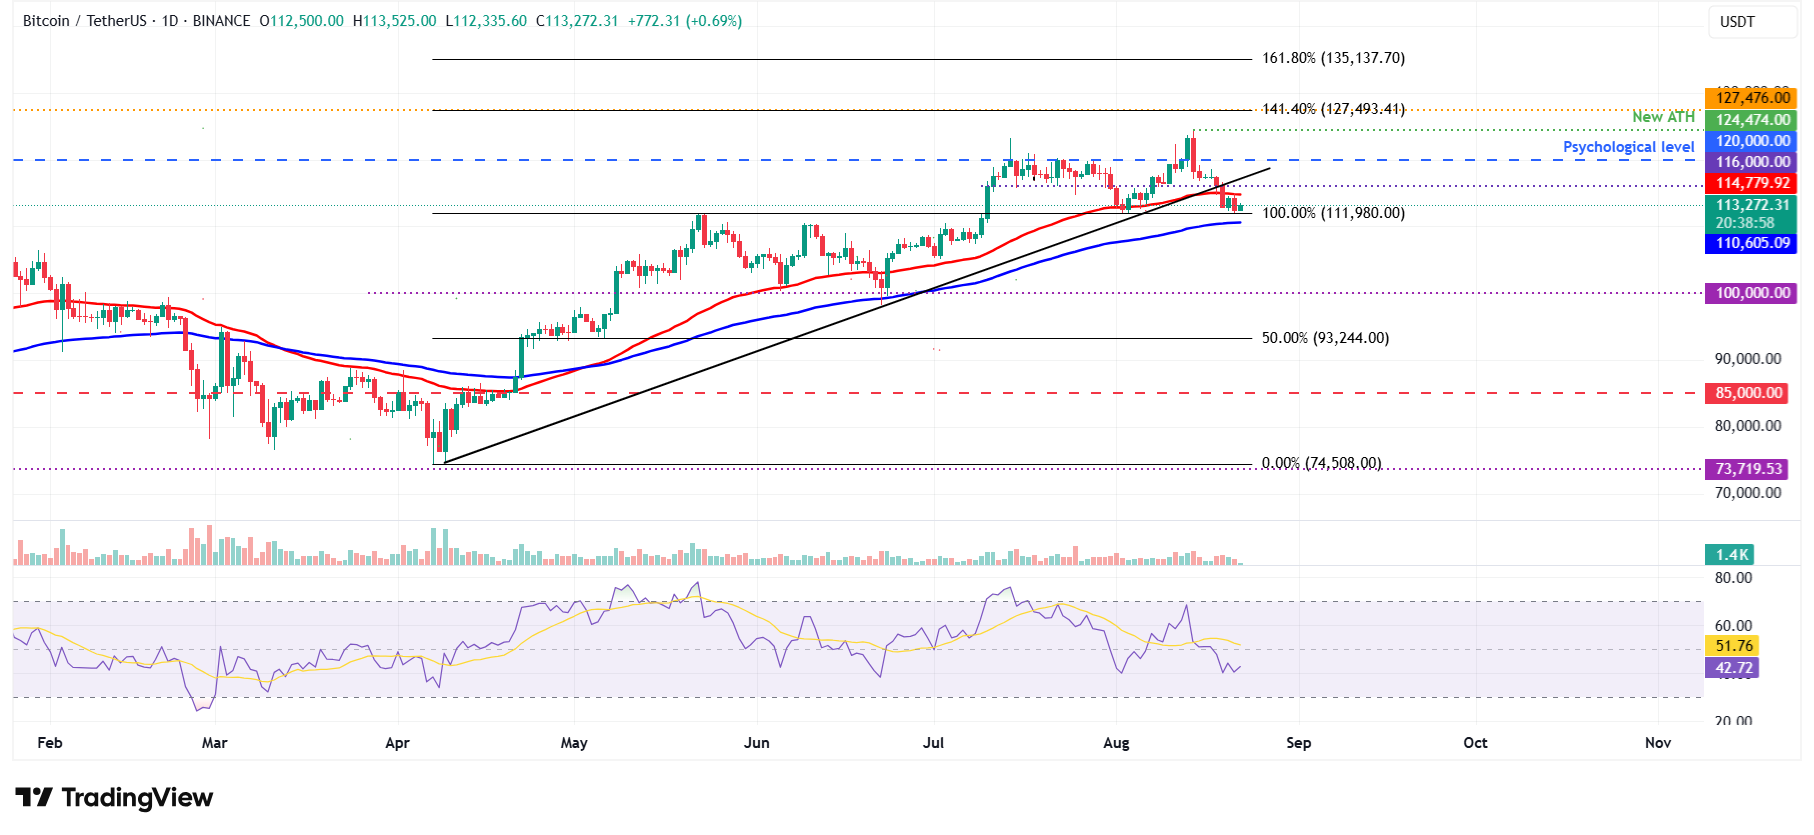
BTC price has fallen over 8% from its record of $124,747 on August 14, closing below an ascending trendline drawn by connecting multiple lows since early April this week, and retested its support level at $111,980 on Thursday. At the time of writing on Friday, it hovers at around $113,432.
If the support at $111,980 holds and BTC recovers and closes above its 50-day EMA at $114,786, it could extend the recovery toward its next daily resistance at $116,000.
However, the Relative Strength Index (RSI) reads 43 below its neutral value of 50, suggesting bearish momentum. For the recovery rally to be sustained, the RSI must MOVE above its neutral value.

BTC/USDT daily chart
However, if BTC continues its correction and closes below $111,980 support, it could extend the decline toward its 100-day EMA at $110,605.
Ethereum shows some signs of resilience
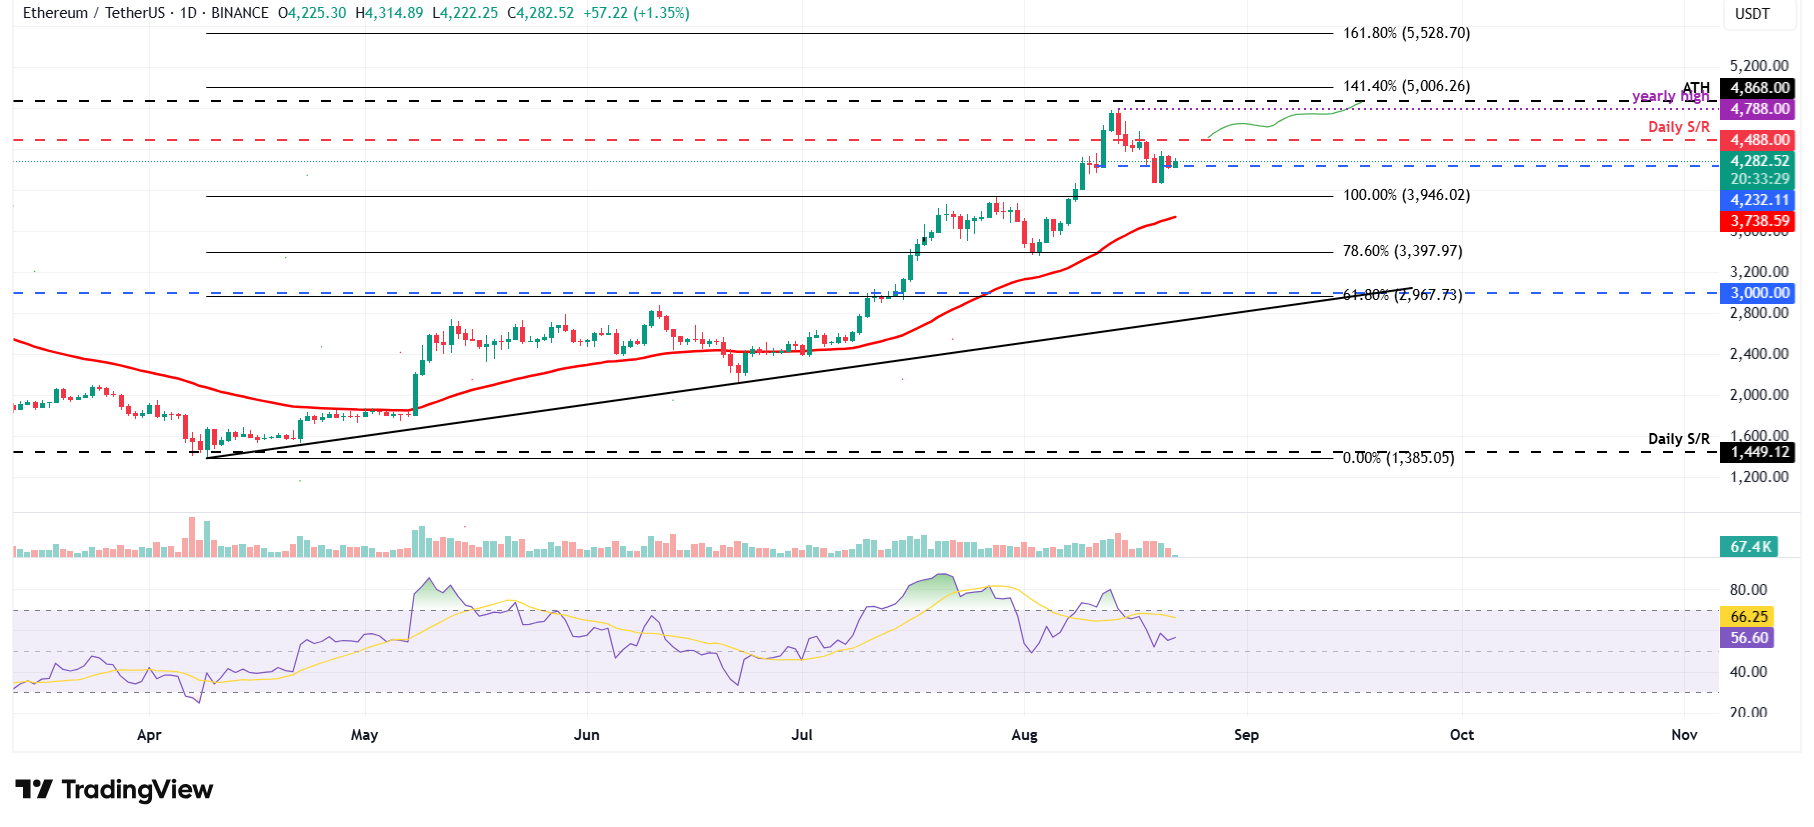
Ethereum price reached a new yearly high of $4,788 last week on August 14, but failed to continue its upward trend and declined by over 14% in the next five days until Tuesday. However, ETH recovered 6.39% the next day and found support around the daily level of $4,232 on Thursday. At the time of writing on Friday, it trades slightly above at $4,282.
If the daily level at $4,232 continues to hold as support, ETH could extend the recovery toward its next daily resistance at $4,488. A successful close above this level could extend the rally toward its yearly high at $4,788.
The RSI on the daily chart reads 56, rebounding from its neutral level of 50 on Tuesday and points upward, suggesting bullish momentum is gaining traction.

ETH/USDT daily chart
However, if ETH faces a correction and closes below its daily support at $4,232, it could extend the decline toward its next support level at $3,946.
XRP faces rejection from the 50-day EMA
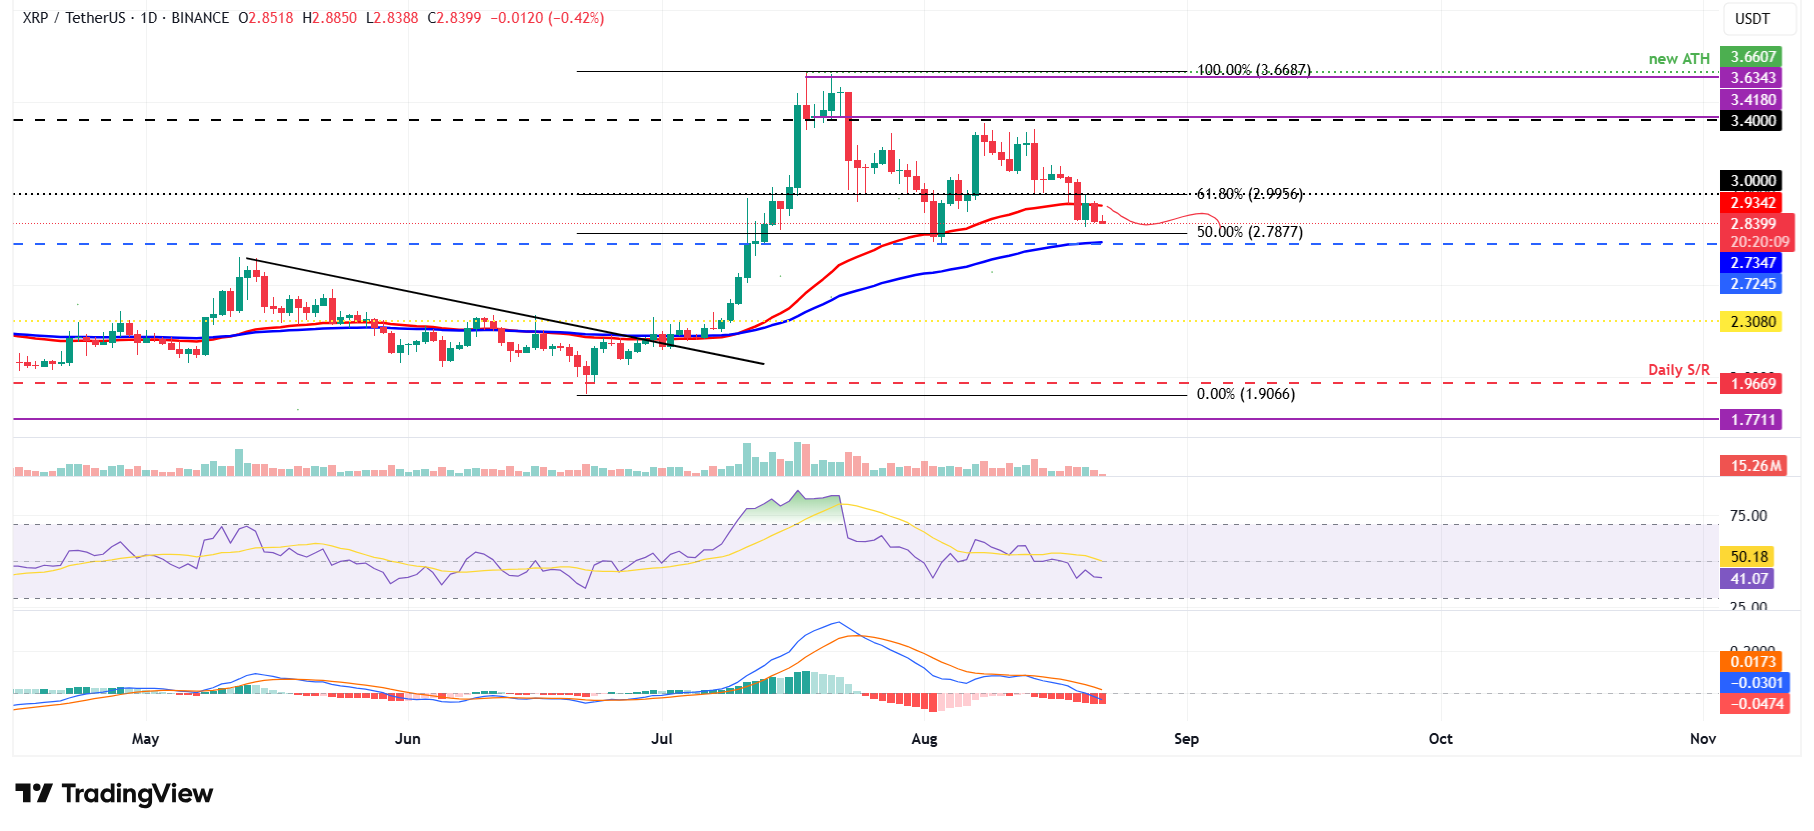
XRP price faced rejection around the daily level of $3.40 on August 14 and declined over 12% in the next five days, closing below the 50-day EMA at $2.93 on Tuesday. XRP recovered slightly on Wednesday, but faced a rejection from its 50-day EMA the next day. At the time of writing on Friday, it continues to trade down at $2.83.
If the 50-day EMA at $2.93 continues to hold as resistance, xrp price could extend the decline to retest its key support at $2.72.
The RSI on the daily chart reads 41 below the neutral level of 50, pointing downward, indicating strong bearish momentum. The Moving Average Convergence Divergence (MACD) showed bearish crossover and rising red histogram bars, supporting the bearish thesis.

XRP/USDT daily chart
Conversely, if XRP recovers and closes above its 50-day EMA at $2.93, it could extend the recovery toward its daily resistance at $2.99.
Cryptocurrency metrics FAQs
What is circulating supply?
The developer or creator of each cryptocurrency decides on the total number of tokens that can be minted or issued. Only a certain number of these assets can be minted by mining, staking or other mechanisms. This is defined by the algorithm of the underlying blockchain technology. On the other hand, circulating supply can also be decreased via actions such as burning tokens, or mistakenly sending assets to addresses of other incompatible blockchains.
What is market capitalization?
Market capitalization is the result of multiplying the circulating supply of a certain asset by the asset’s current market value.
What is trading volume?
Trading volume refers to the total number of tokens for a specific asset that has been transacted or exchanged between buyers and sellers within set trading hours, for example, 24 hours. It is used to gauge market sentiment, this metric combines all volumes on centralized exchanges and decentralized exchanges. Increasing trading volume often denotes the demand for a certain asset as more people are buying and selling the cryptocurrency.
What is the funding rate?
Funding rates are a concept designed to encourage traders to take positions and ensure perpetual contract prices match spot markets. It defines a mechanism by exchanges to ensure that future prices and index prices periodic payments regularly converge. When the funding rate is positive, the price of the perpetual contract is higher than the mark price. This means traders who are bullish and have opened long positions pay traders who are in short positions. On the other hand, a negative funding rate means perpetual prices are below the mark price, and hence traders with short positions pay traders who have opened long positions.

