🚨 Crypto Bloodbath: FARTCOIN, VIRTUAL, TIA Plunge 10%+ as $1B Gets Liquidated
Crypto markets got steamrolled today—no coin was safe. Here’s the wreckage.
### The Casualties
FARTCOIN, VIRTUAL, and TIA led the nosedive with double-digit losses, leaving traders scrambling. A cool $1B evaporated from leveraged positions—proof the market still loves a good old-fashioned margin call.
### Why It Hurts
Liquidation cascades hit like a sledgehammer. Bulls got caught with their hands in the cookie jar—again. ‘Buy the dip’ chants turned to ‘sell the rip’ real quick.
### The Silver Lining?
Volatility is a trader’s playground. And let’s be real—Wall Street wastes more on coffee breaks than this ‘crash’ wiped out. Crypto winter? More like a brisk breeze.
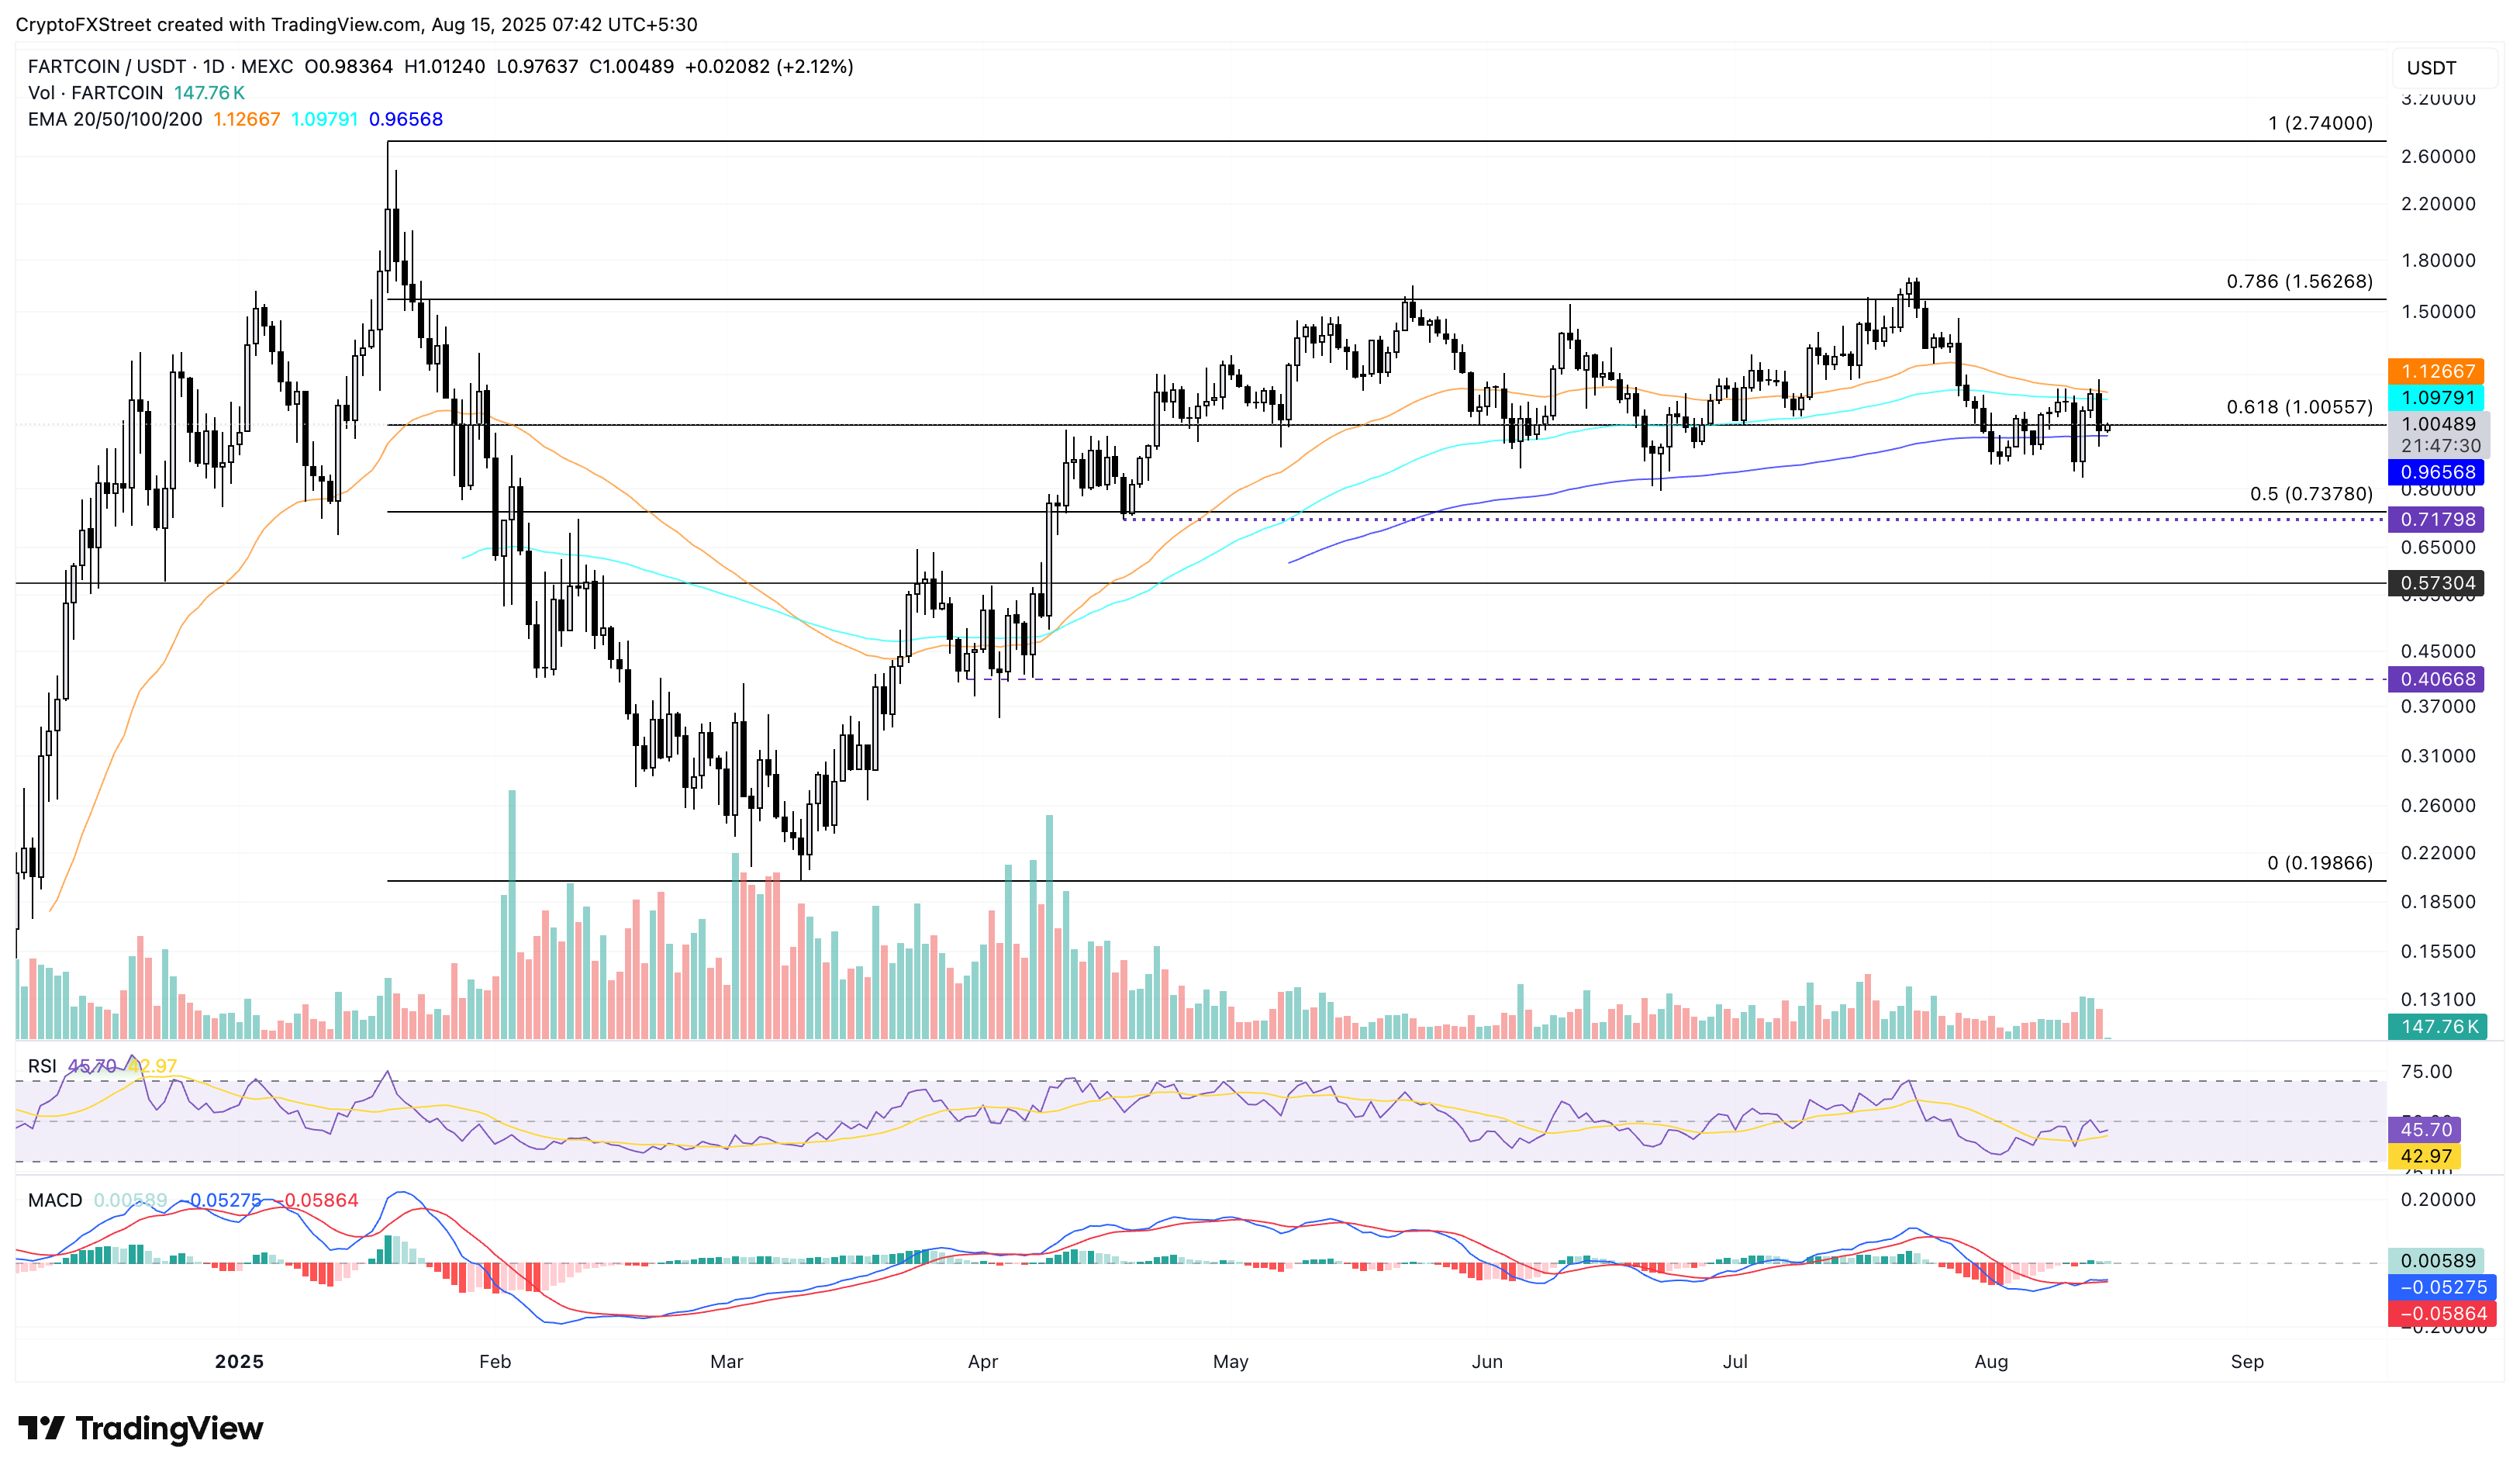
FARTCOIN holds above the 200-day EMA as downside risk looms
Fartcoin edges higher by 2% at press time on Friday after a 12.36% loss on the previous day. The Solana-based meme coin holds above the 200-day Exponential Moving Average (EMA) at $0.9656, struggling to crawl above the 61.8% Fibonacci level at $1.0055, which is drawn from the $2.7400 peak on January 19 to the $0.1986 on March 10.
A decisive close above this could reignite recovery in the Fartcoin, potentially testing the 50-day EMA at $1.1266. The declining average line risks a death cross with the 100-day EMA, which WOULD signal a short-term trend more bearish than the longer-term trend.
The Moving Average Convergence Divergence (MACD) indicator remains mixed as the average lines flatline converge. Still, the Relative Strength Index (RSI) at 45 holds close to neutral levels, pointing upwards to the halfway line.

FARTCOIN/USDT daily price chart.
Looking down, if the meme coin drops below the 200-day EMA at $0.9656, it could extend the decline to the 50% retracement level at $0.7378.
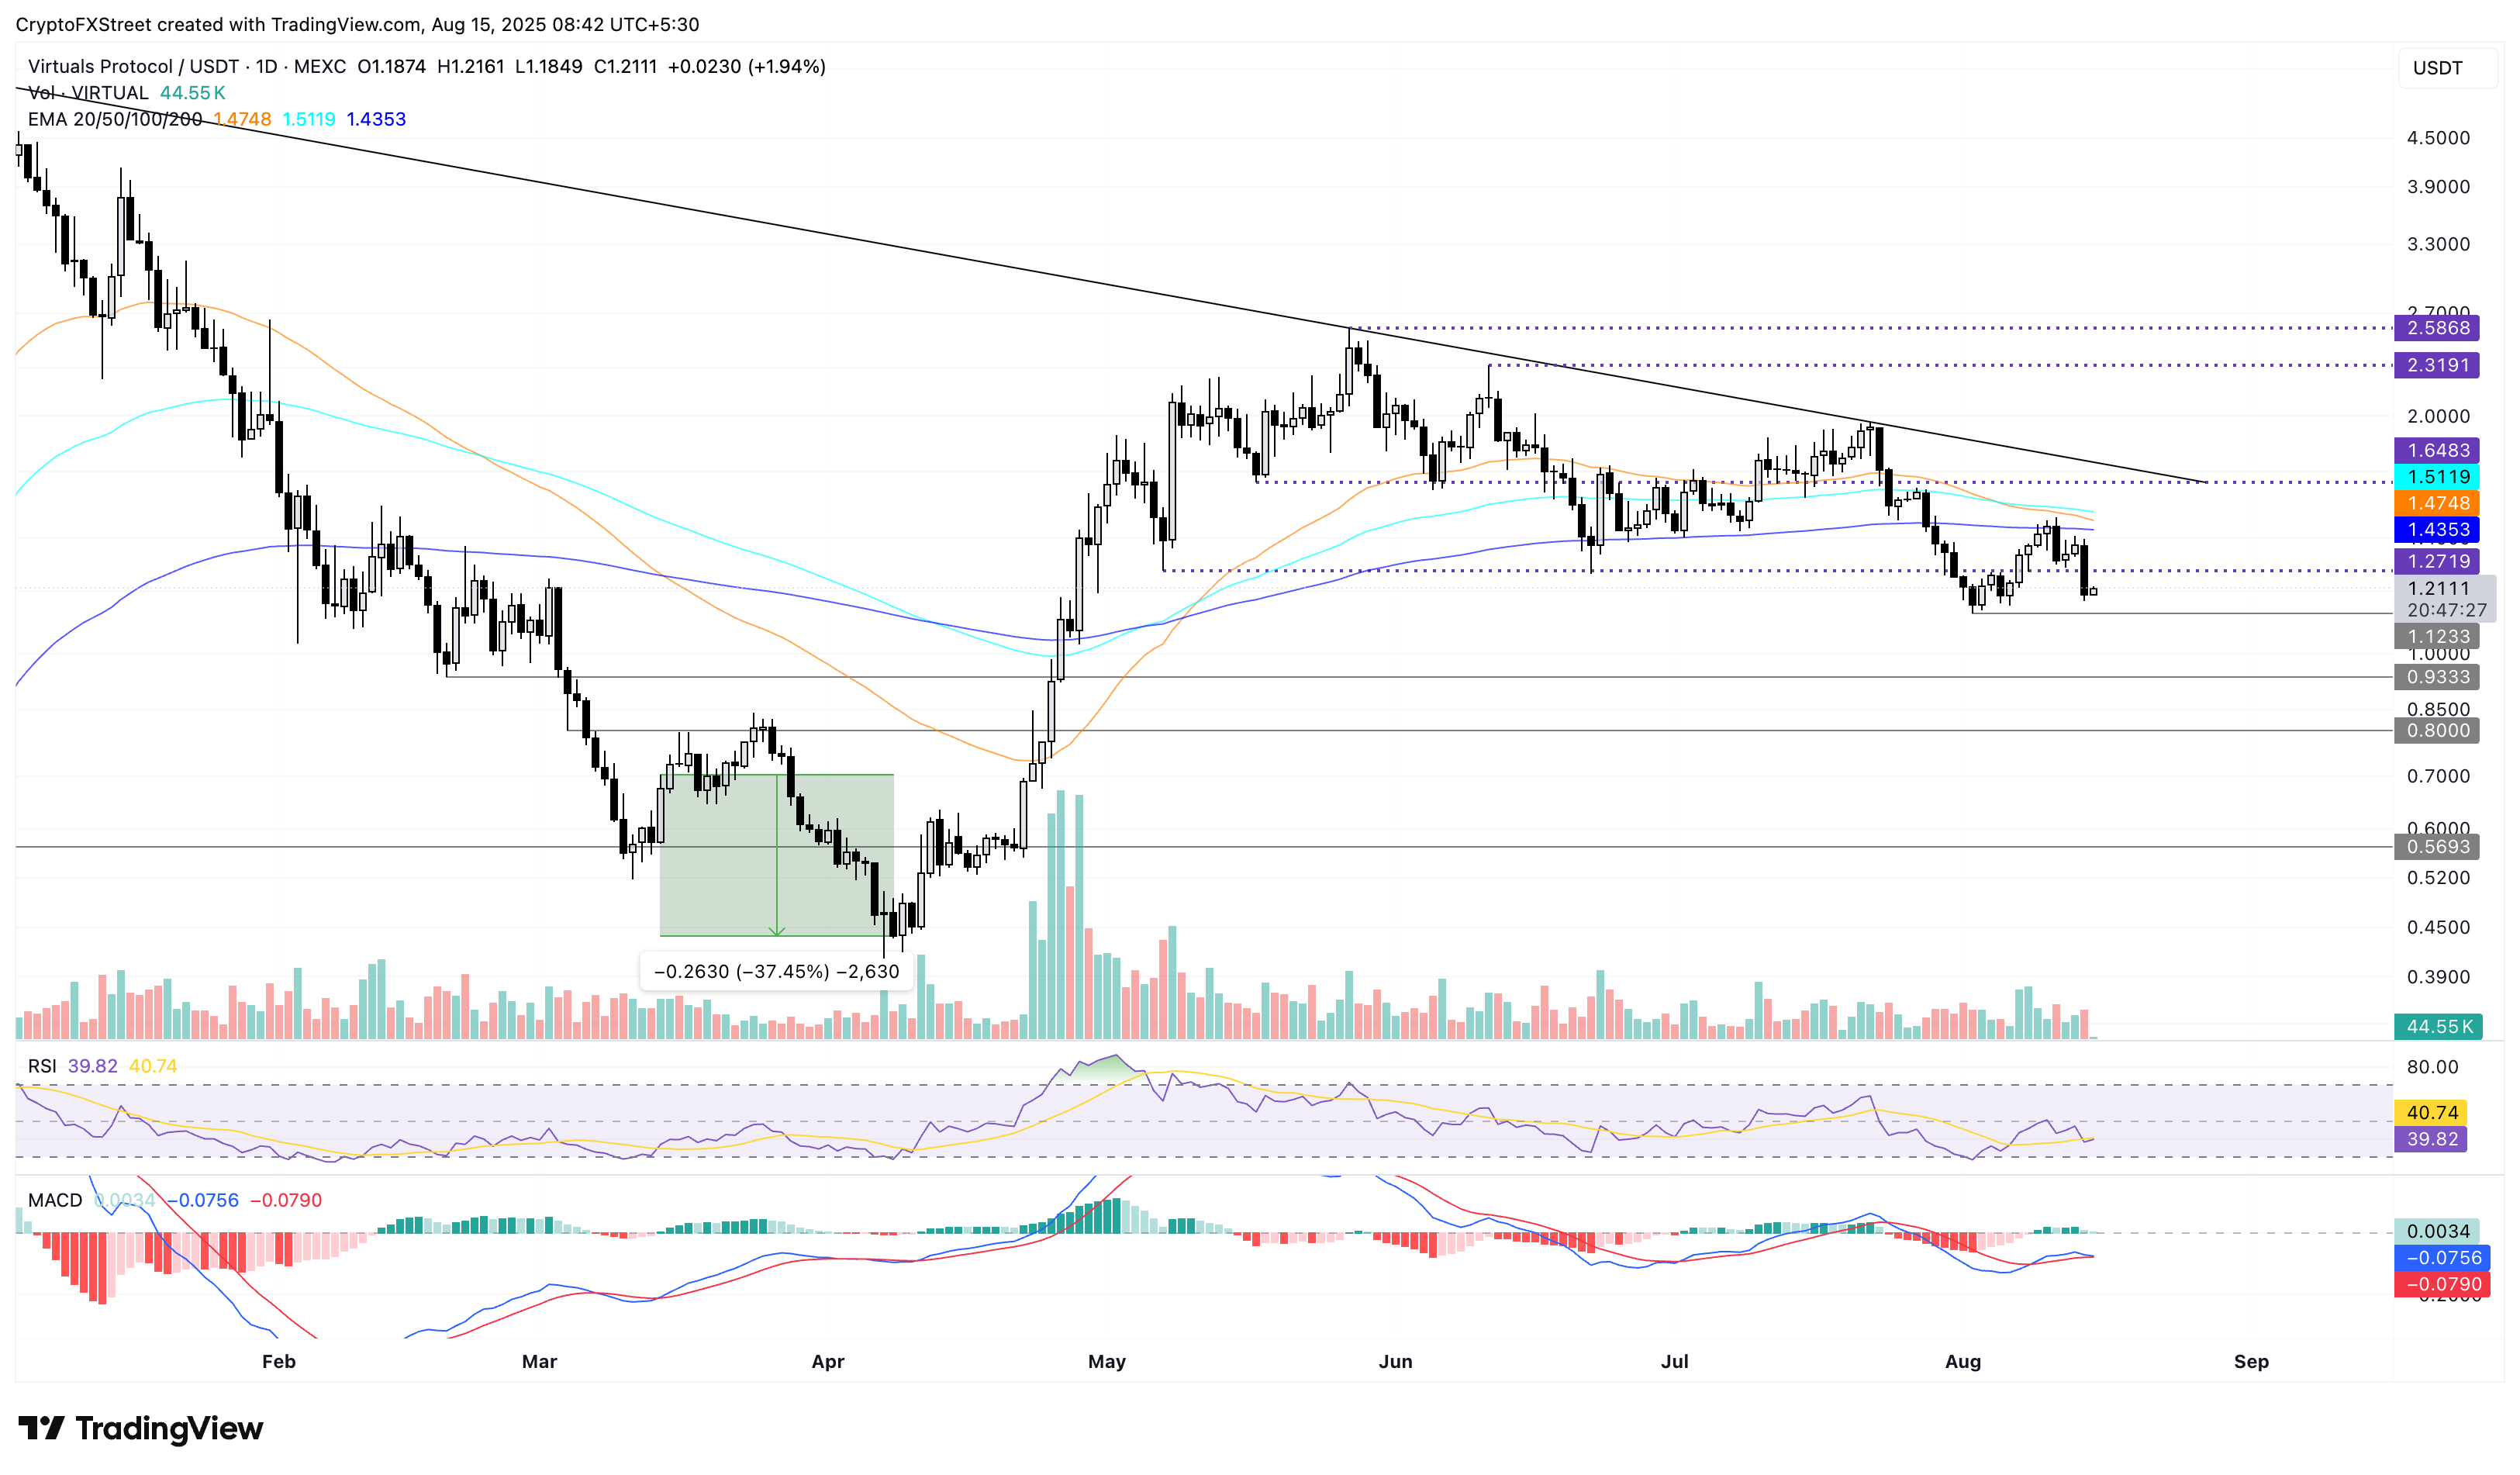
VIRTUAL risks further losses amid death cross chances
Virtuals Protocol remains under the 200-day EMA as it dropped over 13% on Thursday. VIRTUAL recovers by 2% at the time of writing on Friday as the declining 50- and 200-day EMA risk a death cross, flashing a sell signal which led to a near 40% crash last time in March.
The path of least resistance suggests a retest of the $1.12 support, and a decisive close below this level could extend the decline to the $1.00 psychological level.
The momentum indicators hold a bearish bias as the RSI drops to 39, inching closer to the oversold area. Additionally, the MACD is on the verge of crossing below its signal line, a sell signal as bearish momentum revives.

VIRTUAL/USDT daily price chart.
Looking up, VIRTUAL should reclaim the 200-day EMA at $1.45 to reinforce an uptrend.
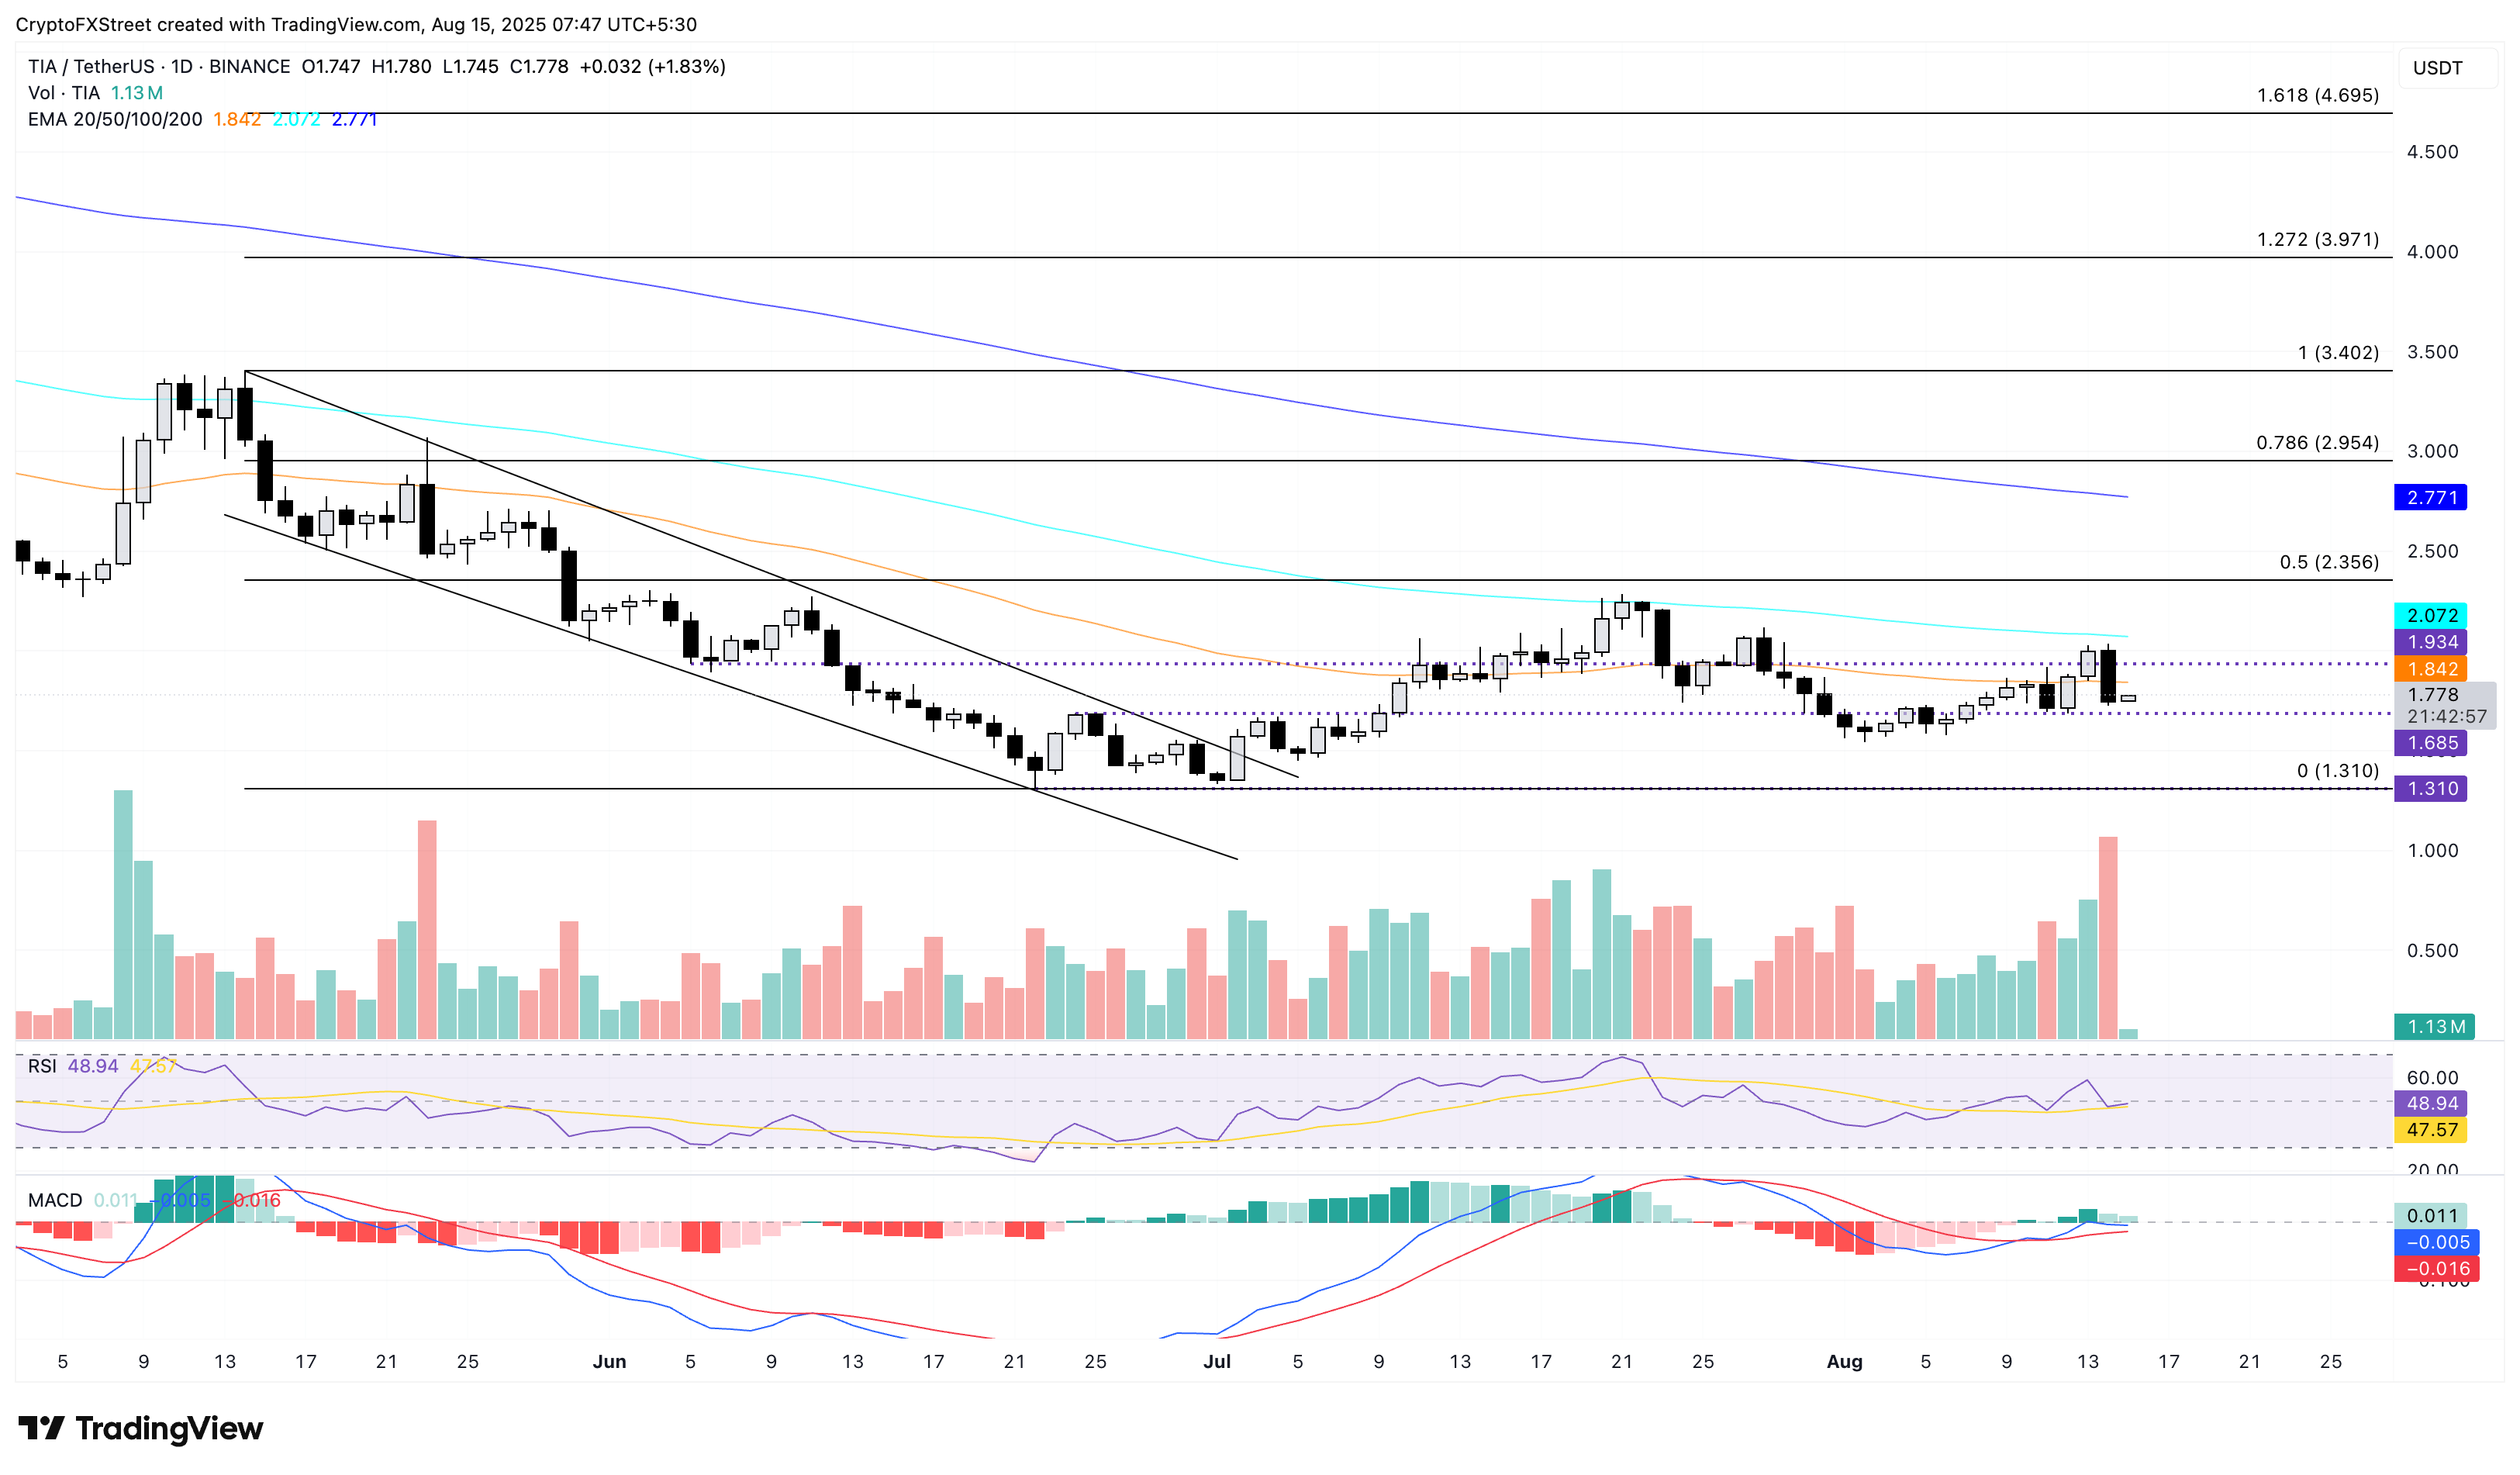
TIA could test the $1.310 support floor
Celestia appreciated by nearly 2% at press time on Friday, following the NEAR 13% loss from the previous day, which formed a bearish engulfing candle. Despite the sell-off, TIA holds its ground above the $1.685 support level marked by the June 24 high.
A clean push below this level could extend the decline to the $1.310 support floor marked by the low of June 22.
The MACD and its signal line MOVE close to each other, increasing the risk of a crossover, which would trigger a sell signal. Still, the RSI at 48 remains steady at neutral grounds, keeping the reversal cards on the table.

TIA/USDT daily price chart.
On the upside, TIA should surpass the bearish engulfing candle with a decisive close above the 100-day EMA at $2.072. If so, the uptrend could extend to the 50% retracement level at $2.356.

