Monero Plummets to Two-Month Low: Is the Privacy Coin’s Rally Over?
Monero—the OG privacy coin—just nosedived to its lowest price since June. No fluffy explanations, no sugarcoating: XMR holders are sweating.
What's bleeding Monero?
Regulatory wolves are circling privacy coins, exchanges are delisting faster than you can say 'KYC,' and let's be real—most crypto traders care more about memecoins than actual financial anonymity. Meanwhile, institutional investors are too busy chasing AI tokens to notice.
But here's the kicker: Monero's tech hasn't changed. The cryptography still works. The devs haven't quit. This might just be another fear-driven dip before the next privacy renaissance—or a slow fade into irrelevance. Your move, darknet nostalgics.
Monero’s risk of further downside grows as short interest spikes
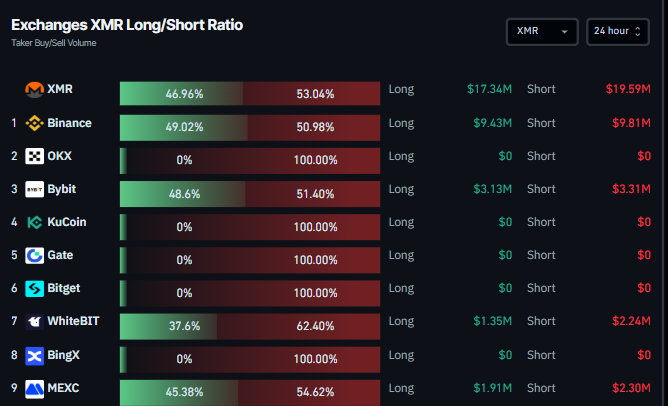
CoinGlass data indicates that Monero’s long-to-short ratio at all exchanges shows 53.04% of traders are betting on the asset price to fall.

Exchange XMR long-to-short ratio chart. Source: Coinglass
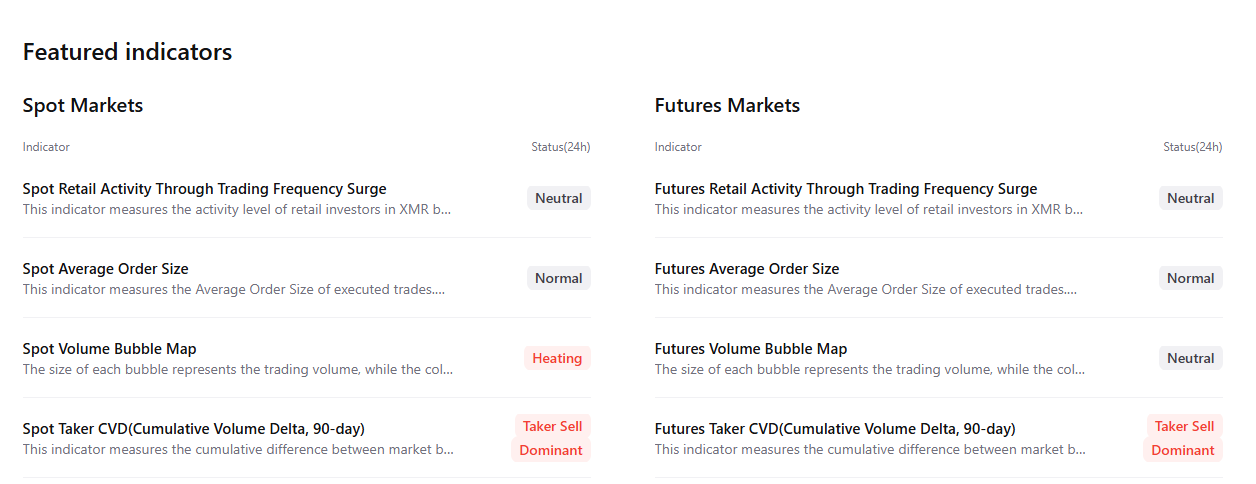
CryptoQuant’s summary data also indicates that Monero’s futures market activity is heating up as more traders are opening Leveraged positions alongside negative Spot Taker CVD, signaling a potential correction ahead.

Monero Price Forecast: XMR bears aiming for $241 mark
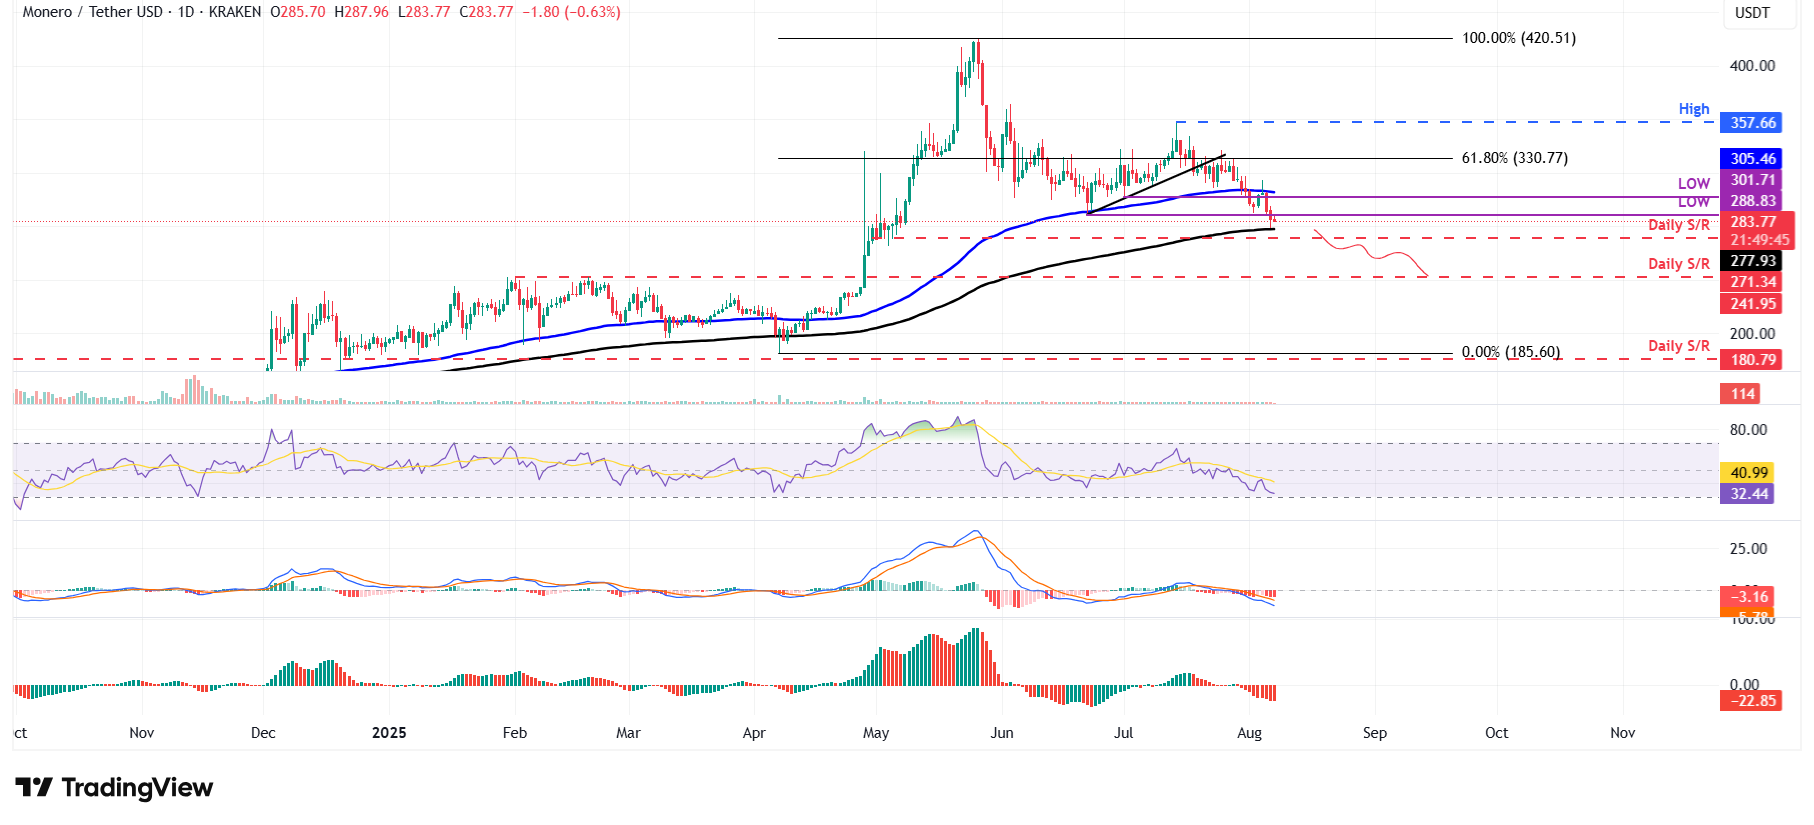
Monero price faced rejection from its previously broken ascending trendline (drawn by connecting multiple lows since mid-June) on July 25 and declined more than 12% in the next 13 days to reach the lowest level since May 7. At the time of writing on Thursday, it continues to trade below $284.
If XMR continues its downward trend and closes below its 200-day Exponential Moving Average (EMA) at $277.93, it could extend the correction to retest its daily support at $241.95.
The Relative Strength Index (RSI) indicator and Awesome Oscillator (AO) on the daily chart are trading below the neutral levels of 50 and zero, respectively. These momentum indicators strongly indicate bearish dominance. The Moving Average Convergence Divergence (MACD) showed a bearish crossover on July 20 that still holds, also indicating bearish momentum.

XMR/USDT daily chart
However, if XMR recovers, it could extend the recovery toward its 100-day EMA at $305.46.

