Bitcoin, Ethereum, Ripple Price Prediction: BTC, ETH, XRP Hit Resistance – What’s Next for Crypto in 2025?

Crypto bulls hit a wall as Bitcoin, Ethereum, and Ripple stall at key resistance levels. Is this a temporary setback or a sign of deeper fatigue in the market?
BTC: The King Stumbles
Bitcoin’s latest rally slammed into a brick wall—again. Traders are left wondering if this is just another shakeout or the start of a deeper correction.
ETH: Smart Money Gets Smarter
Ethereum’s gas fees might be down, but so is its momentum. The network’s upgrades haven’t stopped ETH from tripping over the same old resistance.
XRP: The Eternal Underdog
Ripple’s legal wins haven’t translated into price wins. XRP keeps flirting with breakout territory—only to retreat like a hedge fund manager at a crypto conference.
Meanwhile, Wall Street still can’t decide if crypto is the future or a glorified Ponzi scheme. Some things never change.
Bitcoin faces rejection from its $116,000 resistance
Bitcoin price found support around its 50-day Exponential Moving Average (EMA) at $113,058 on Sunday and recovered slightly until the next day, nearing its lower consolidation at $116,000. However, on Tuesday, it faced a mild correction around the $116,000 resistance. At the time of writing on Wednesday, it continues to trade below $114,000.
If the 50-day EMA at $113,058 fails to hold as support, BTC closes below the previous all-time high of $111,980 on a daily basis. Then, it could extend the decline to retest its key psychological support at $110,000.
The Relative Strength Index (RSI) on the daily chart reads 44, after facing rejection from its neutral level of 50, indicating bearish momentum is gaining traction. The Moving Average Convergence Divergence (MACD) showed a bearish crossover on July 23 that still holds, indicating bearish momentum.
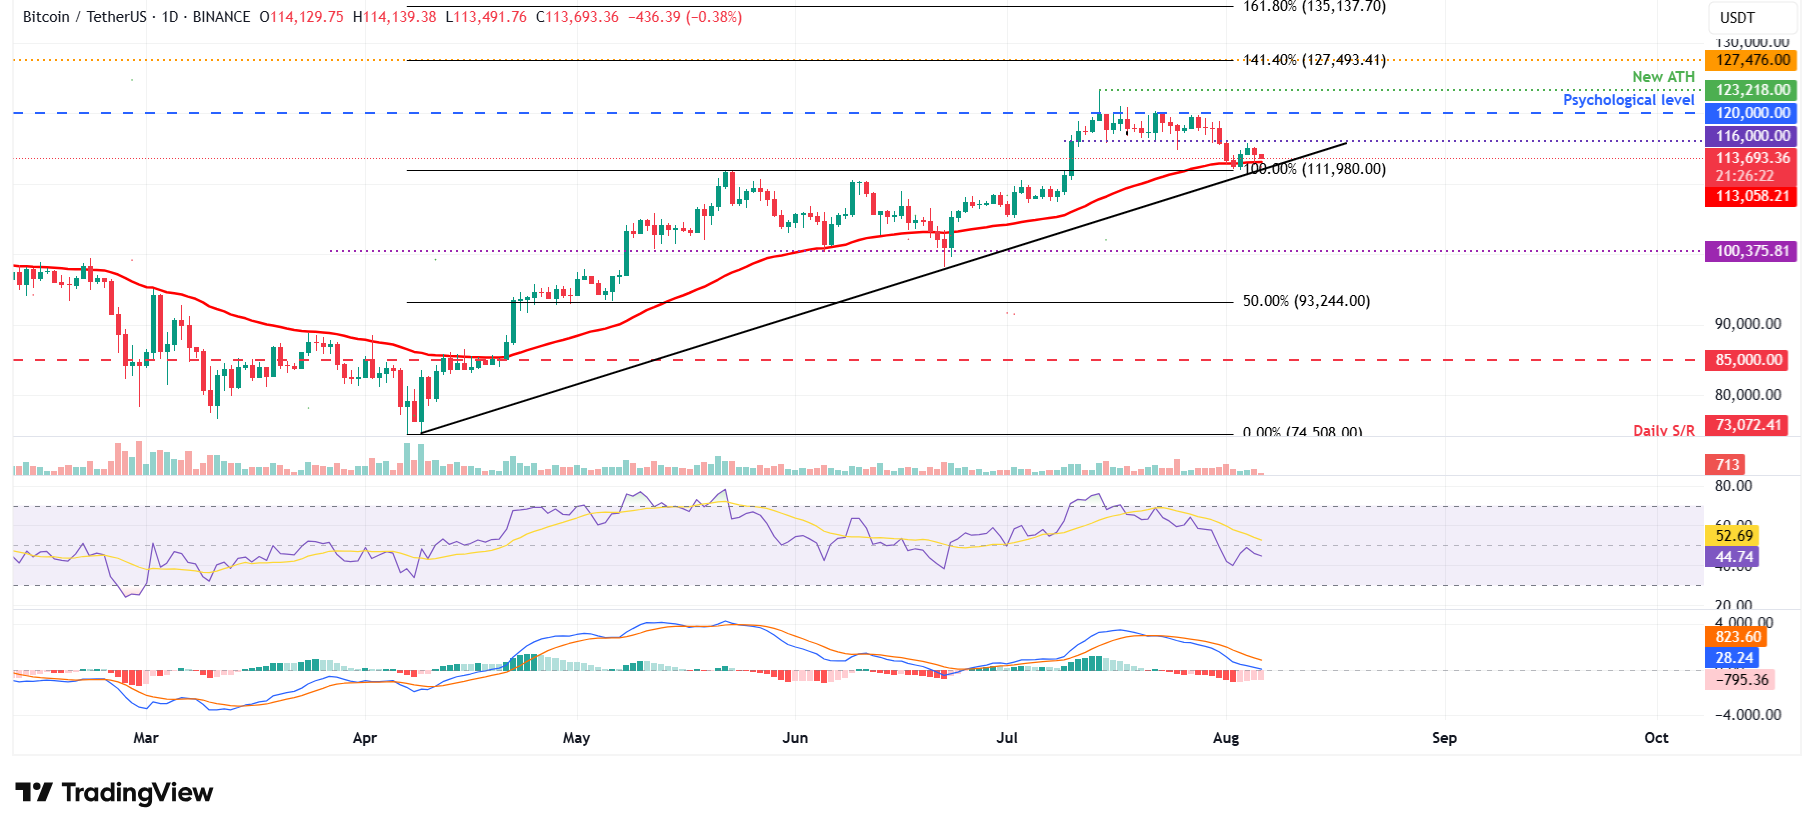
BTC/USDT daily chart
However, if BTC finds support around its 50-day EMA at $113,058, it could extend the recovery toward its key resistance at $116,000.
Ethereum correction continues as it retests its daily resistance at $3,730
Ethereum price found support around its 78.6% Fibonacci retracement level at $3,392 on Sunday and recovered by 10.25% until the next day. However, on Tuesday, it faced rejection from its daily resistance level at $3,730 and declined nearly 3%. At the time of writing on Wednesday, it continues to trade in red at around $3,588.
If ETH continues its correction, it could extend the decline toward its 78.6% Fibonacci retracement level at $3,392.
The RSI on the daily chart reads 56 after bouncing off the neutral level of 50 on Saturday, indicating bullish momentum gaining traction. However, the MACD continues to hold a bearish crossover and supports the correction thesis.
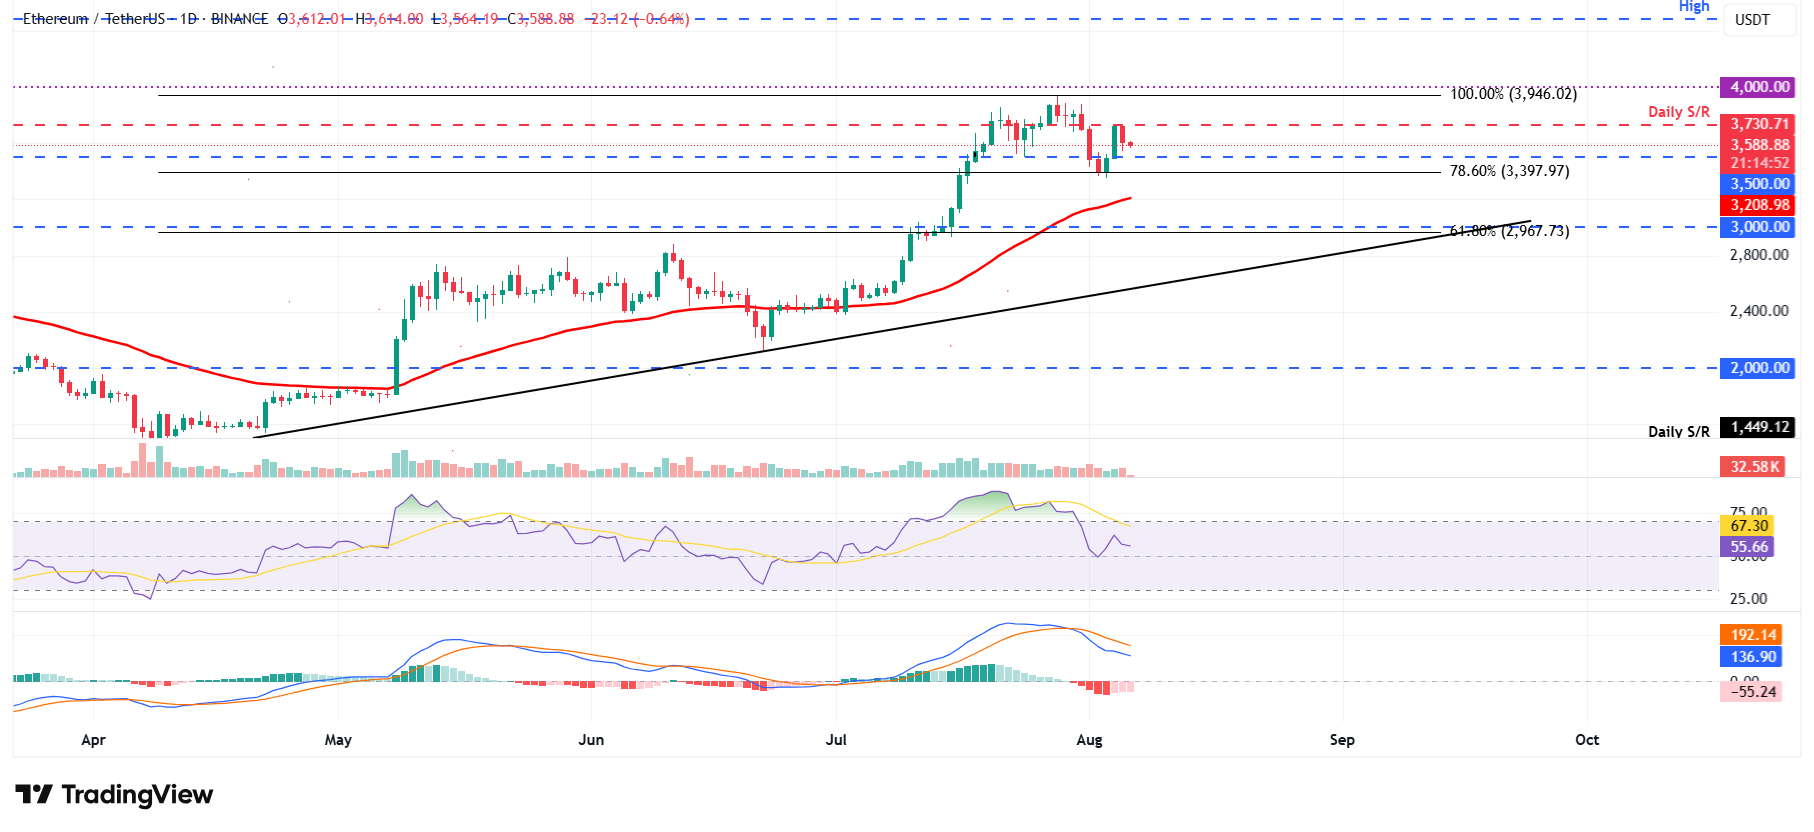
ETH/USDT daily chart
On the other hand, if ETH recovers and closes above the daily resistance at $3,730 on a daily basis, it could extend the recovery toward its next key resistance at $4,000.
XRP shows weakness in momentum indicators
XRP found support around the 50-day EMA at $2.80 on Sunday and recovered nearly 11% by Monday. This 50-day EMA roughly coincides with the daily level at $2.72 and the 50% Fibonacci level at $2.78, making it a key support zone. However, on Tuesday, XRP declined 3.56% and at the time of writing on Wednesday, it continues to trade below $2.92.
If XRP continues a pullback, it could extend the decline toward its key support at $2.80.
The RSI on the daily chart is slipping below its neutral level of 50, indicating fading bullish momentum. Like Ethereum, XRP's MACD indicator also supports the bearish thesis.
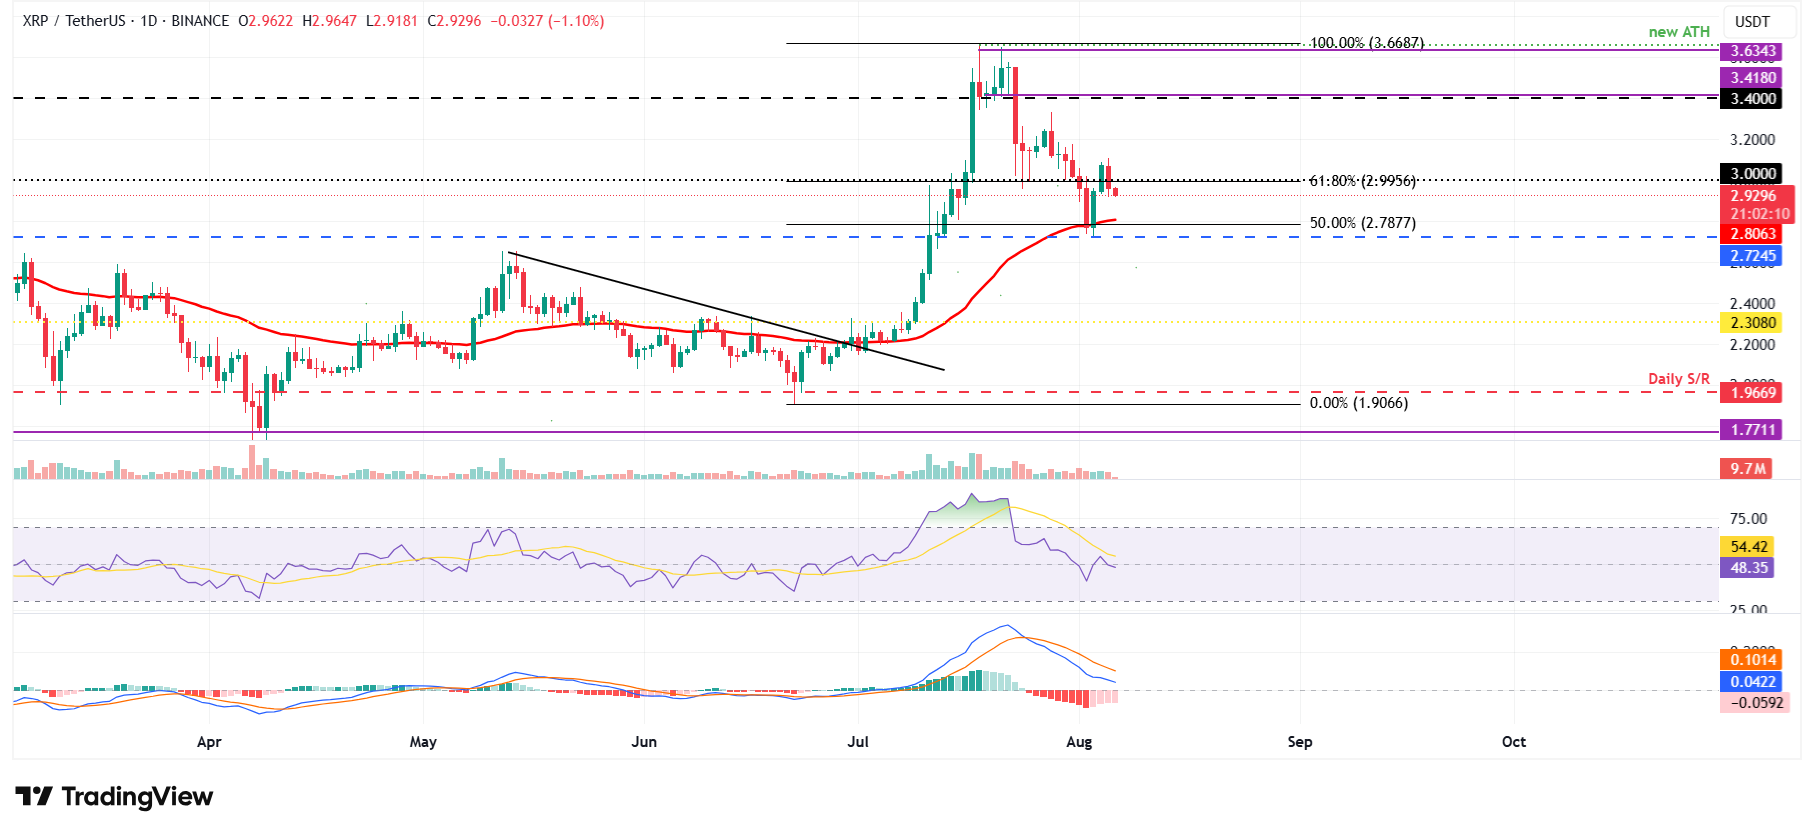
XRP/USDT daily chart
Conversely, if XRP recovers, it could extend the recovery toward its next daily resistance at $3.40.
Cryptocurrency metrics FAQs
What is circulating supply?
The developer or creator of each cryptocurrency decides on the total number of tokens that can be minted or issued. Only a certain number of these assets can be minted by mining, staking or other mechanisms. This is defined by the algorithm of the underlying blockchain technology. On the other hand, circulating supply can also be decreased via actions such as burning tokens, or mistakenly sending assets to addresses of other incompatible blockchains.
What is market capitalization?
Market capitalization is the result of multiplying the circulating supply of a certain asset by the asset’s current market value.
What is trading volume?
Trading volume refers to the total number of tokens for a specific asset that has been transacted or exchanged between buyers and sellers within set trading hours, for example, 24 hours. It is used to gauge market sentiment, this metric combines all volumes on centralized exchanges and decentralized exchanges. Increasing trading volume often denotes the demand for a certain asset as more people are buying and selling the cryptocurrency.
What is the funding rate?
Funding rates are a concept designed to encourage traders to take positions and ensure perpetual contract prices match spot markets. It defines a mechanism by exchanges to ensure that future prices and index prices periodic payments regularly converge. When the funding rate is positive, the price of the perpetual contract is higher than the mark price. This means traders who are bullish and have opened long positions pay traders who are in short positions. On the other hand, a negative funding rate means perpetual prices are below the mark price, and hence traders with short positions pay traders who have opened long positions.
