TRX Primed for Breakout: Surging Open Interest & Network Activity Signal Bullish Tron Price Rally

TRX bulls are licking their chops as Tron flashes its most convincing upside setup in months. Open interest spikes while the network hums with activity—classic precursors to a volatile move.
The leverage pile-up: Traders are loading up on TRX derivatives, betting big on a momentum swing. No one tells you 80% of these positions get liquidated before the real move happens.
Network effect: Real-world usage separates hype from value. Tron's swelling transaction volume suggests more than just speculators are playing this hand.
Will TRX deliver this time? The chart says maybe. The on-chain data whispers probably. And the crypto bros at your local WeWork will swear it's a lock—right before checking their margin positions.
Increased interest in Tron boosts Open Interest, network activity
TronScan data shows the Total Value Locked (TVL) on the TRX network has increased by over 1.41% over the 24 hours, reaching $27.14 billion. A spike in TVL reflects increased adoption as user deposits surge.
Adding credence to increased adoption, the total accounts on the network has hit a record high of 323 million. The total transfer volume has surpassed $20.28 trillion, including the average stablecoin transfers of $160 billion last week, indicating increased network activity.
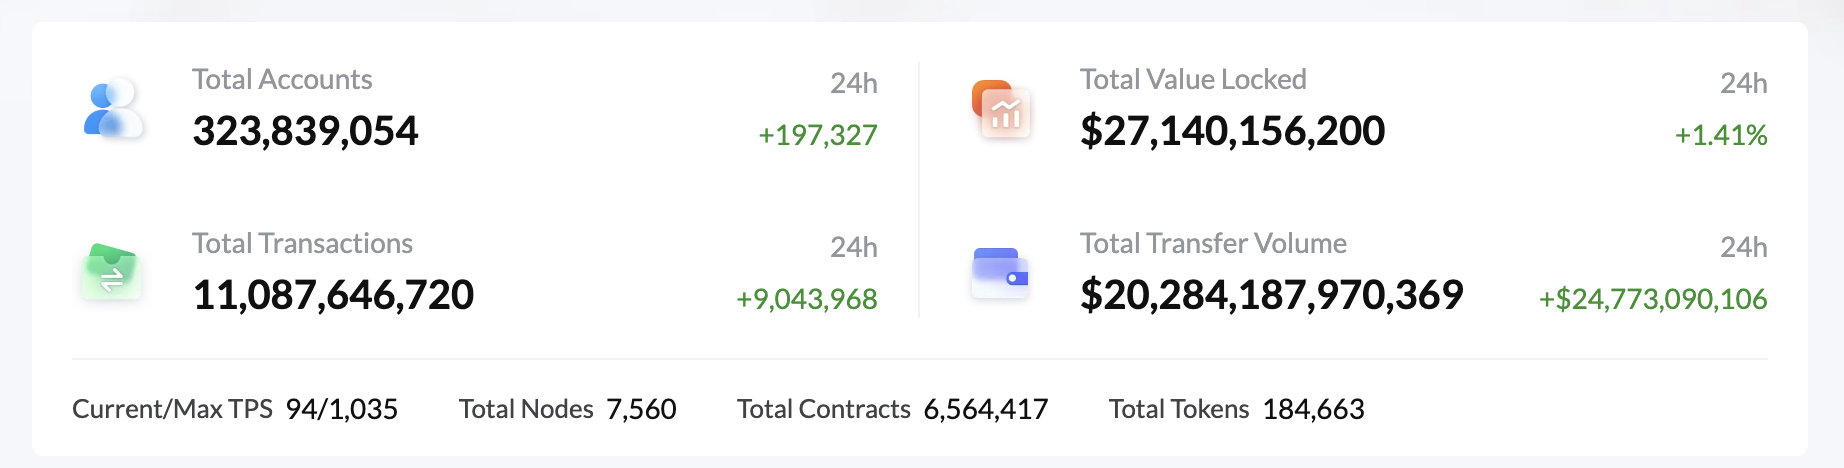
Tron network metrics. Source: TronScan
The interest in TRON continues to grow, underpinned by heightened network activity, resulting in an increase of over 6% in Open Interest (OI) in the last 24 hours, reaching $522.10 million. An OI spike translates to increased capital inflow in TRX futures and options contracts, indicating rising interest.
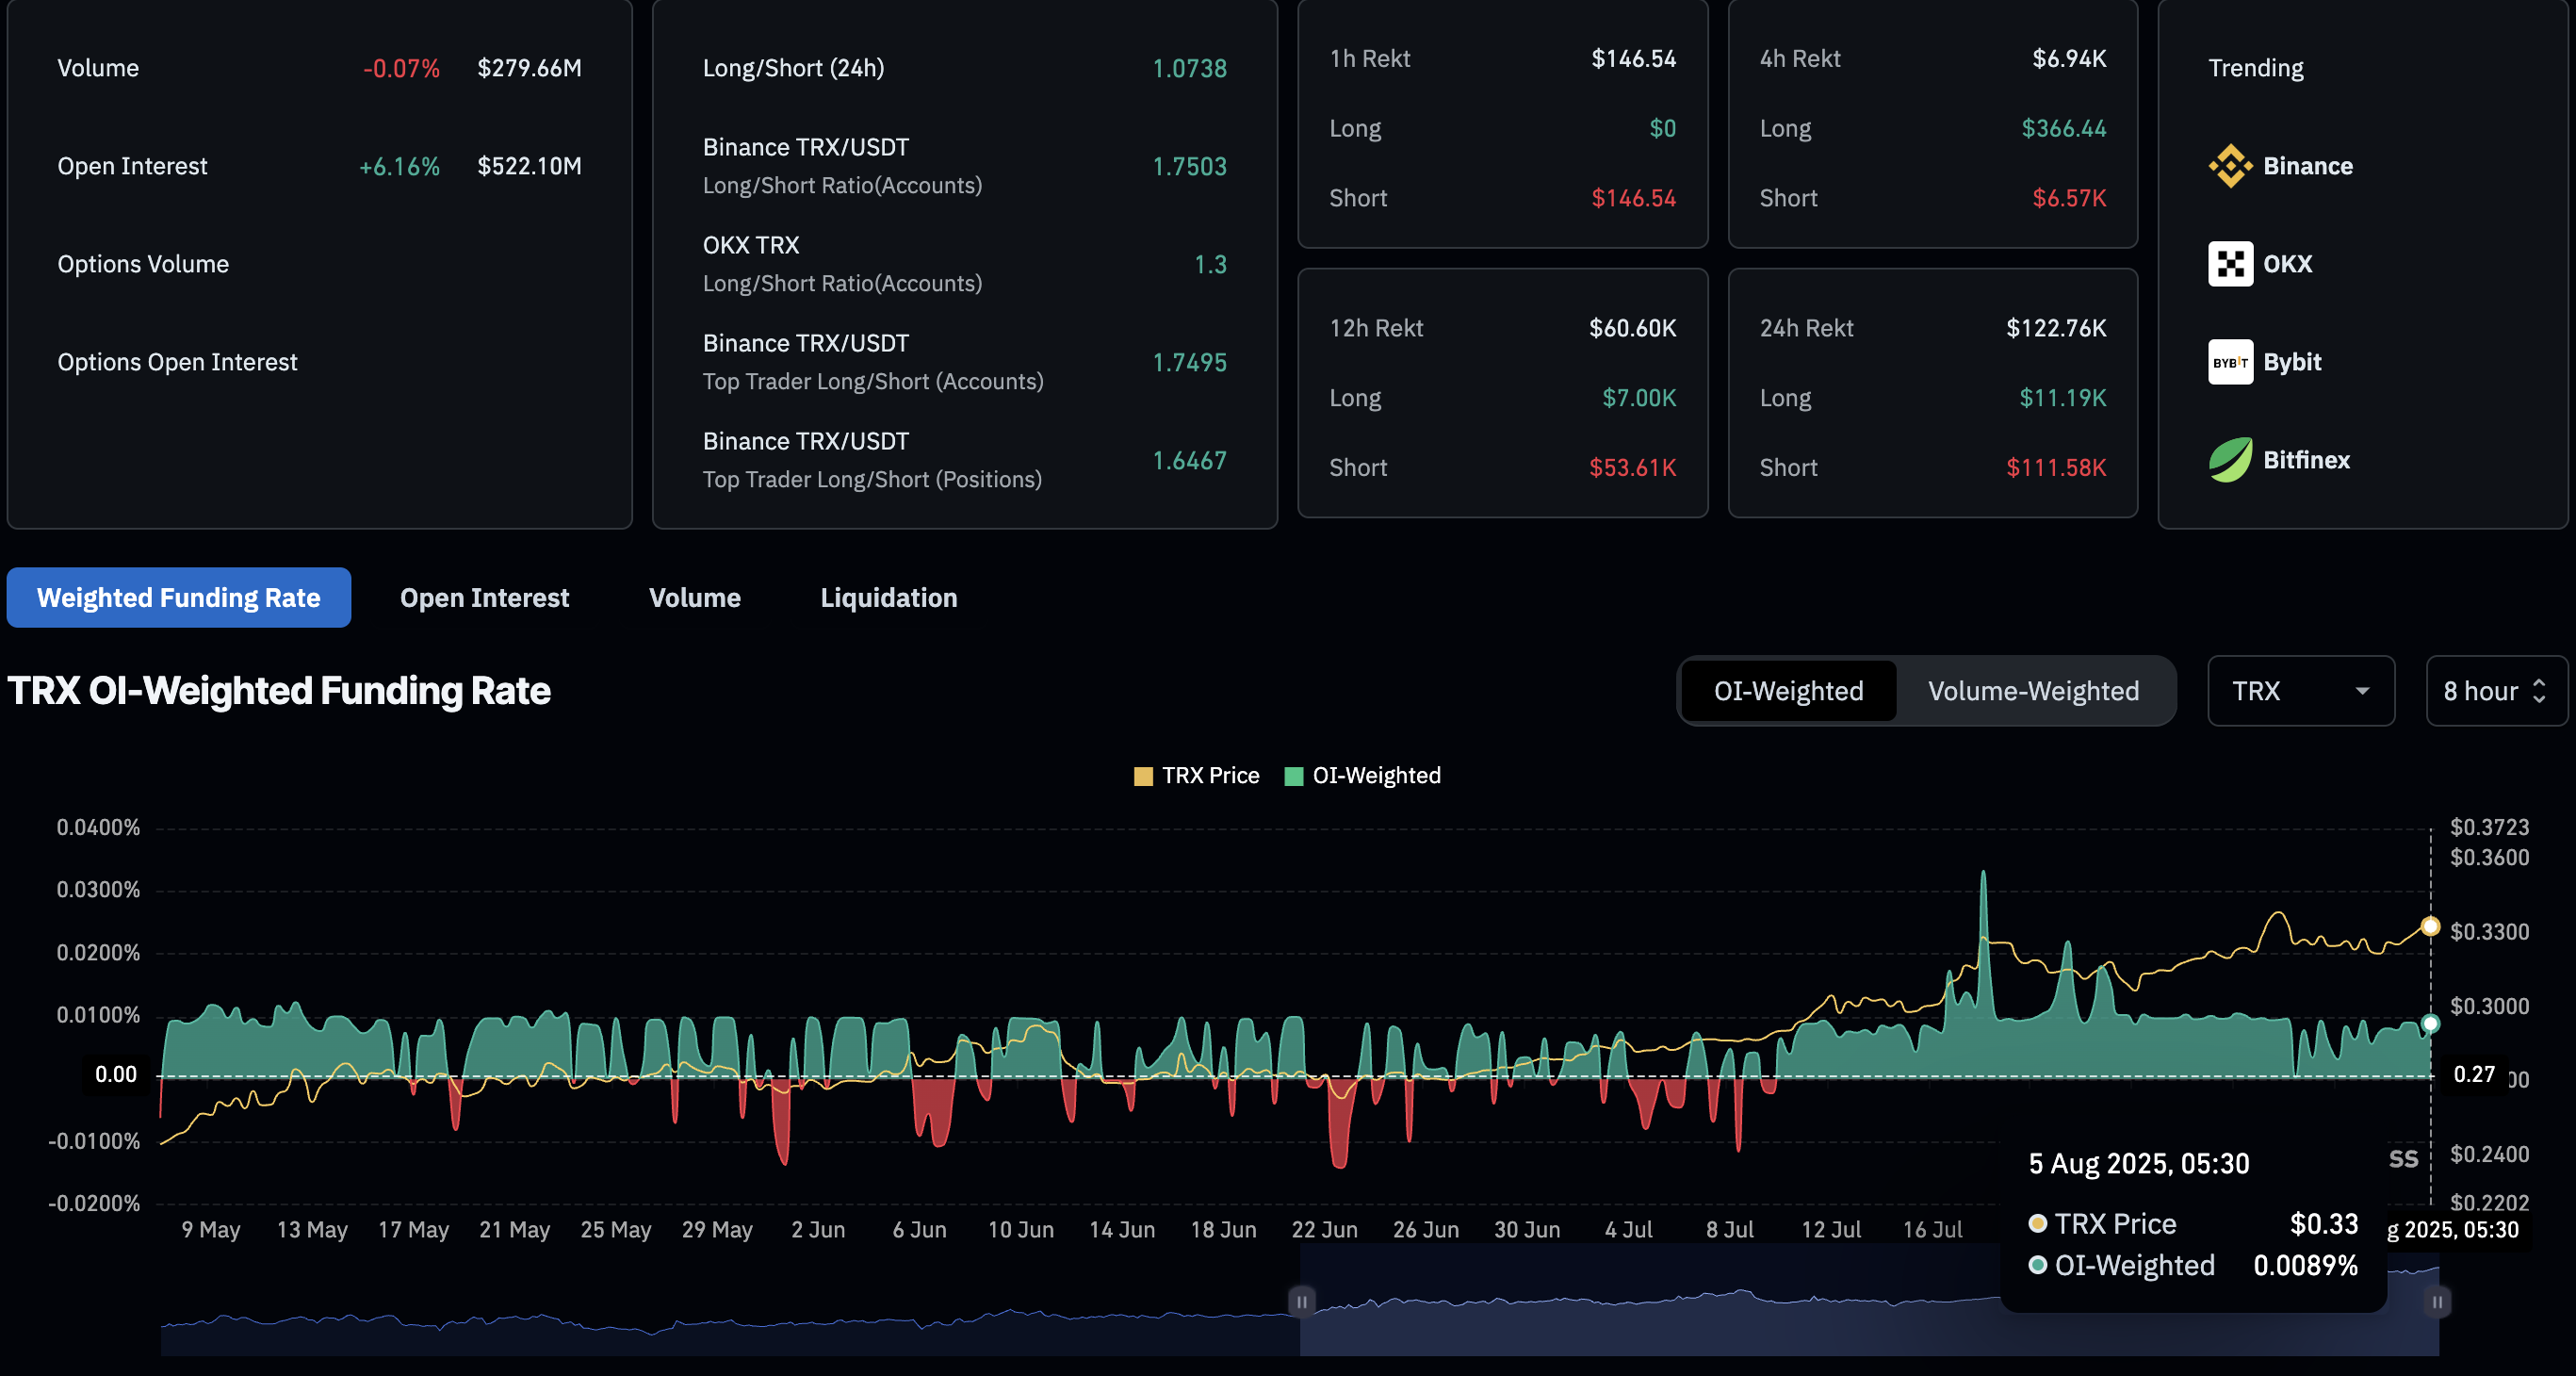
Tron Open Interest. Source: Coinglass
Tron recovery run at risk as momentum indicators flash mixed signals
Tron bounces off by nearly 2% on Sunday, kickstarting the ongoing V-shaped recovery with a morning star pattern formed at the $0.3187 low from last week. At the time of writing, TRX appreciates over 1% so far on Tuesday, adding to the 1.62% rise on Monday.
Looking up, if TRX exceeds the $0.3385 level, it could retest the previous week’s high at $0.3510.
Still, investors should consider tempering bullish expectations as the Relative Strength Index (RSI) diverges from the TRX uptrend, declining below the overbought line. This highlights a bearish RSI divergence, a potential sell signal.
Furthermore, the Moving Average Convergence Divergence (MACD) maintains a sideways trend with its signal line, indicating an increase in volatility.
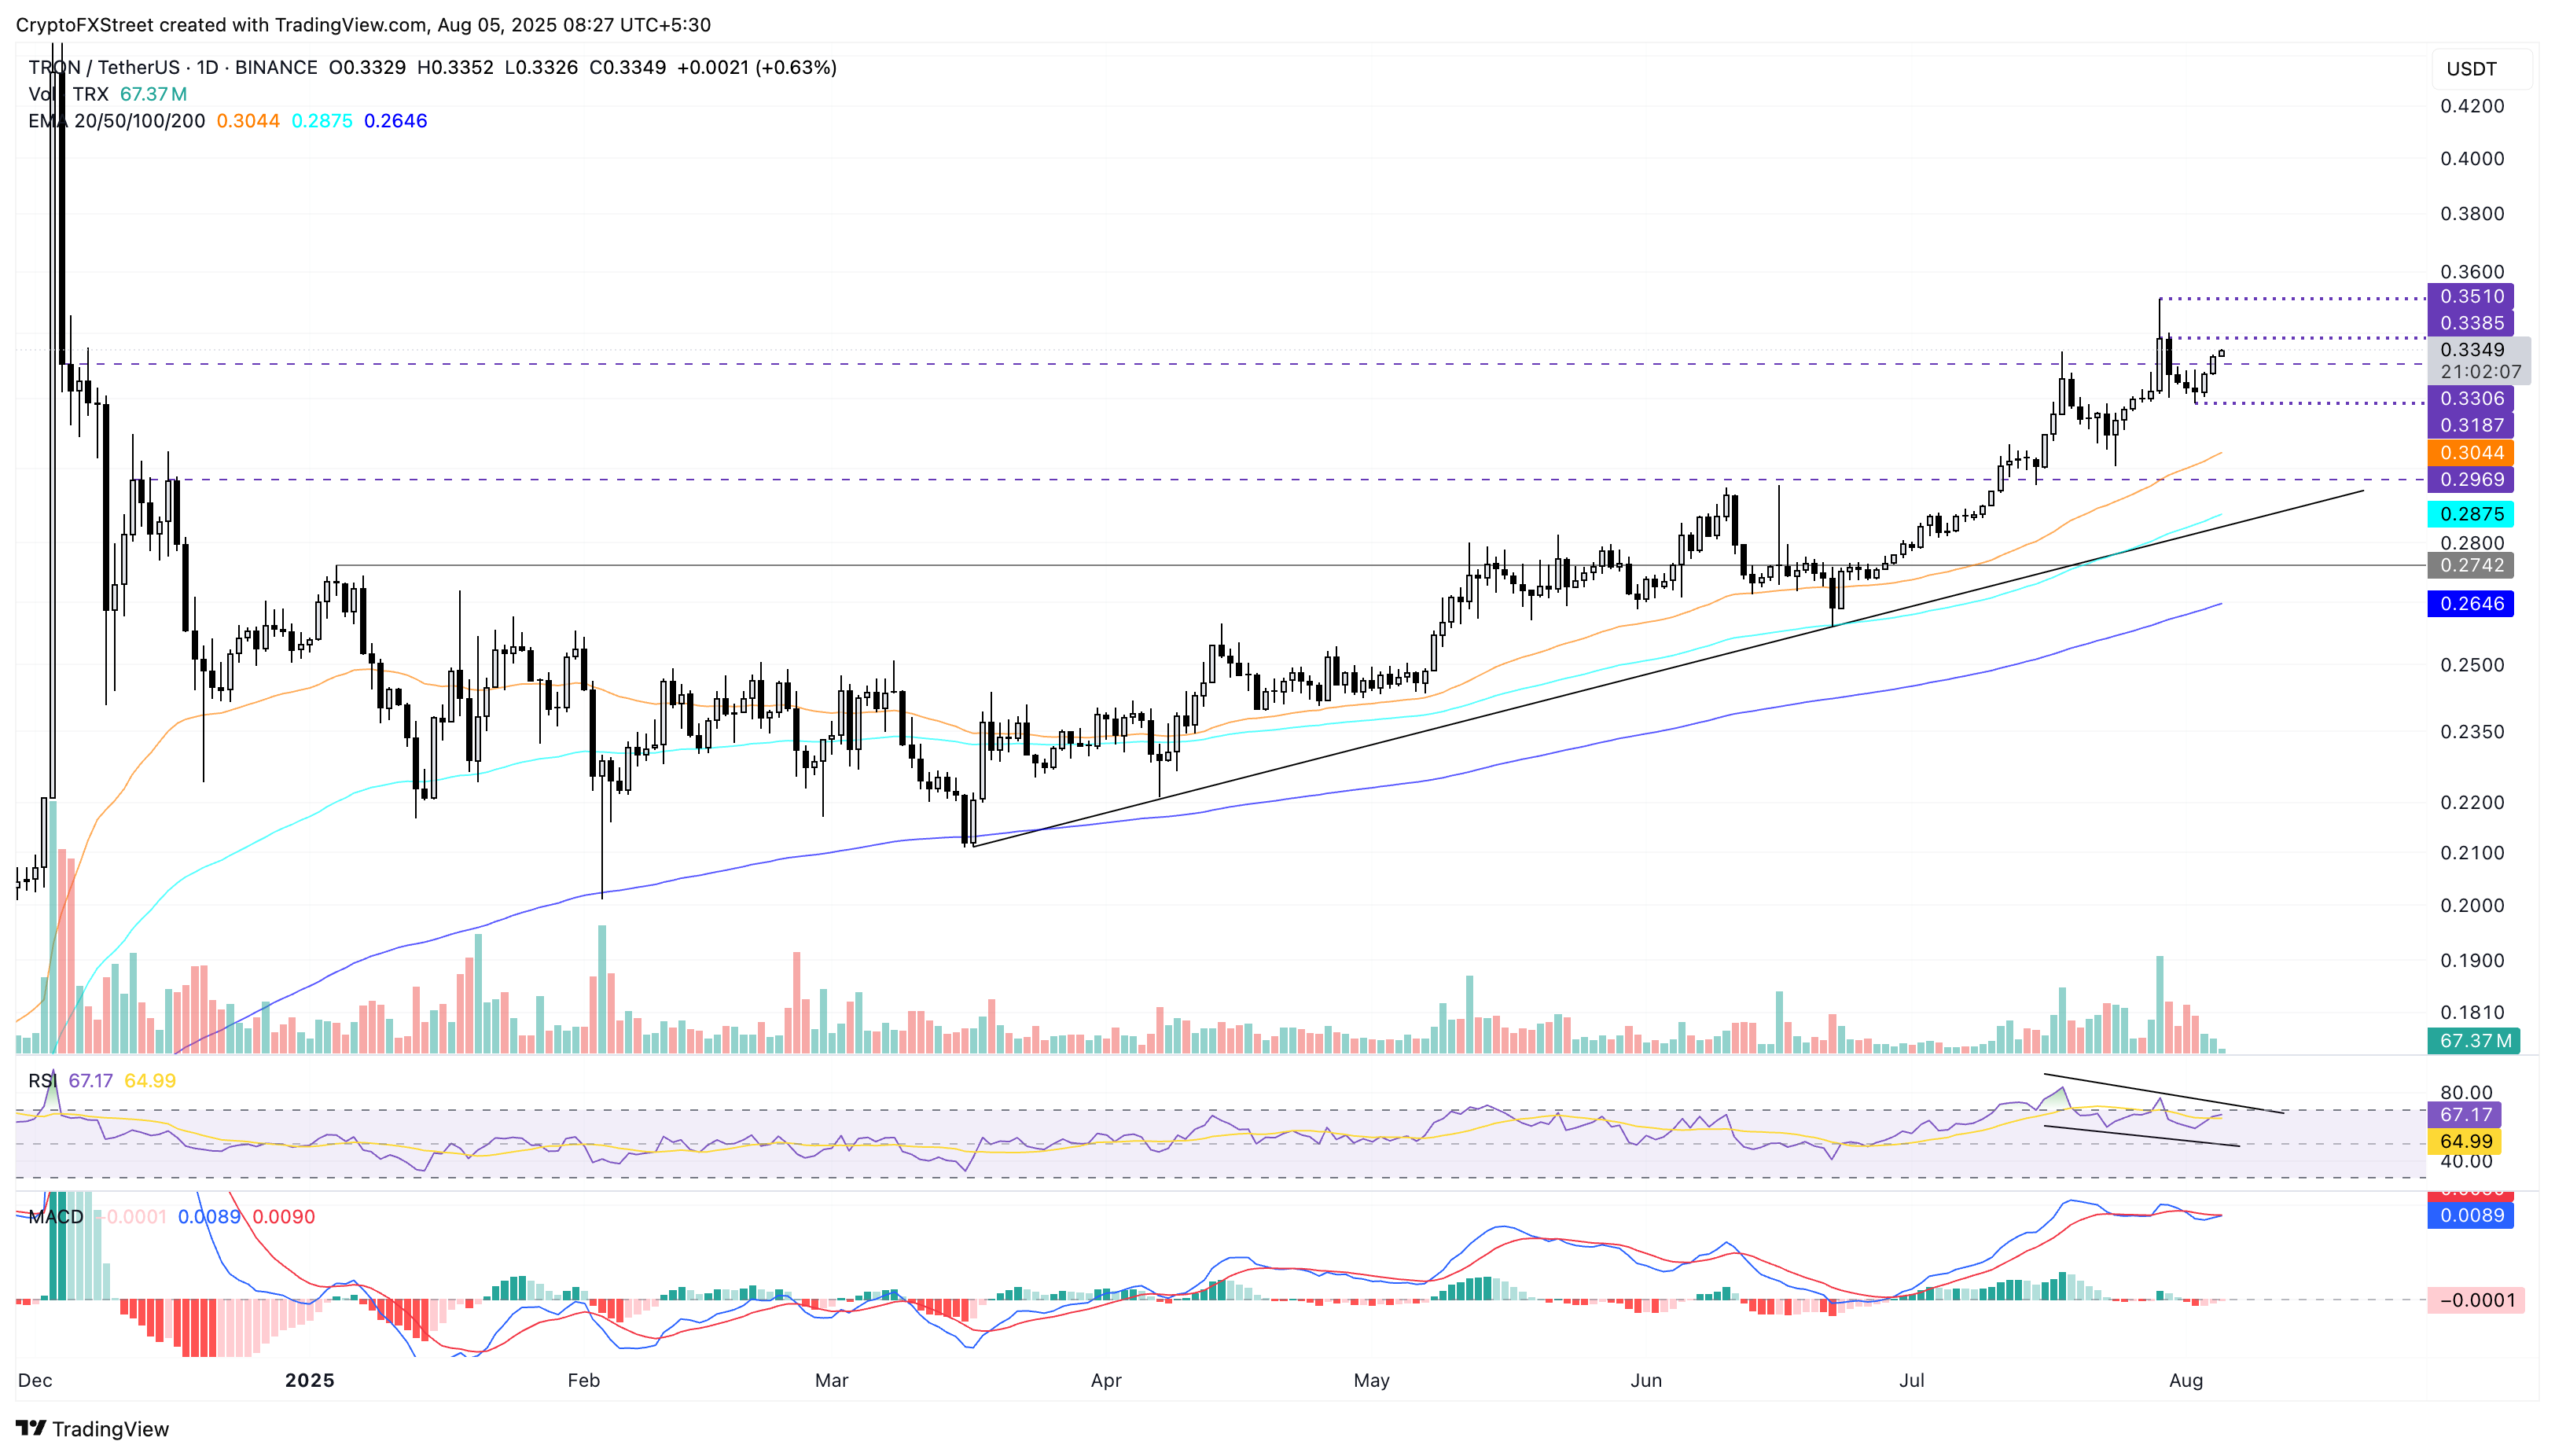
TRX/USDT daily price chart.
On the downside, a reversal in TRX fueled by the RSI divergence could retest the $0.3187 support floor, erasing the gains from the last two days.
