AAVE Price Alert: Bears Pounce as Technicals & On-Chain Data Signal 10%+ Plunge

Crypto's favorite 'risk-on' asset hits turbulence. AAVE's chart flashes red while blockchain sleuths spot whales dumping—just another Tuesday in DeFi.
Technical breakdown: The 50-day SMA just got steamrolled like a retail trader's stop-loss. On-chain metrics show exchange inflows spiking—never a good sign when paired with shrinking open interest.
Market psychology 101: Fear's contagious when leverage longs start getting liquidated. That 'double-digit drop' warning? Looking more prophetic by the hour.
Silver lining for degens: Double-digit discounts beat another soul-crushing stablecoin yield any day. Just maybe wait for the Fed to finish 'saving' markets first.
Aave’s on-chain and derivatives data show a bearish bias
CryptoQuant data, as shown in The Graph below, highlights selling pressure on Aave. The Taker CVD (Cumulative Volume Delta) for AAVE is negative, and the value has been steadily decreasing since mid-July. This indicator measures the cumulative difference between market buy and sell volumes over three months. When the 90-day CVD is positive and increasing, it suggests the Taker Buy Dominant Phase, while a negative and decreasing value indicates the Taker Sell Dominant Phase.
-1754369161462-1754369161475.png)
Aave Spot Taker CVD chart. Source: CryptoQuant
According to Coinglass’s data, the long-to-short ratio of AAVE reads 0.82 on Tuesday, the lowest value in over a month. This ratio, below one, reflects bearish sentiment in the markets, as more traders are betting on the asset price to fall.
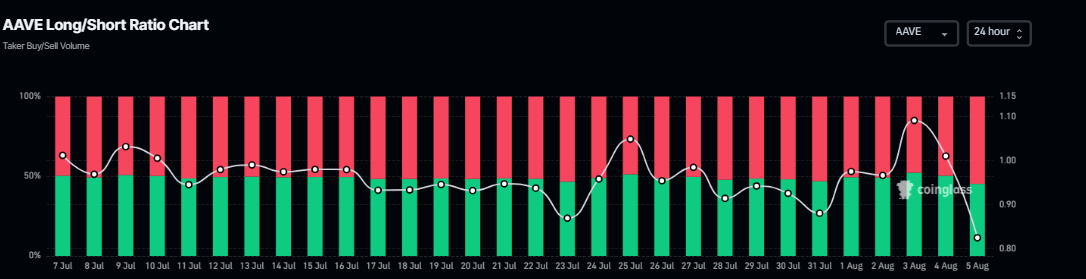
AAVE long-to-short ratio chart. Source: Coinglass
Aave Price Forecast: AAVE bears remain in control
Aave price broke below the ascending trendline (drawn by connecting multiple lows since early April) on Thursday and declined 5% in the next two days. However, it found support around its 200-day Exponential Moving Average (EMA) at $242.27 on Sunday and recovered 8.68% by Monday, retesting the previously broken ascending trendline. At the time of writing on Tuesday, it trades slightly down at around $262.13.
If Aave continues its correction, it could extend the decline to retest its 200-day EMA at $242.27. A successful close below this level could extend an additional decline toward its 50% price retracement level at $225.64.
The Relative Strength Index (RSI) reads 40, below its neutral level of 50, indicating bearish momentum. Additionally, the Moving Average Convergence Divergence (MACD) also showed a bearish crossover that still holds, suggesting bearish momentum and a downward trend.
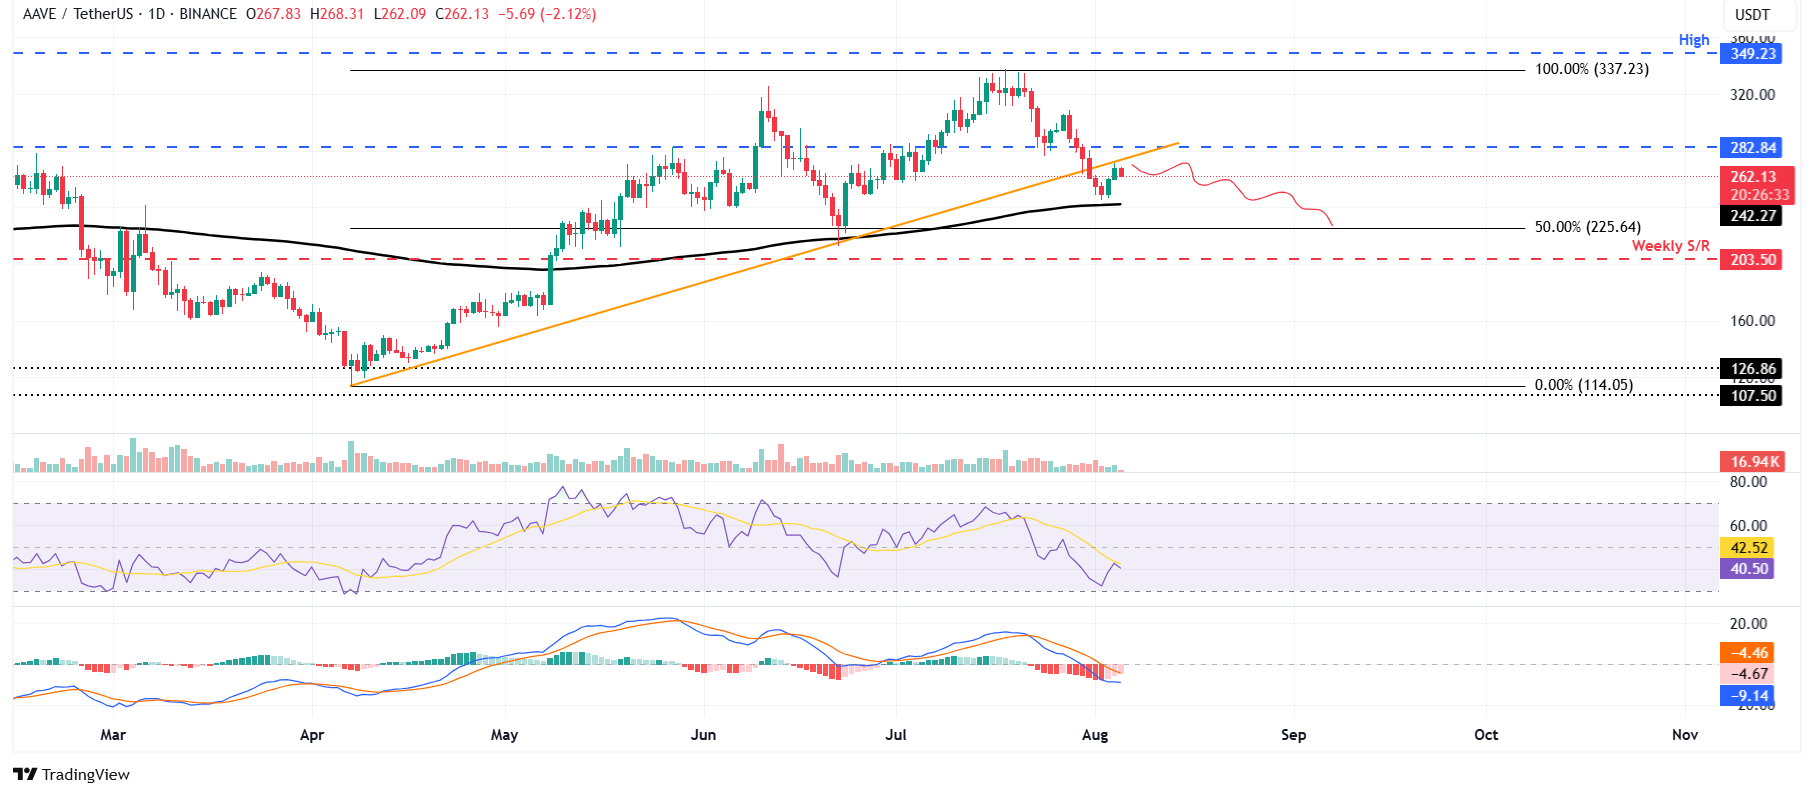
AAVE/USDT daily chart
However, if AAVE recovers and closes above its daily resistance level at $282.84, it could extend the rally toward its July 18 high of $349.23.
