🚀 CAKE, JUP, SPX Rocket Past Rivals: These Cryptos Are Outpacing the Market in 2025

Bullish momentum surges back as PancakeSwap, Jupiter, and SPX tokens lead the charge—leaving traditional assets eating dust.
### The Rebound No One Saw Coming
While Wall Street obsesses over fractional Fed rate cuts, DeFi’s dark horses are quietly stacking double-digit gains. CAKE’s 30% weekly pump? A mere appetizer.
### Liquidity Wars: DEX Tokens Flex Muscle
JUP’s governance upgrades sparked a 22% breakout—proof that traders still bet on decentralized infrastructure despite the SEC’s 'regulation-by-lawsuit' circus.
### Meme Coins? Nah, Utility Wins
SPX’s 18% climb exposes a dirty secret: projects with actual use cases (like cross-chain settlements) outperform dog-themed gambles. Who knew?
Final Thought:
Crypto winters thaw faster than a banker’s ethics—but this rally’s backbone is stronger than 2021’s leverage-fueled mirage. Just don’t tell the short sellers.
CAKE eyes further gains to $3.535 as it regains bullish momentum
PancakeSwap edges higher by over 2% at press time on Monday, extending the 10% gains from Sunday. CAKE’s bullish start to the week hit the $3.165 resistance level last tested on February 13.
A decisive push above this level could extend the gains to the $3.535 level, last tested on December 13.
The Moving Average Convergence Divergence (MACD) indicator displays a resurgence in green histogram bars, suggesting a revival of bullish momentum.
The Relative Strength Index (RSI) reads 78 on the daily chart, indicating overbought conditions as the buying pressure grows. Investors may want to temper their bullish expectations, as overbought conditions often signal a quick reversal.
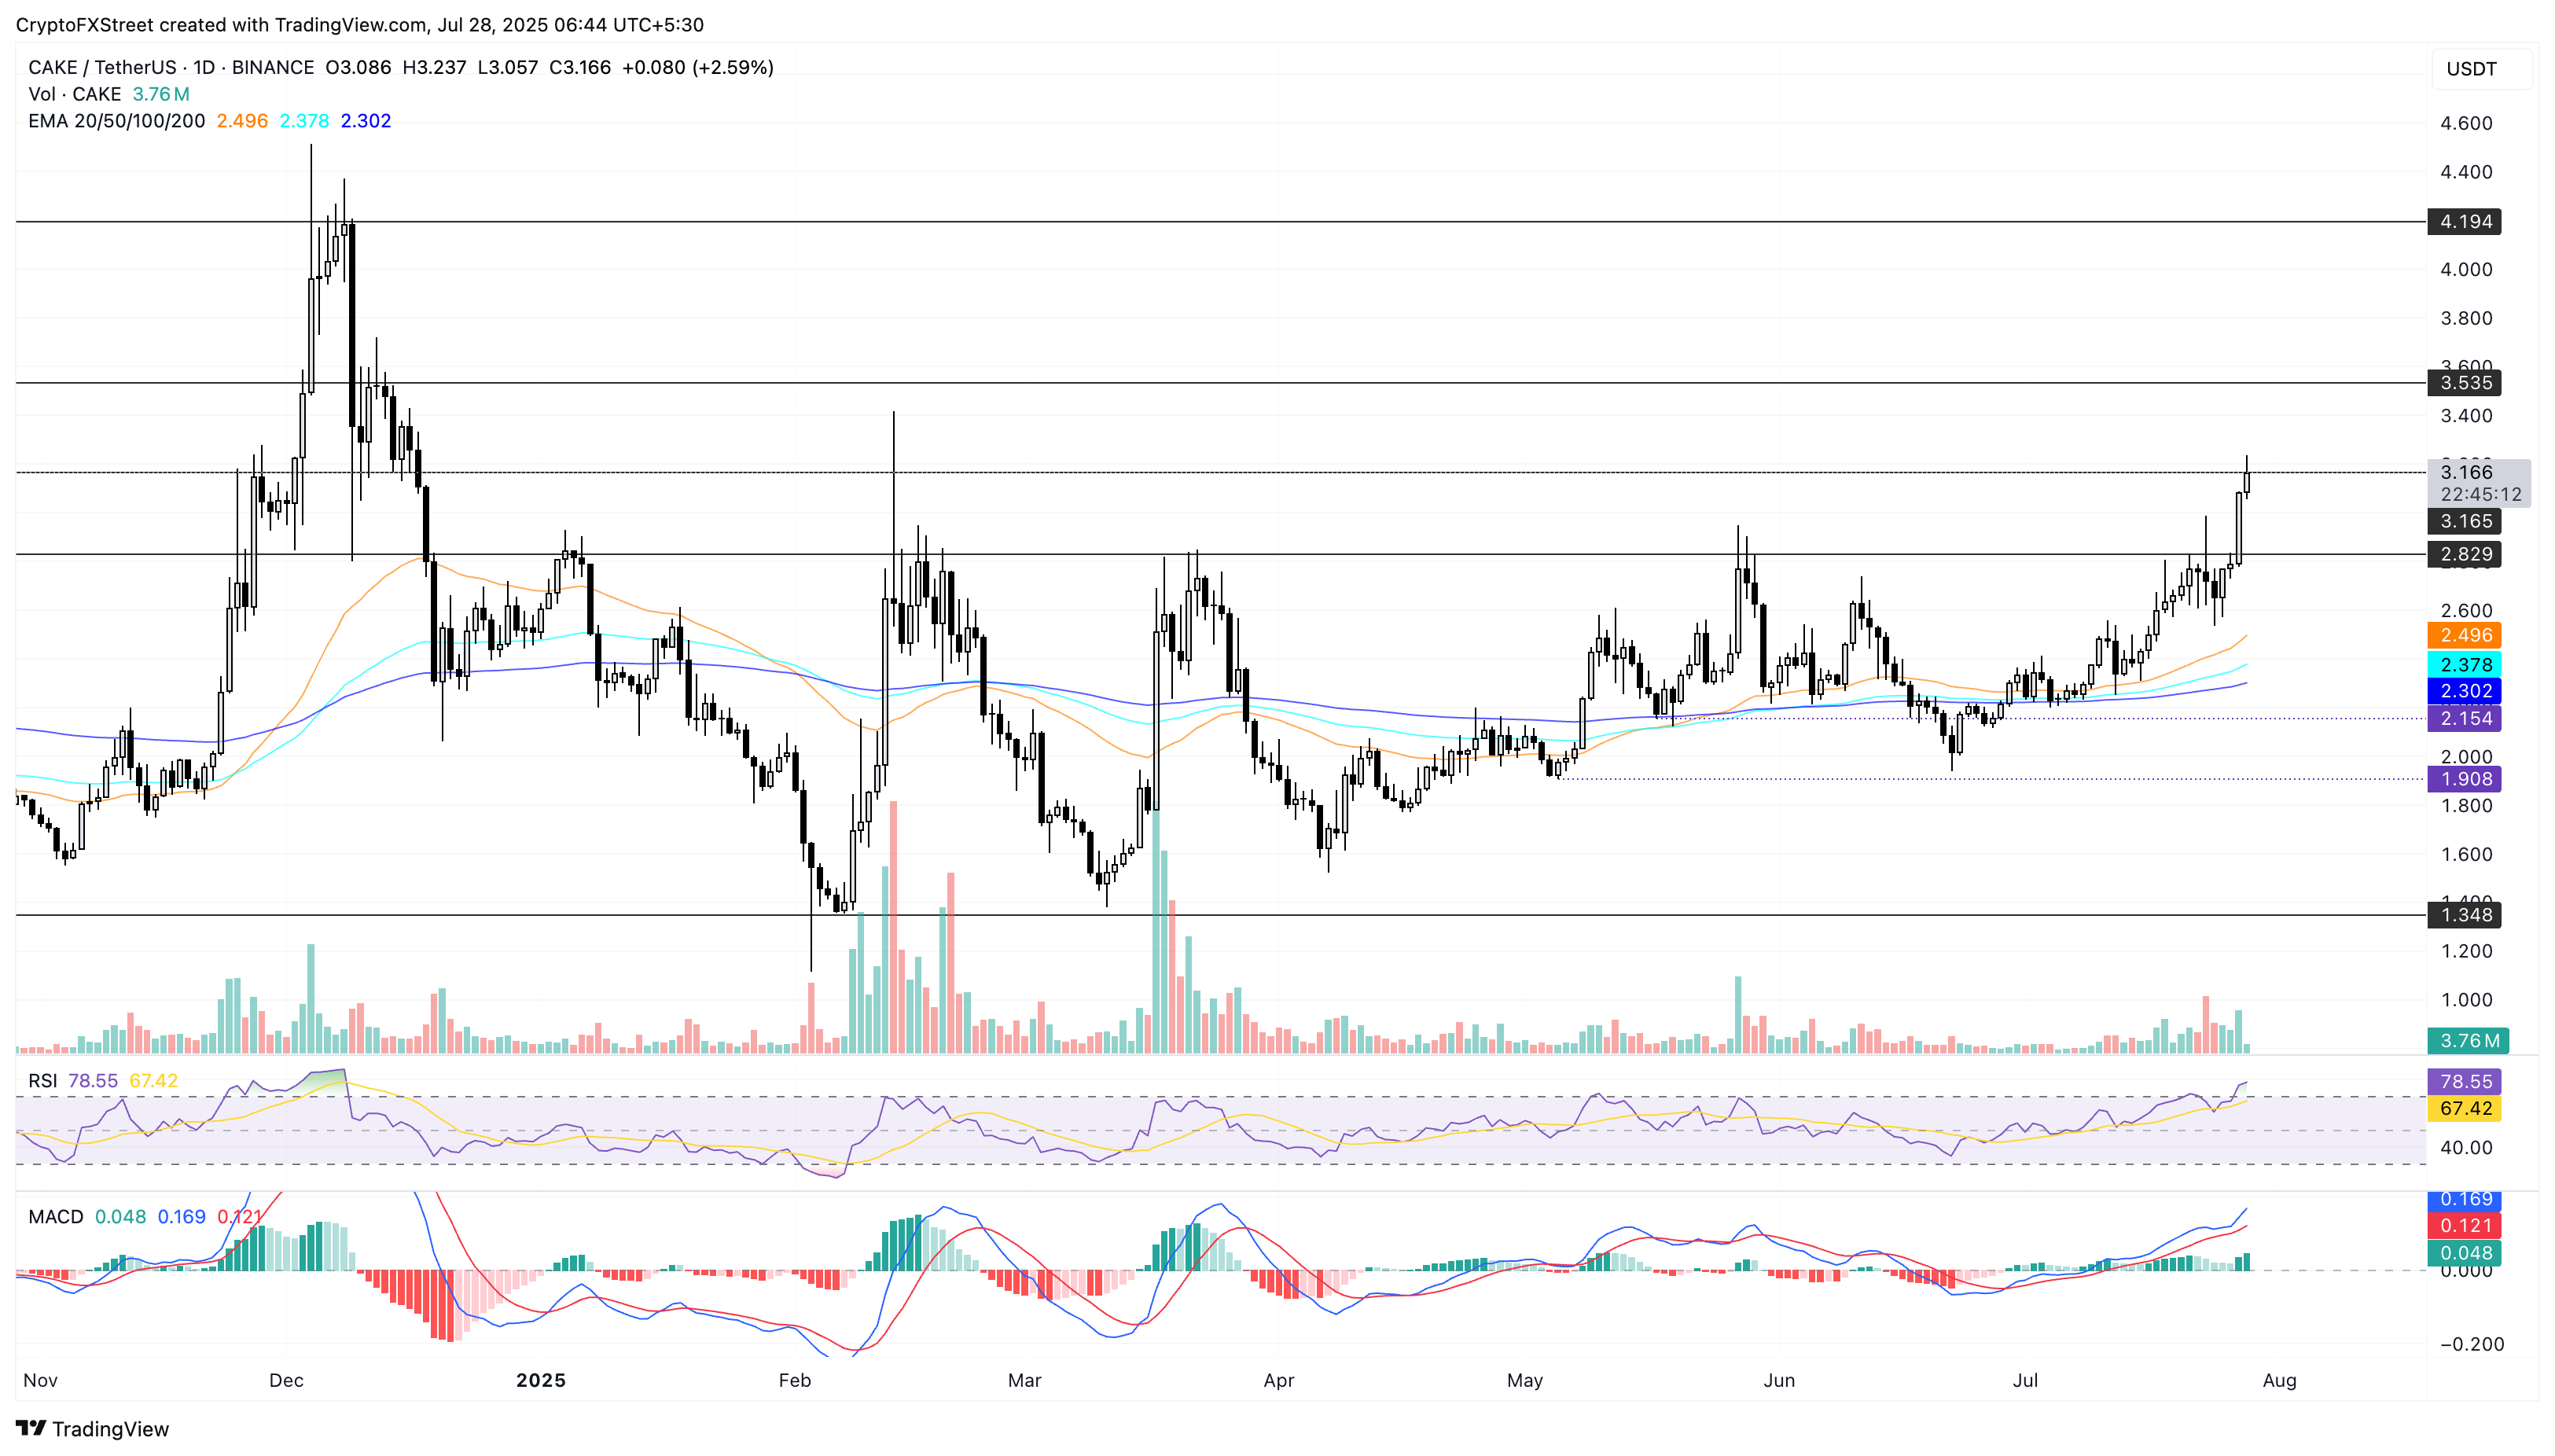
CAKE/USDT daily price chart.
If CAKE fails to mark a decisive daily close above the $3.165 level, it could reverse towards the $2.829 level that previously acted as a multi-month resistance level.
JUP’s recovery run nears the crucial $0.6339 resistance level
Jupiter holds dominance above the $0.5000 psychological level as it bounces off from $0.5131, slightly above the 100-day Exponential Moving Average (EMA) at $0.5105. At press time, JUP ticks higher by over 2% marking its fourth consecutive bullish day.
The short-term recovery in Jupiter nears the $0.6339 resistance level last tested on Tuesday. If JUP upholds momentum for a clean push above this level, it could extend the rally to $0.7459 level, marked by the February 25 low.
Sidelined investors could consider the potential golden cross in the 50-day and 100-day EMAs as a buy signal.
The technical indicators suggest a bullish attempt to maintain the trend, as the green histogram rebounds to prevent the MACD line from crossing below its signal line. The RSI is at 64 on the daily chart as it bounces off an area above the halfway line, suggesting renewed buying pressure.
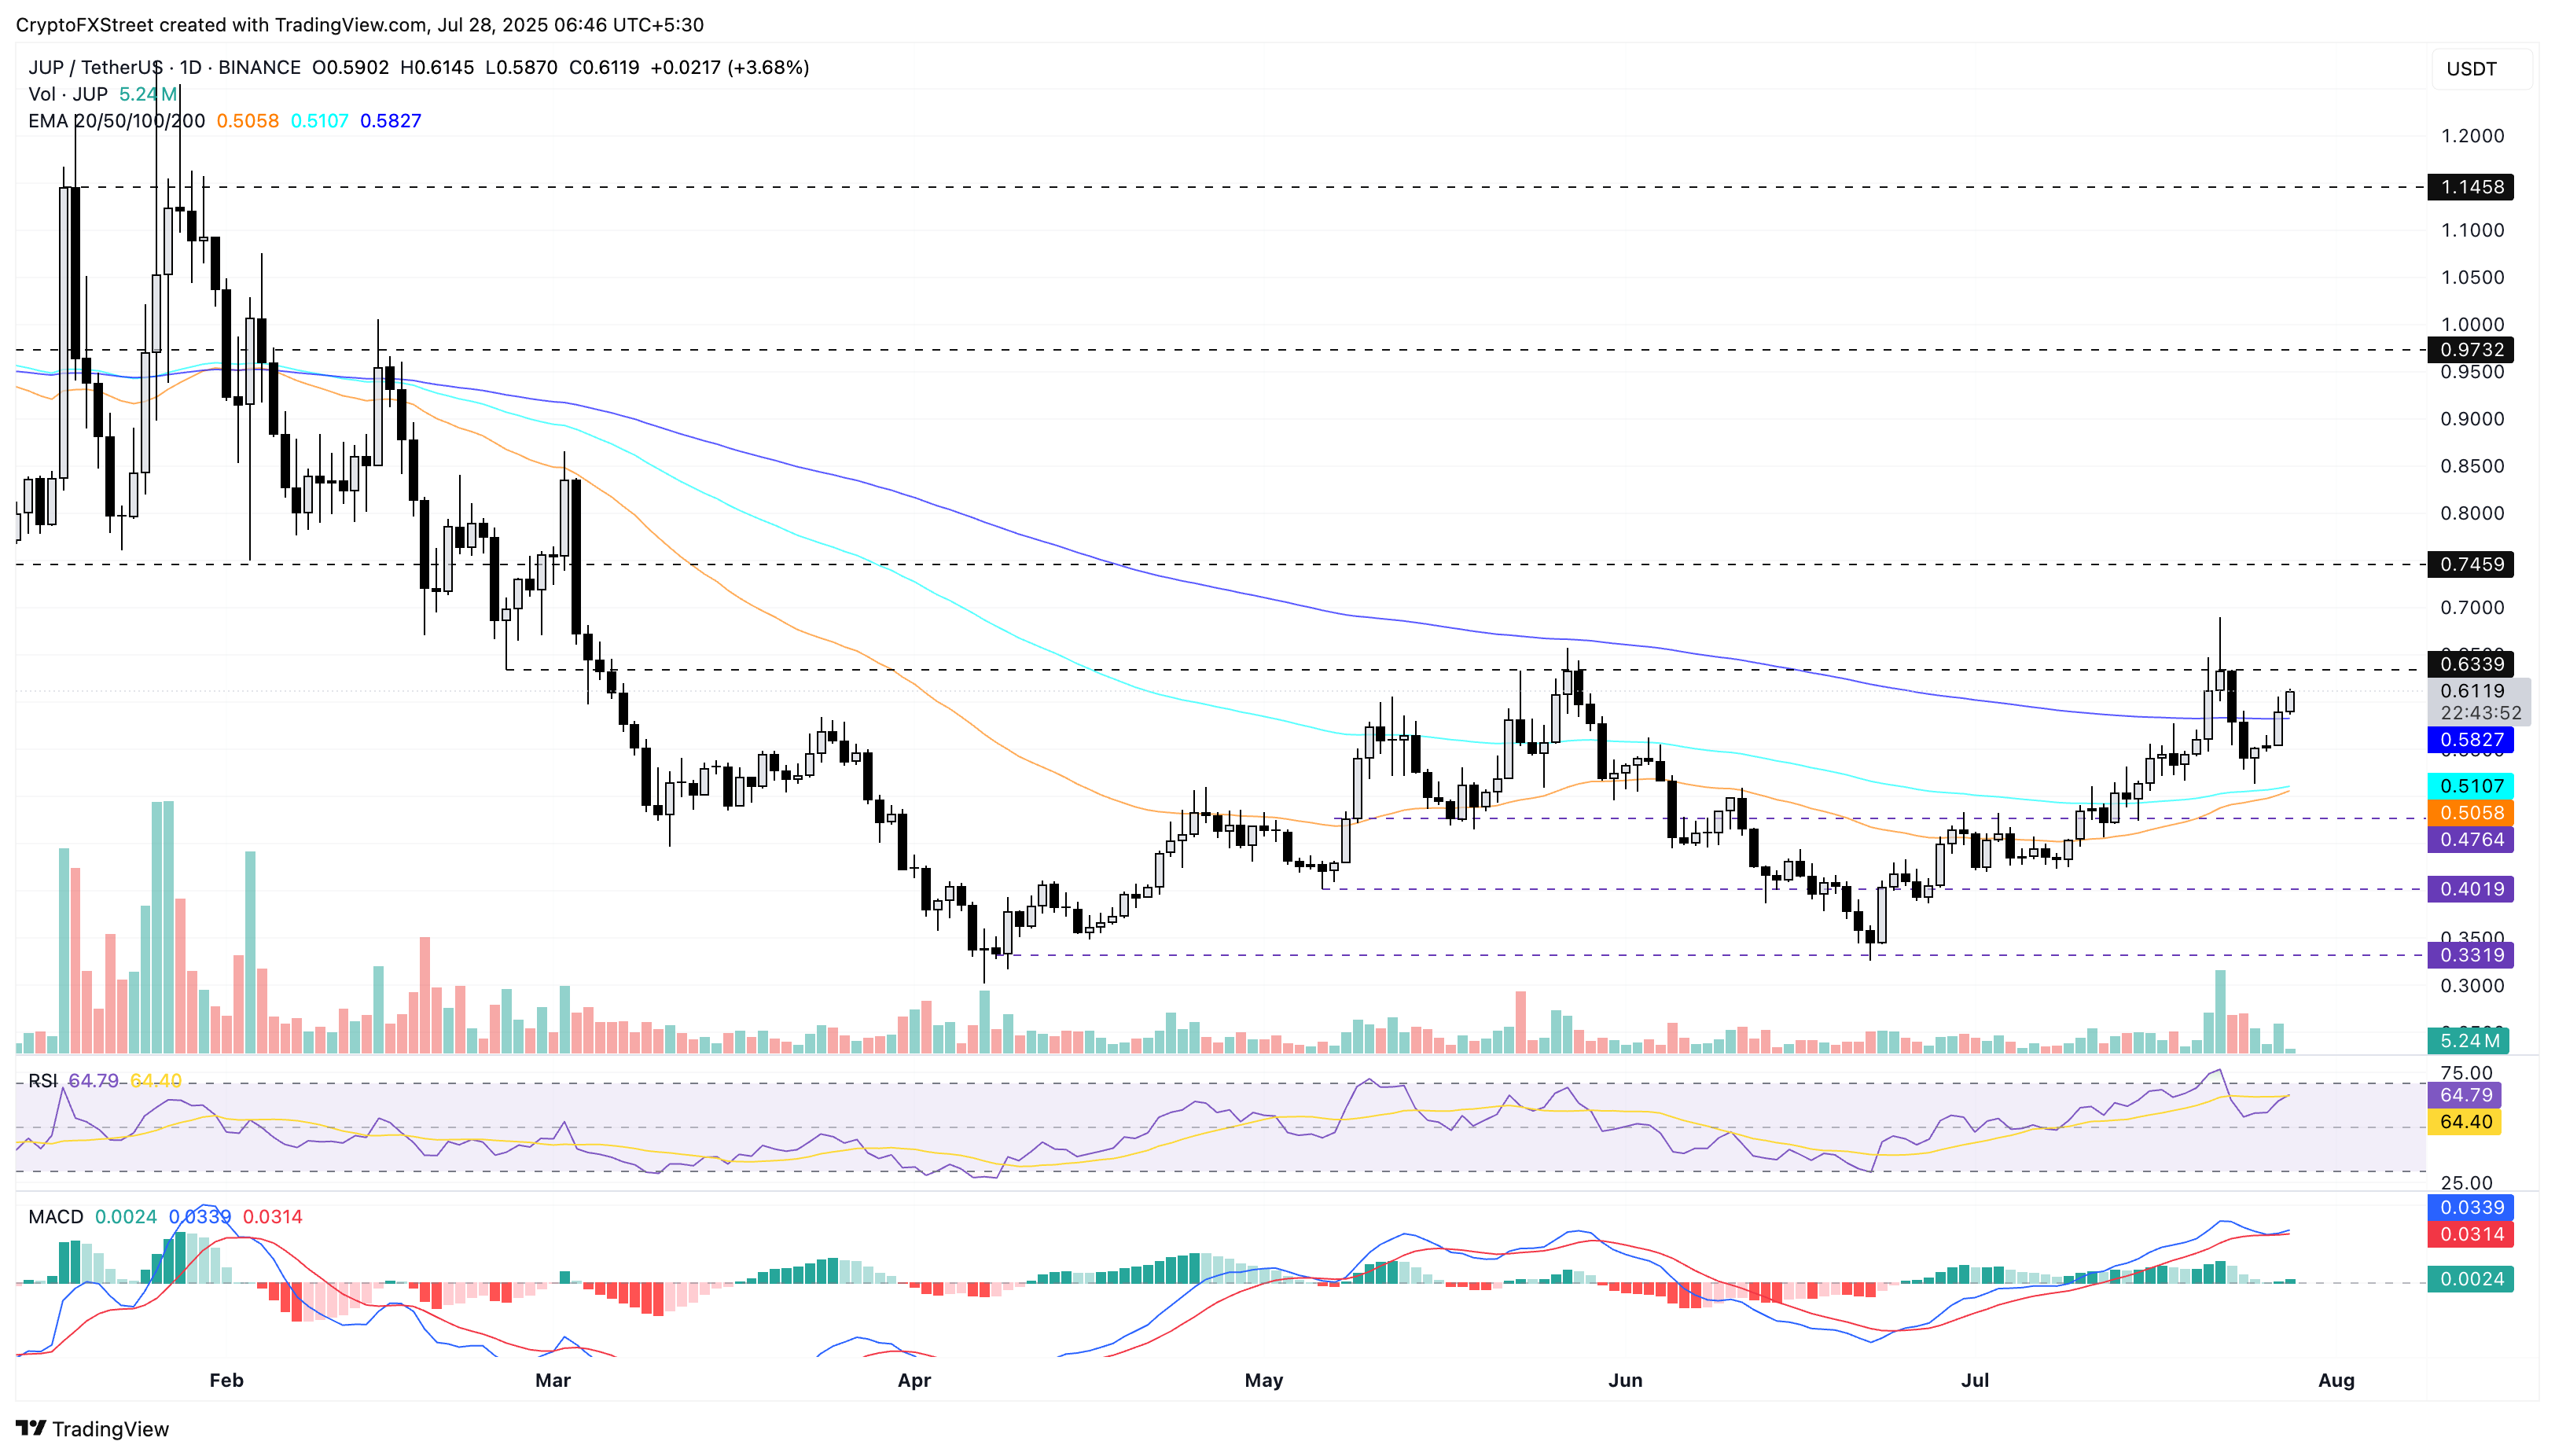
JUP/USDT daily price chart.
On the downside, if JUP falls below the 200-day EMA at $0.5826, it could retest the 100-day EMA at $0.5105.
SPX hits an all-time high while RSI warns of a bearish divergence
The SPX6900 meme coin edges higher by 3% at press time, recording an all-time high of $2.21 with its fourth consecutive day of gains. As the meme coin enters price-discovery mode, the 1.272 Fibonacci retracement level at $3.07, drawn from the January 19 peak at $1.80 to the March 11 low of $0.25, acts as an overhead target.
The MACD avoids crossing below its signal line with renewed green histogram bars rising from the zero line, suggesting refreshed bullish momentum.
The RSI at 71 enters the overbought zone, suggesting increasing buying pressure. However, the RSI remains flat NEAR the overbought line while SPX makes new peaks, indicating a hidden bearish divergence. Investors may consider this a sign of subsiding buying pressure, which could result in an abrupt end to the SPX rally.
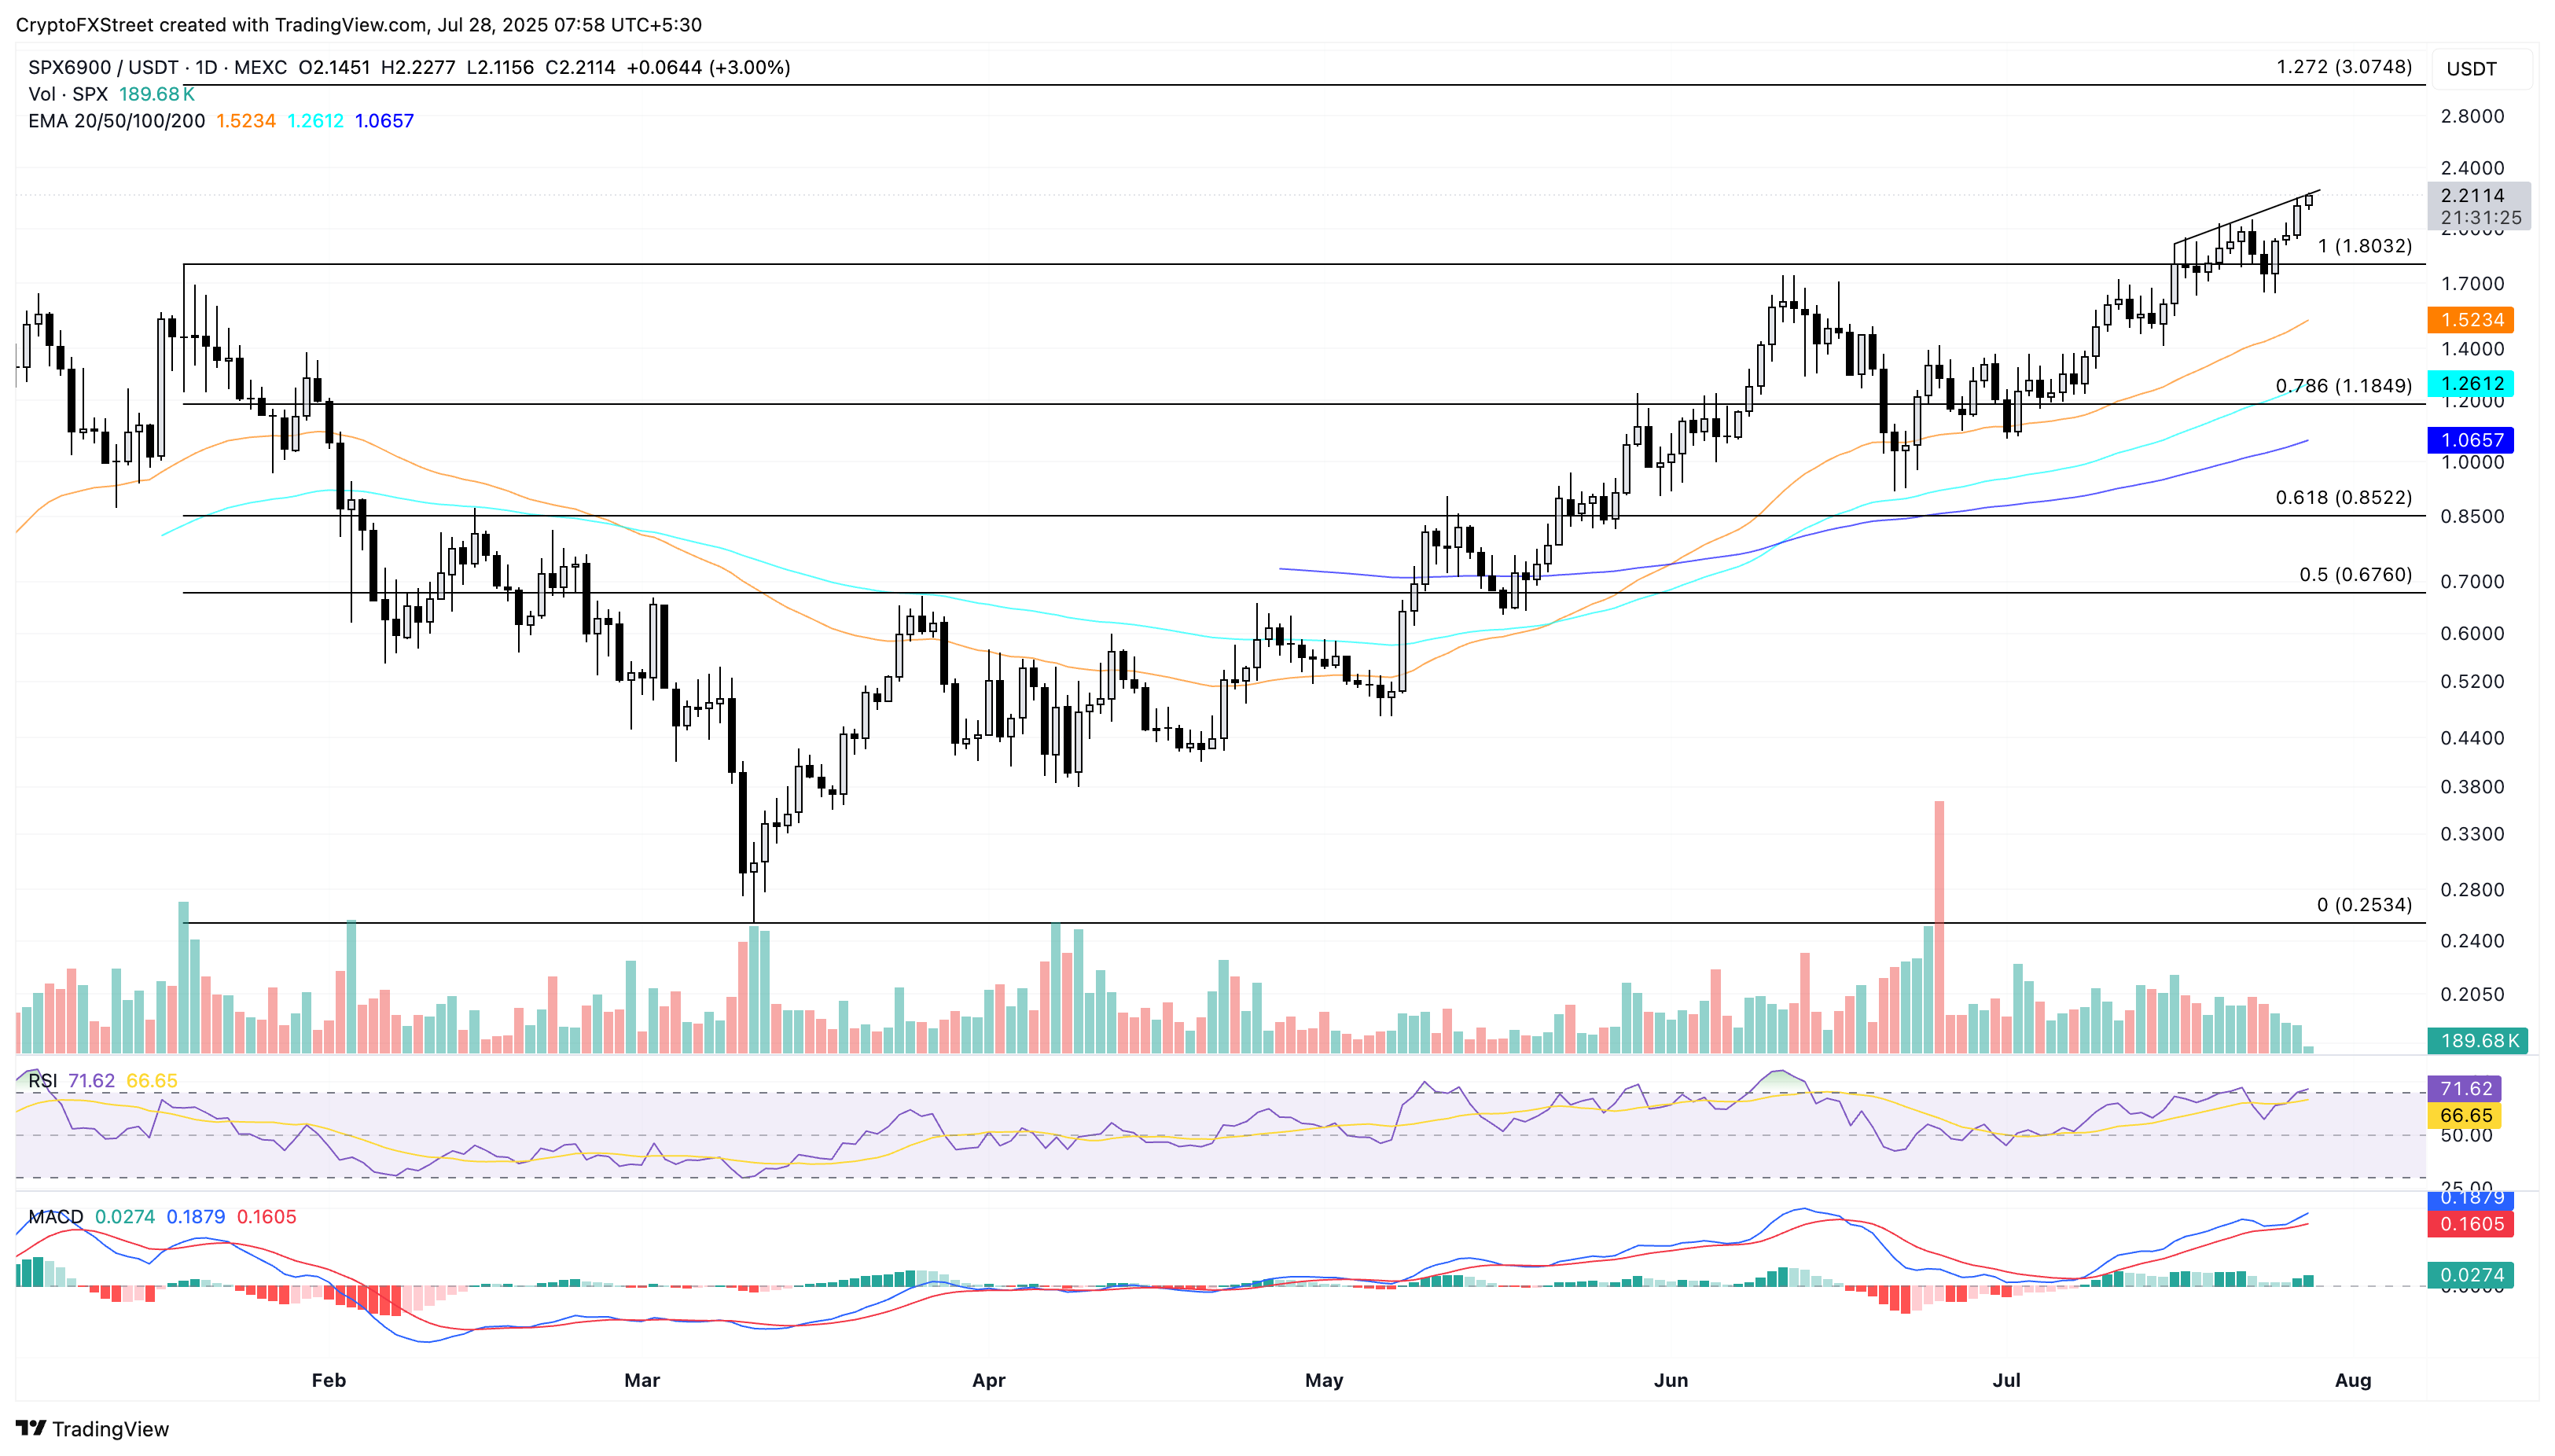
SPX/USDT daily price chart.
In such a case, a downfall below the $1.80 level could extend the decline to test the 50-day EMA at $1.52.
