Ethereum (ETH/USD) Elliott Wave Analysis: The Rally You Can’t Ignore From the Equal Legs Zone

Ethereum's price action is screaming opportunity—if you know where to look. The ETH/USD pair is carving out a textbook Elliott Wave pattern, and the equal legs zone is where the magic happens.
Here's why traders are loading up.
### The Setup: Symmetry Meets Momentum
Wave theorists spotted the equal legs formation weeks ago—a rare alignment where corrective waves mirror each other in price and time. Now, ETH's breaking out with the kind of momentum that leaves shorts sweating.
### The Target: Beyond Just Round Numbers
This isn't about lazy "moon" calls. The measured move projects a rally that could rewrite July's price history—assuming Wall Street's algo dogs don't front-run retail (again).
### The Trade: Ride the Wave or Miss Out
Active traders are already positioned for the next leg up. Passive holders? They'll likely buy the top—as usual.
Ethereum's playing chess while shitcoins play checkers. Place your bets.
ETH/USD Elliott Wave one-hour chart 07.23.2025
ETH/USD is currently doing wave ((iv)) black pull back. The correction appears incomplete at this stage. We anticipate further short-term weakness toward the Equal Legs area at 3,526.6-3,377.2. In that zone, we expect buyers to emerge and initiate another rally toward new highs. Therefore, we recommend avoiding short positions within this area.

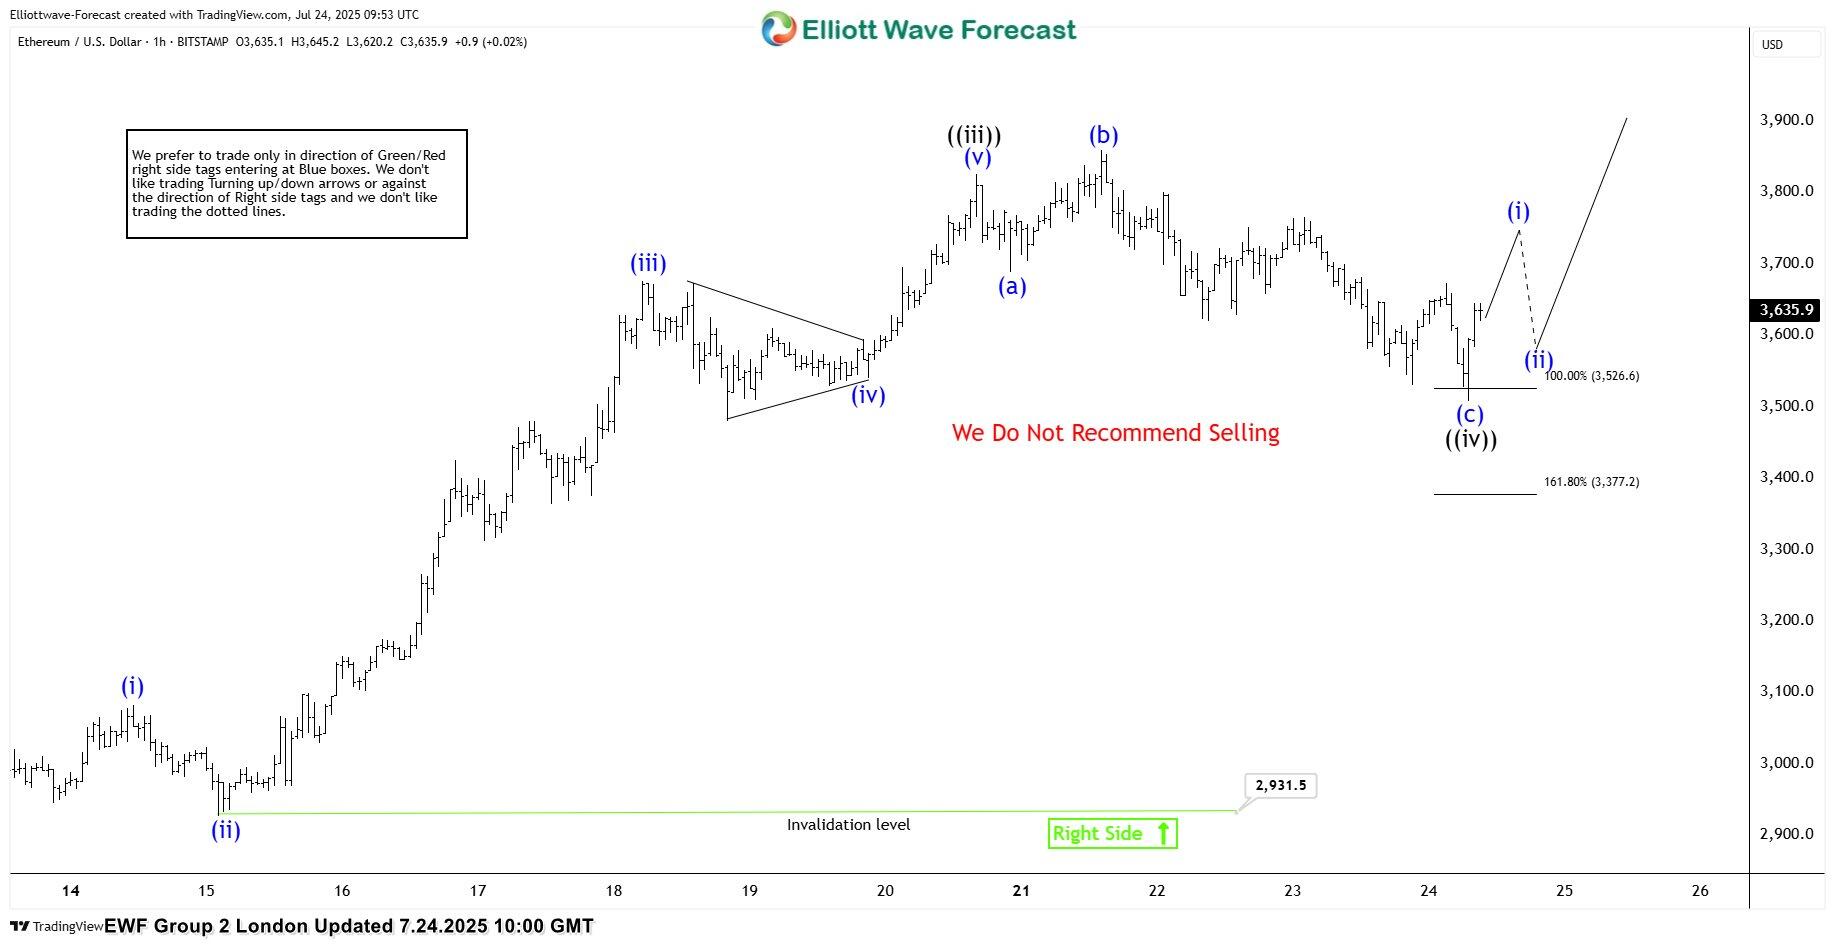
ETH/USD Elliott Wave one-hour chart 07.24.2025
The price extended downward into the marked equal legs area, where ETHUSD found buyers as expected and has already shown a reaction. At this stage, we count the pullback as wave ((iv)), completed at the 3,510 low. As long as price remains above that level, we are likely in wave ((v)), targeting the 3,943–4,077 zone. Alternatively, if the 3,510 low is broken before a new high is made, we’ll likely see a deeper pullback. In that case, we’ll measure a new equal‑legs zone to identify the next buying area.

Log in to Reply
Log in to comment your thoughtsComments
Related Articles
|Square
Get the BTCC app to start your crypto journey
Get started today Scan to join our 100M+ users