Altseason Stumble: PUMP, FARTCOIN, PENGU Plunge 10%+ as Crypto Bulls Hit the Snooze Button

Memecoins and altcoins face brutal reckoning as risk appetite evaporates
The party's over—for now. After weeks of speculative frenzy, altcoin traders woke up to double-digit bloodbaths across fringe assets. Market darlings PUMP, FARTCOIN, and PENGU all cratered over 10% as Bitcoin dominance crept upward.
Where's the 'hedge against inflation' narrative now?
Technical indicators scream caution. The altcoin market cap sliced through key support levels like a hot knife through... well, whatever substance FARTCOIN promises to disrupt. Trading volumes dried up faster than a DeFi project's treasury reserves.
Silver lining? This flushout vaporizes weak hands—the same 'investors' who think dog-themed tokens constitute a retirement strategy. The real builders keep coding through the noise.
Watch for relief bounces, but remember: in crypto winter, even the most 'utility-driven' projects freeze first. (Spoiler: most have zero utility.)
PUMP extends the bearish trend, eyes further decline
PUMP edges lower by 5% at press time on Friday, extending a clear downtrend in the 4-hour price chart. The meme coin launchpad token dropped under the $0.003000 round figure on Thursday, suggesting increased selling pressure.
PUMP’s bearish turnaround from $0.006882 inches closer to the S1 pivot level at $0.002366. A decisive close below this level could extend the decline to $0.002084 level.
The Relative Strength Index (RSI) reads 25 on the 4-hour chart, indicating increased selling pressure resulting in oversold conditions. Sidelined investors must remain cautious, as oversold conditions could signal a potential bounce back.

PUMP/USDT daily price chart.
To reinforce an uptrend, PUMP must surpass the $0.003000 level, which could drive the uptrend to the R2 pivot level at $0.003542.
FARTCOIN’s bullish failure risks testing the $1.00 mark
Fartcoin has appreciated by over 1% so far on Friday, following the 21% decline in the last two days. The meme coin failed to hold an uptrend above the 78.6% Fibonacci level at $1.56, retracing from $2.74 on January 19 to $0.19 on March 10.
Fartcoin inches closer to the 50-day Exponential Moving Average (EMA) at $1.24. A clean push below the dynamic support could test the 61.8% Fibonacci level at $1.00.
The RSI reads 50 on the daily chart, indicating a neutral phase, while the drop from the overbought boundary to the midline suggests a significant decrease in buying pressure.
The Moving Average Convergence Divergence (MACD) crosses below its signal line, indicating a trend reversal. A surge in red histogram bars WOULD indicate an increase in selling pressure.
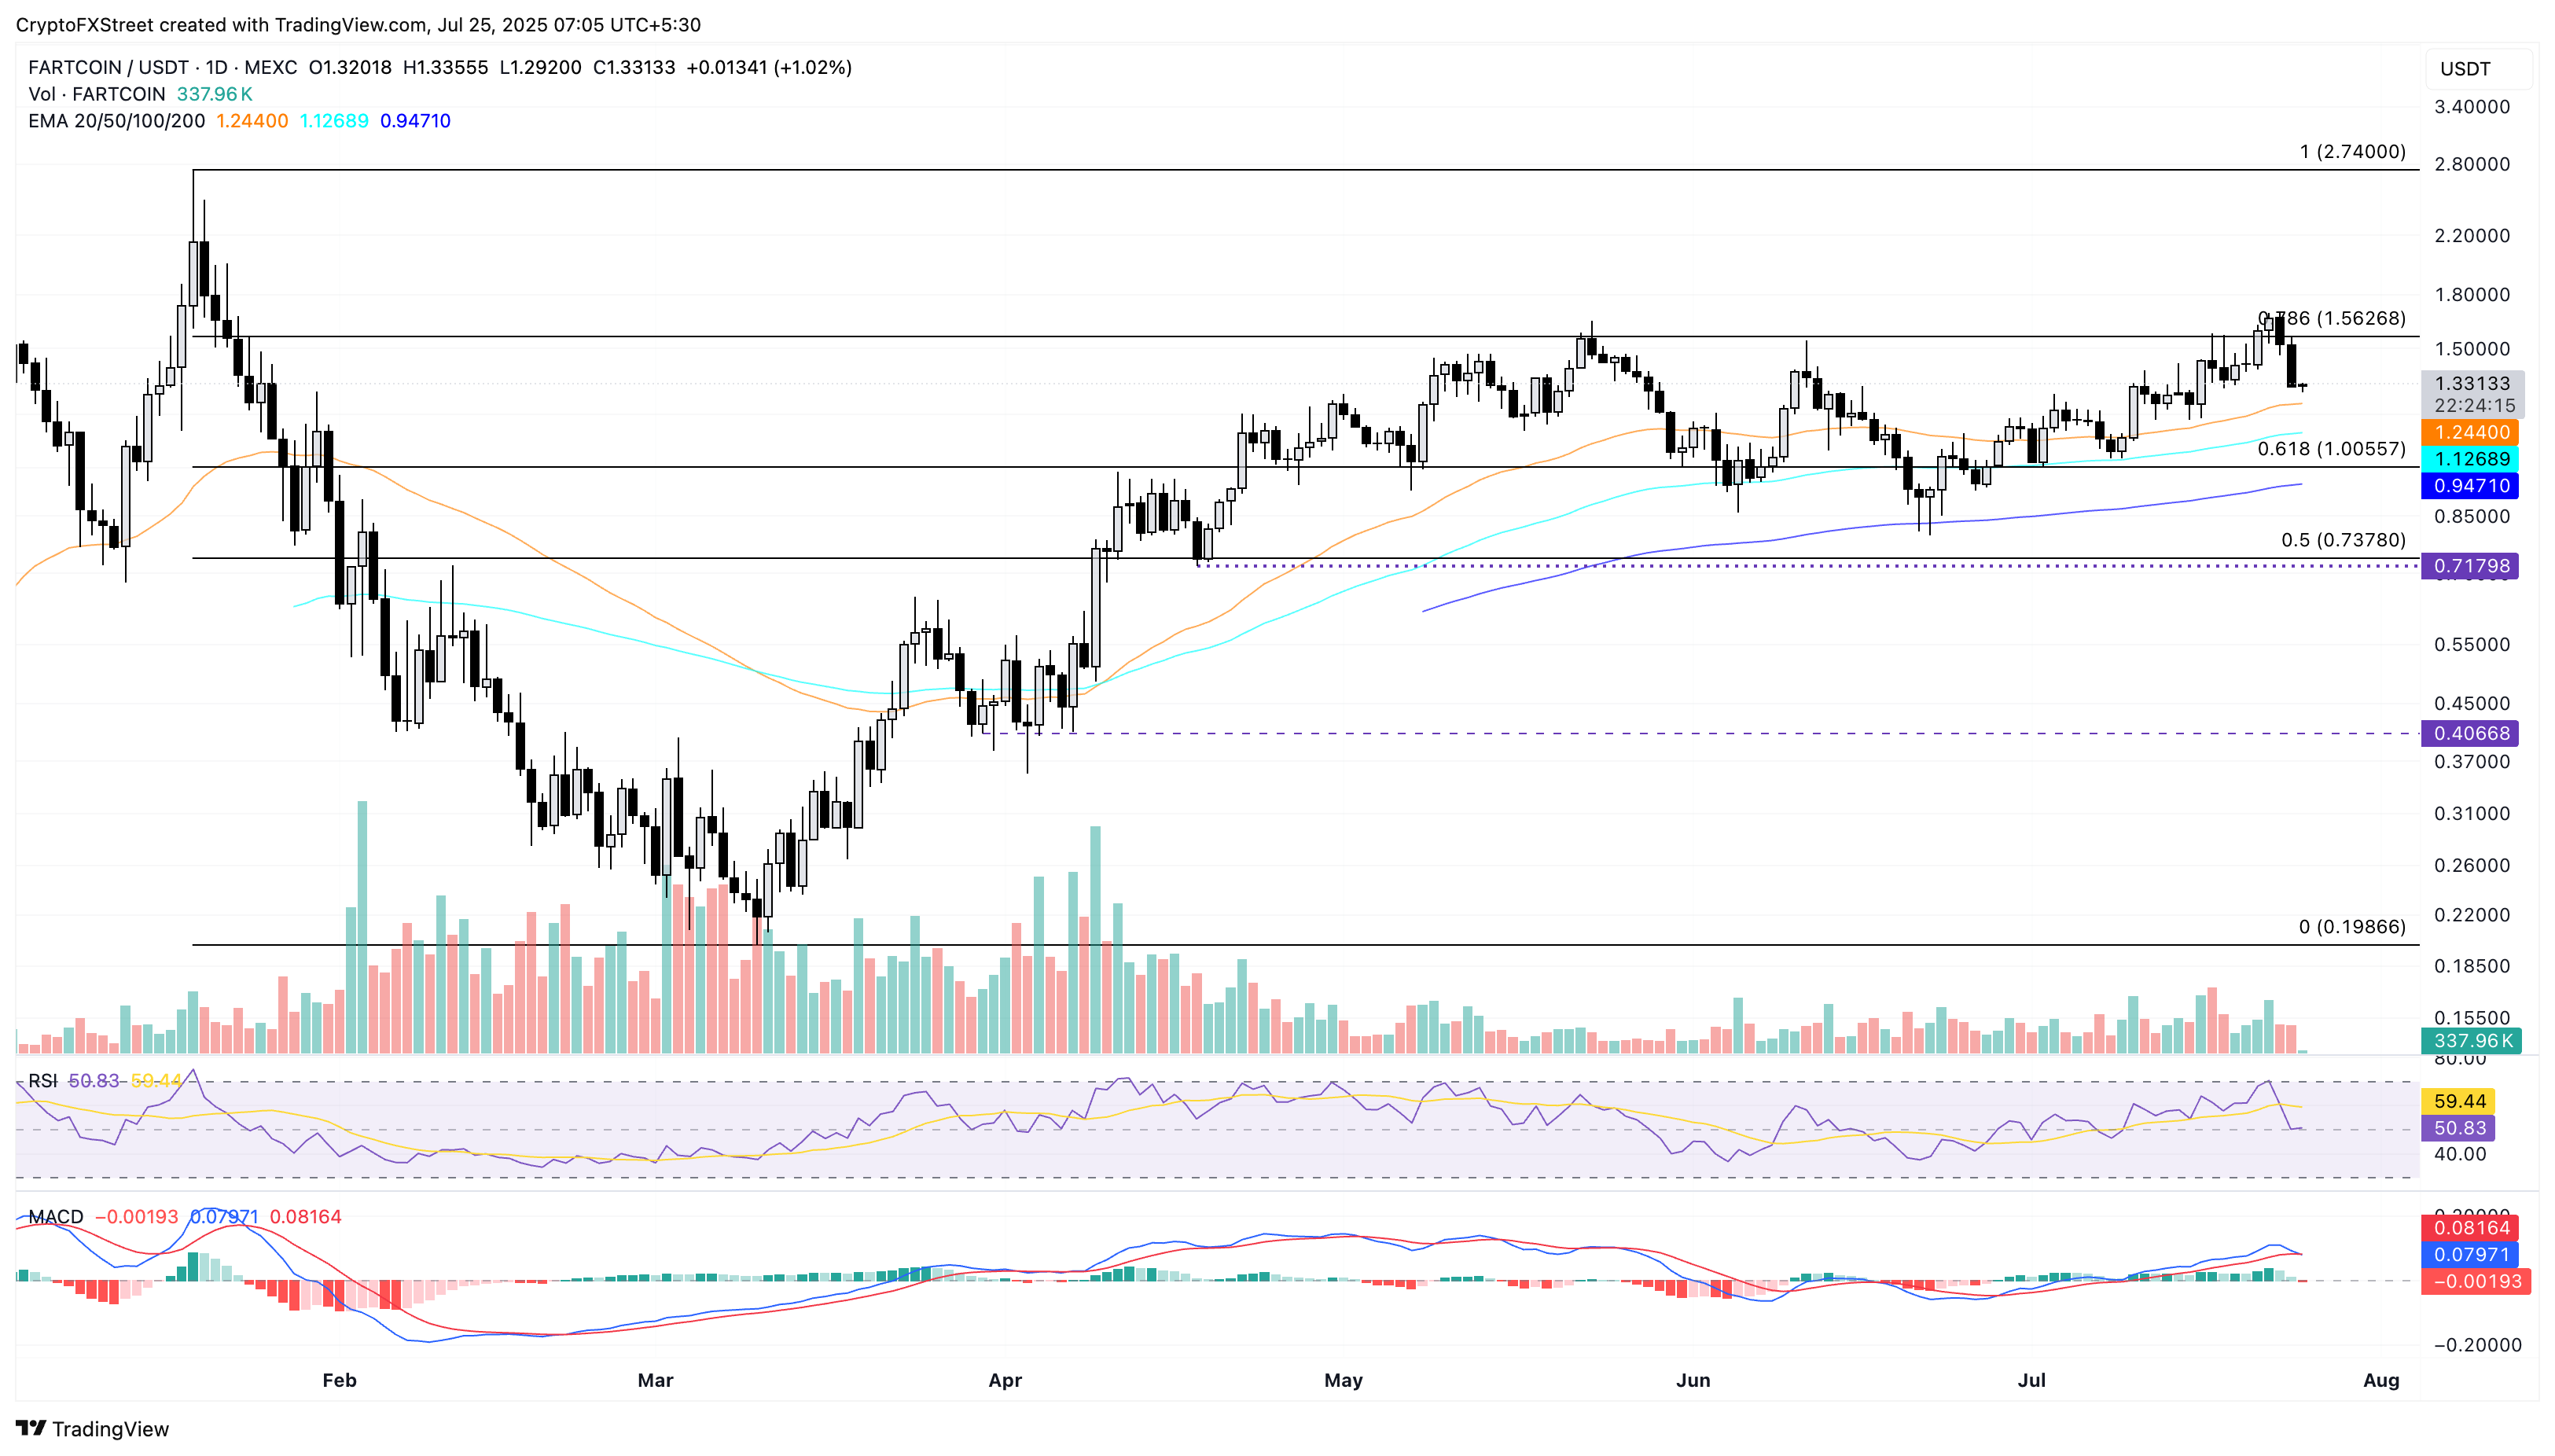
FARTCOIN/USDT daily price chart.
If the broader market recovers, the meme coin could retest the $1.56 resistance level.
PENGU risks further losses as bullish momentum fades
PENGU edges lower by 1% at the time of writing on Friday, following the 12% drop on Thursday that completed an evening star pattern. The sudden reversal in PENGU is slipping under the 78.6% Fibonacci level at $0.03731, drawn from $0.070000 on December 17 to $0.00370 on April 9.
A decisive close below this level could result in further losses for PENGU, potentially testing the 61.8% Fibonacci level at $0.02277.
The technical indicators signal a sudden shift in momentum as the RSI declines to 68 on the daily chart, from the overbought zone, indicating decreased buying pressure. Meanwhile, the MACD indicator displays declining bullish momentum, as the green histogram bars lose intensity.
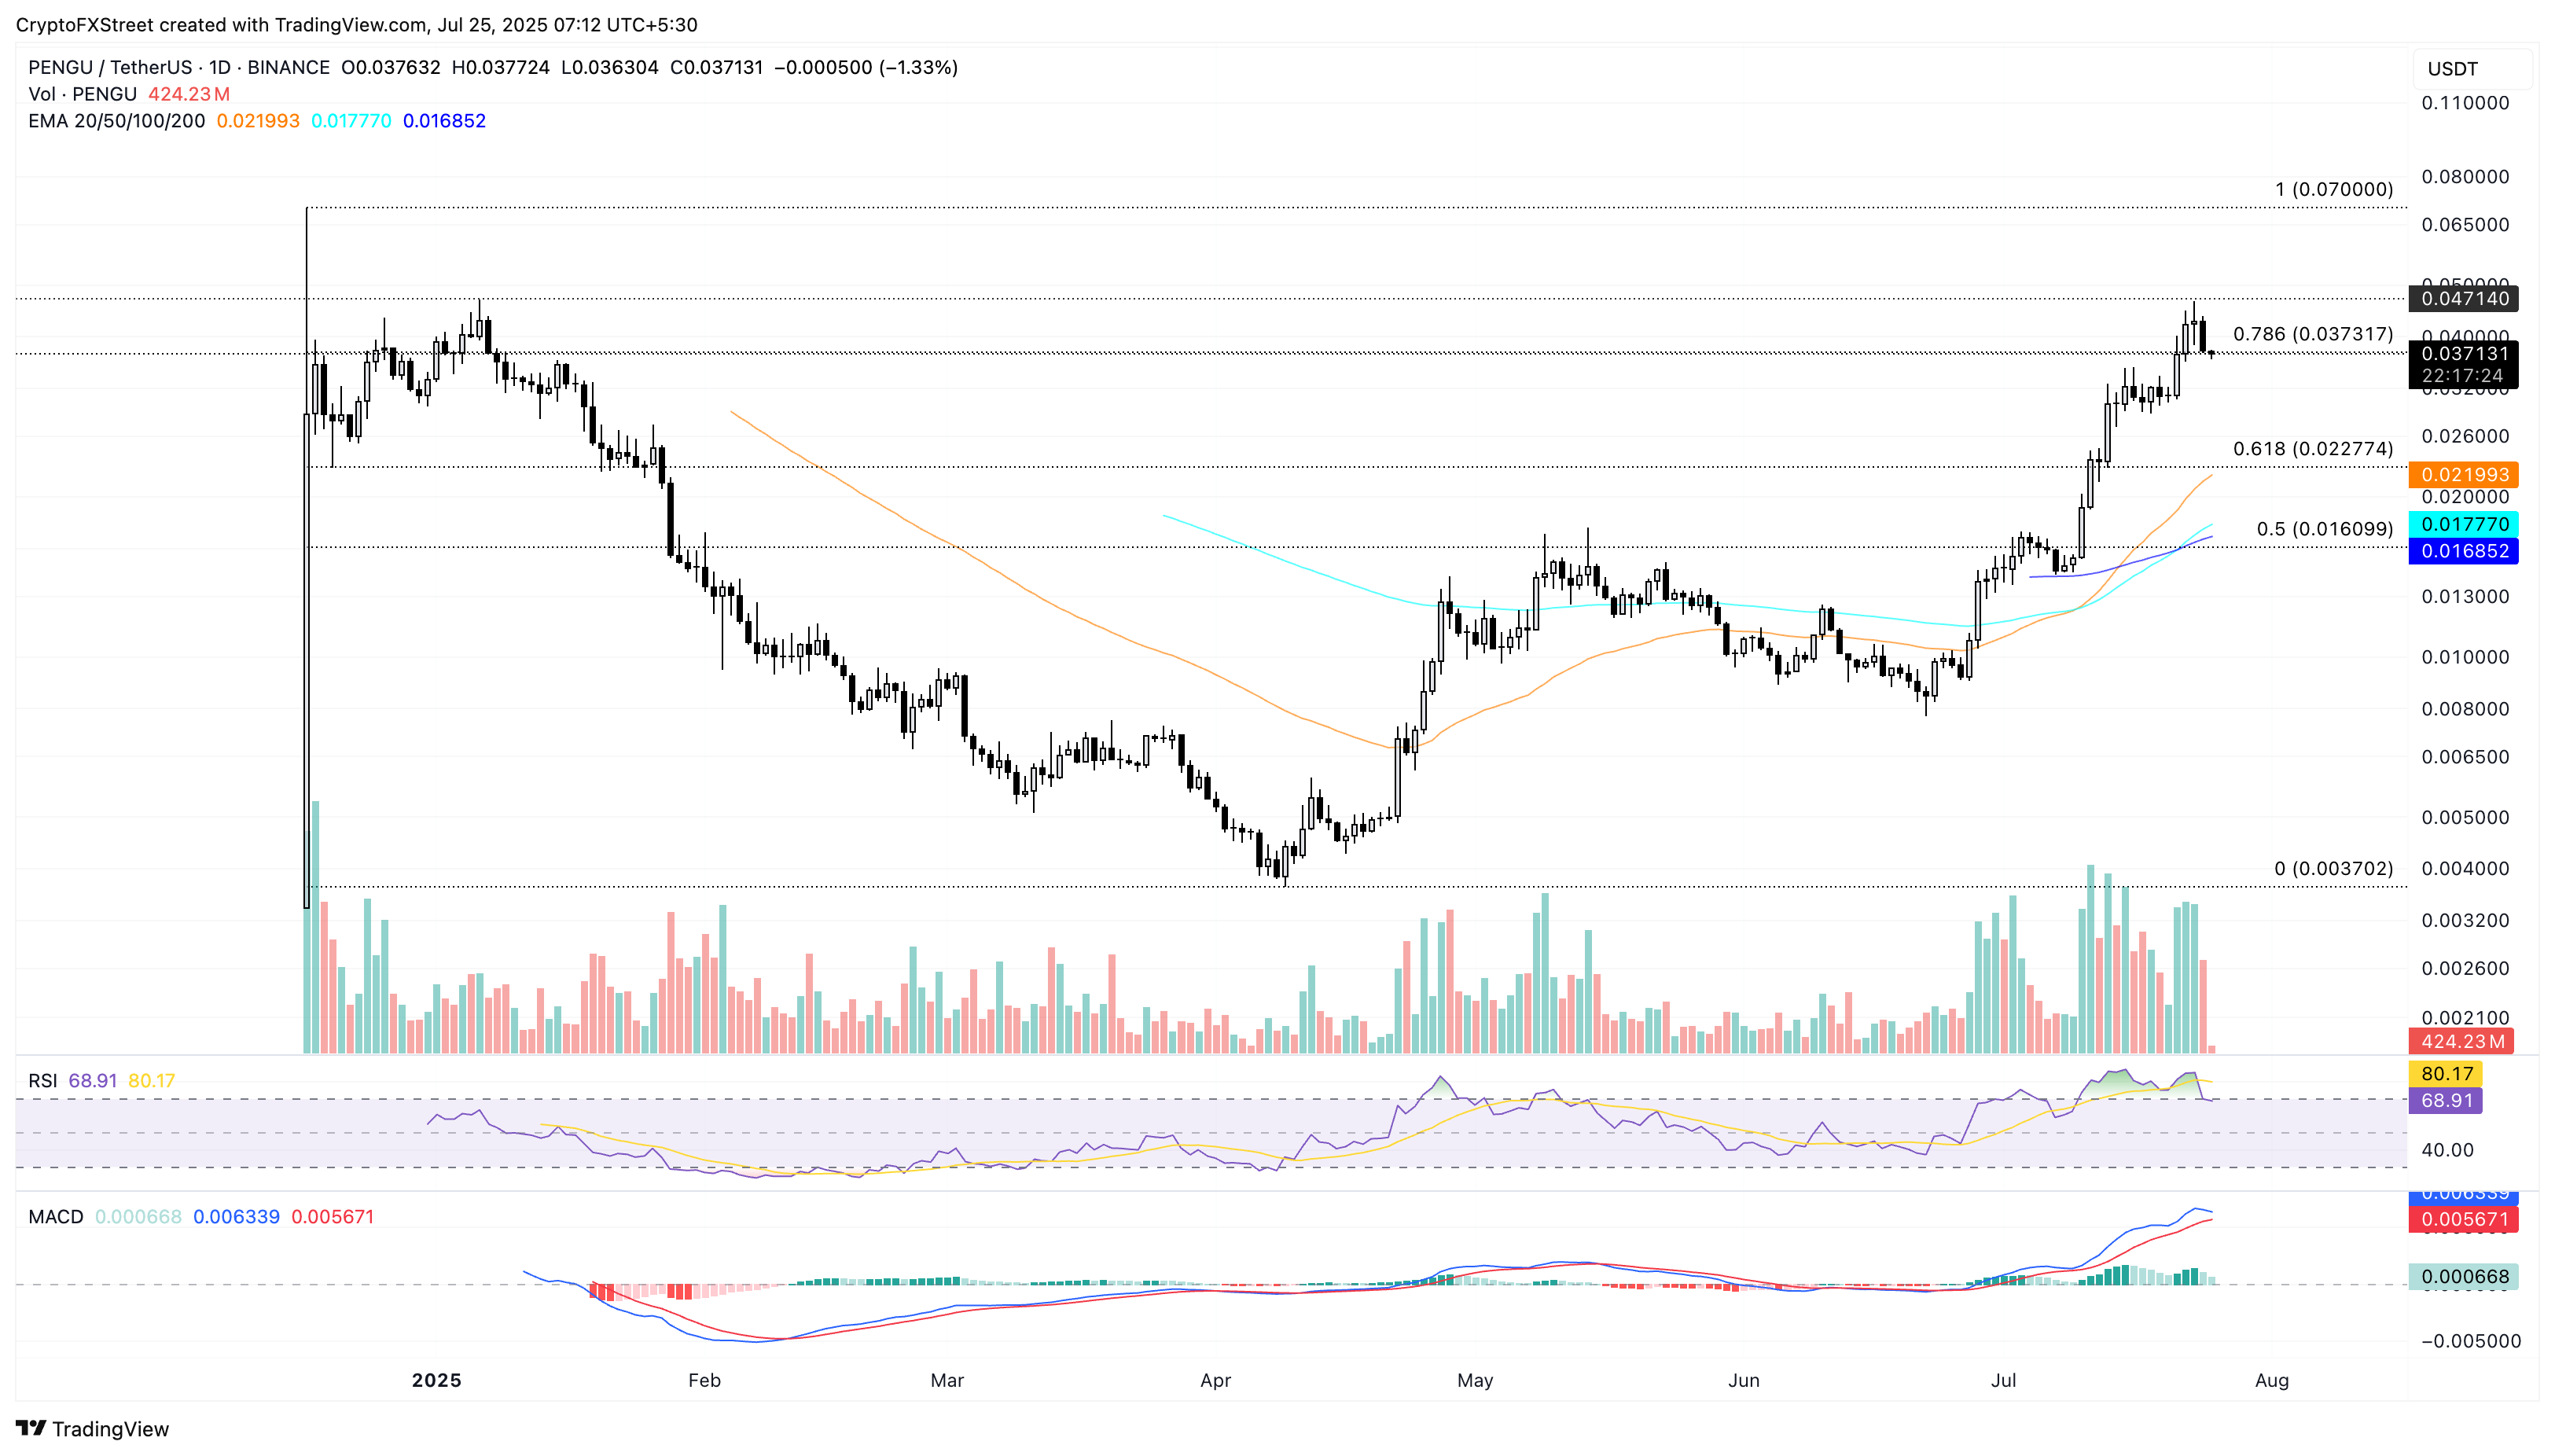
PENGU/USDT daily price chart.
A bounce back from the $0.03731 could test the weekly high of $0.04660.
