BNB Soars to New ATH, Overtakes Solana in Market Cap Dominance

BNB just flipped the script—and Solana's market cap—with a blistering new all-time high. The Binance Smart Chain heavyweight is now punching above its weight class, leaving 'Ethereum killers' in the rearview.
How high can it go? While TradFi analysts scramble to justify the rally (blaming 'speculative frenzy,' naturally), the charts tell a different story: relentless demand, shrinking supply, and a ecosystem that keeps eating competitors' lunch.
One thing's clear: in the race for layer-1 supremacy, BNB isn't asking for permission—it's taking ground. And the crypto old guard? Too busy shorting their own bags to notice.
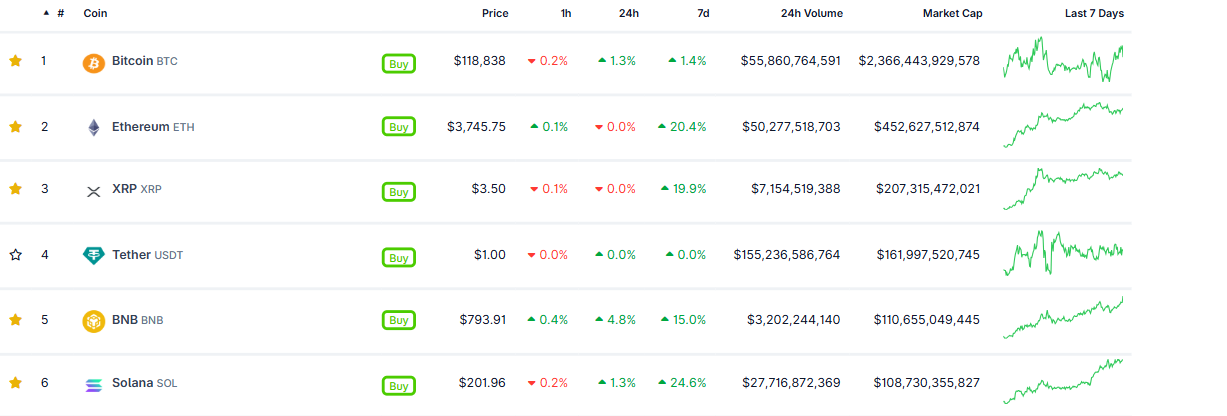
BNB market capitalization surpasses $110 billion, open interest surges
BNB soared more than 15% in the last seven days and hit a new all-time high of $804.70 during the Asian trading session on Wednesday. CoinGecko data shows that BNB’s market capitalization has surged above $110 billion, taking the fifth spot in the overall crypto market and surpassing Solana.
Still, when examining its derivatives data, the outlook for BNB suggests further rally ahead. CoinGlass’ data shows that the futures’ OI in BNB at exchanges rises to a new yearly high of $1.23 billion on Wednesday from $1.05 billion on Monday, reaching levels not seen since early December. Rising OI represents new or additional money entering the market and new buying, which could fuel the current BNB price rally.
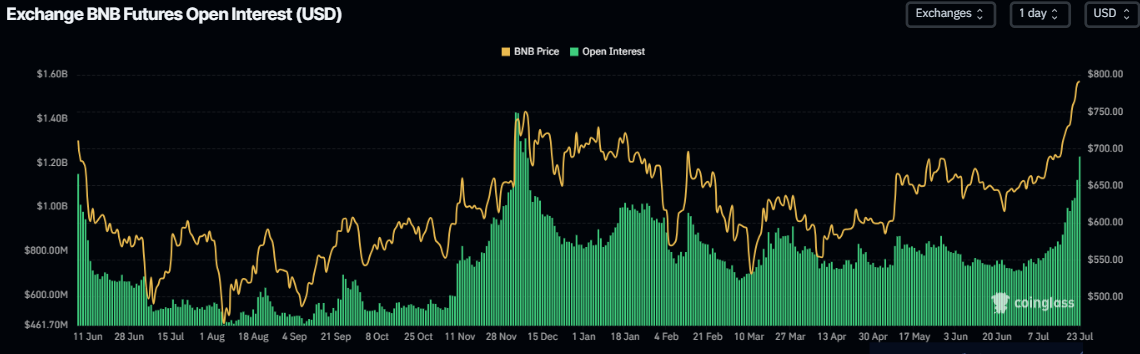
BNB Open Interest chart. Source: CoinGlass
Another aspect bolstering the BNB’s bullish outlook is a positive spike in funding rate data. The metric, as shown in The Graph below, has flipped to a positive rate and exhibits a massive spike, reading 0.023% on Wednesday, indicating that longs are paying shorts. Historically, when funding rates have experienced a significant positive spike, the price of BNB has rallied sharply.
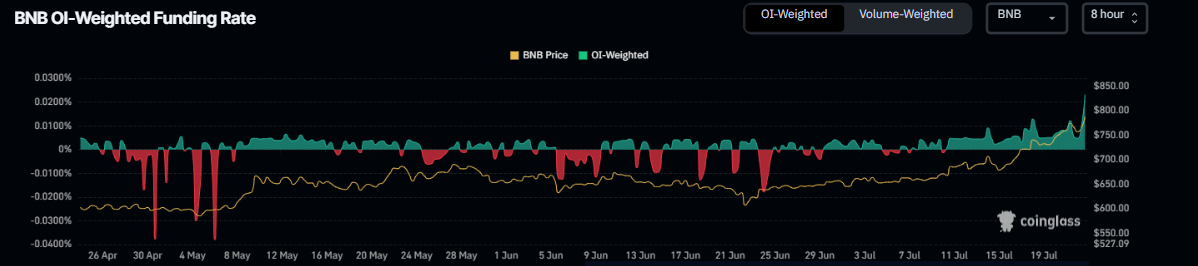
BNB funding rate chart. Source: Coinglass
BNB Price Forecast: Bulls aiming for $900 mark
BNB price has rallied by more than 9% and closed at its highest weekly level to date at $756.82 last week. It has continued its rally so far this week, surpassing the previous all-time high of $793.86 on December 4 and reaching a record level of $804.70 as of Wednesday.
If BNB continues its upward trend, it could extend the rally to test its psychological level of $900.
However, traders should be cautious as the Relative Strength Index (RSI) indicator on the daily chart reads 87, indicating an extreme overbought condition. Meanwhile, the Moving Average Convergence Divergence (MACD) indicator on the daily chart showed a bullish crossover in early July, which remains in effect. The rising green histogram bars above its neutral zero line also indicate that bullish momentum is gaining traction.
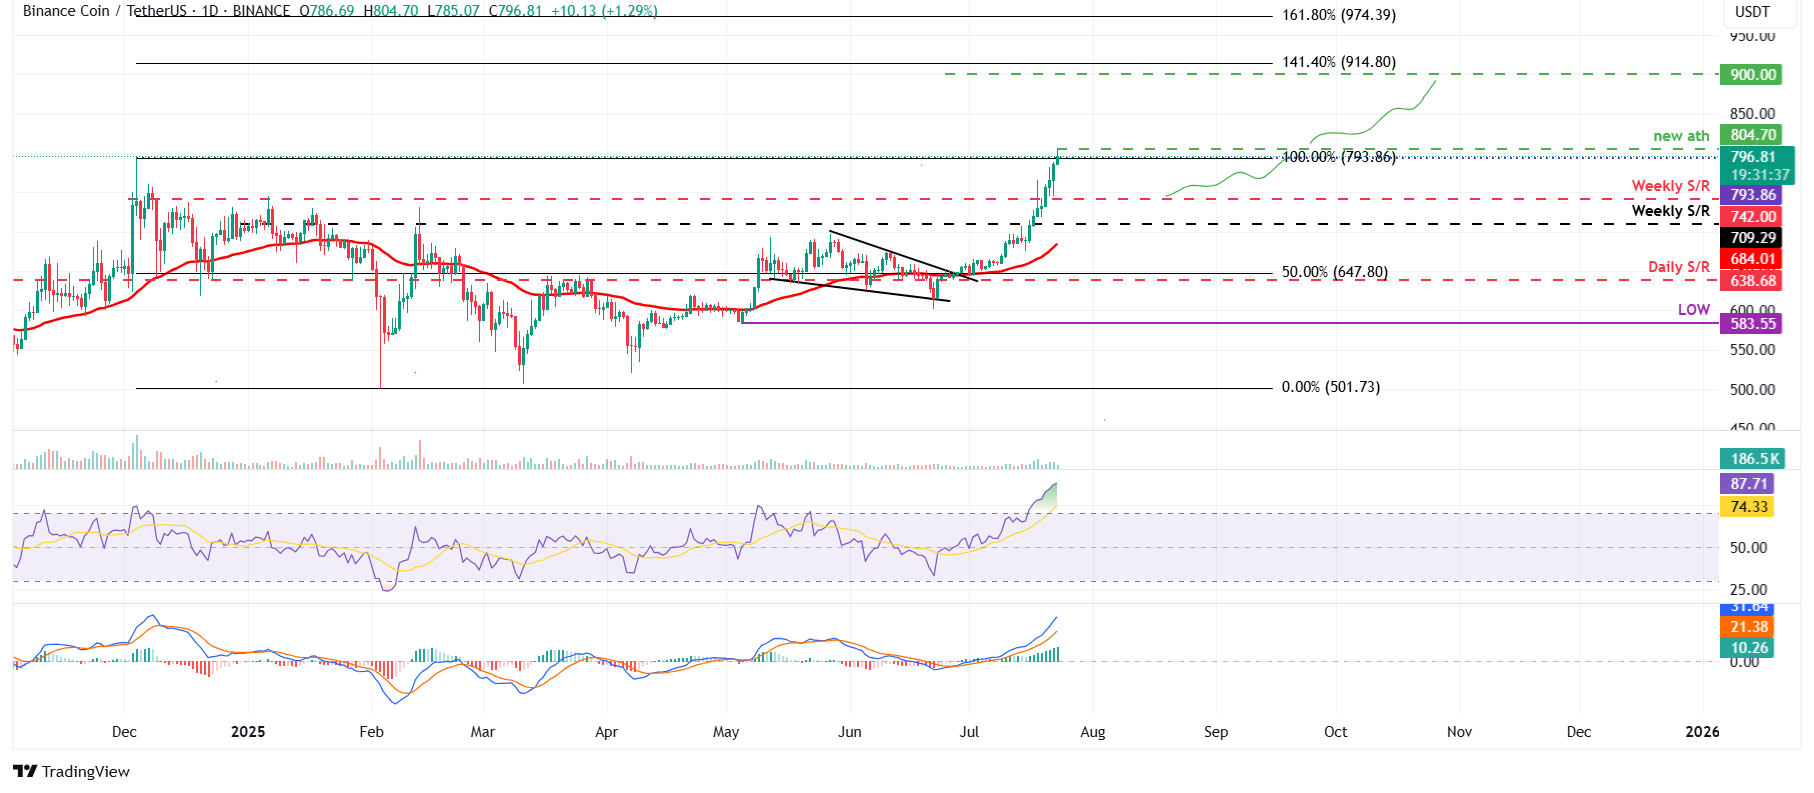
BNB/USDT daily chart
If BNB faces a pullback, it could extend the decline toward its weekly support at $742.

Log in to Reply
Log in to comment your thoughtsComments
Related Articles
|Square
Get the BTCC app to start your crypto journey
Get started today Scan to join our 100M+ users