🚀 FLR, PENGU, WLD Lead Crypto Charge as Altcoins Hit 8-Month Highs

Altcoins are roaring back—and these three tokens are stealing the spotlight.
The surge nobody saw coming
While Wall Street analysts were busy downgrading FAANG stocks, FLR, PENGU, and WLD quietly posted double-digit gains. The altcoin market just clocked its highest close since November 2024—proving once again that crypto moves faster than institutional spreadsheets.
What's fueling the rally?
Speculation? Sure. Short squeezes? Probably. But also genuine protocol upgrades and that classic crypto FOMO. FLR's governance overhaul went live last week, while WLD's AI integration rumors sent traders into a frenzy. As for PENGU... well, sometimes memes just win.
The cynical take
Bankers will call this 'irrational exuberance' right up until their clients demand exposure. By then, the real gains will be gone—just like your 0.5% 'high-yield' savings account.
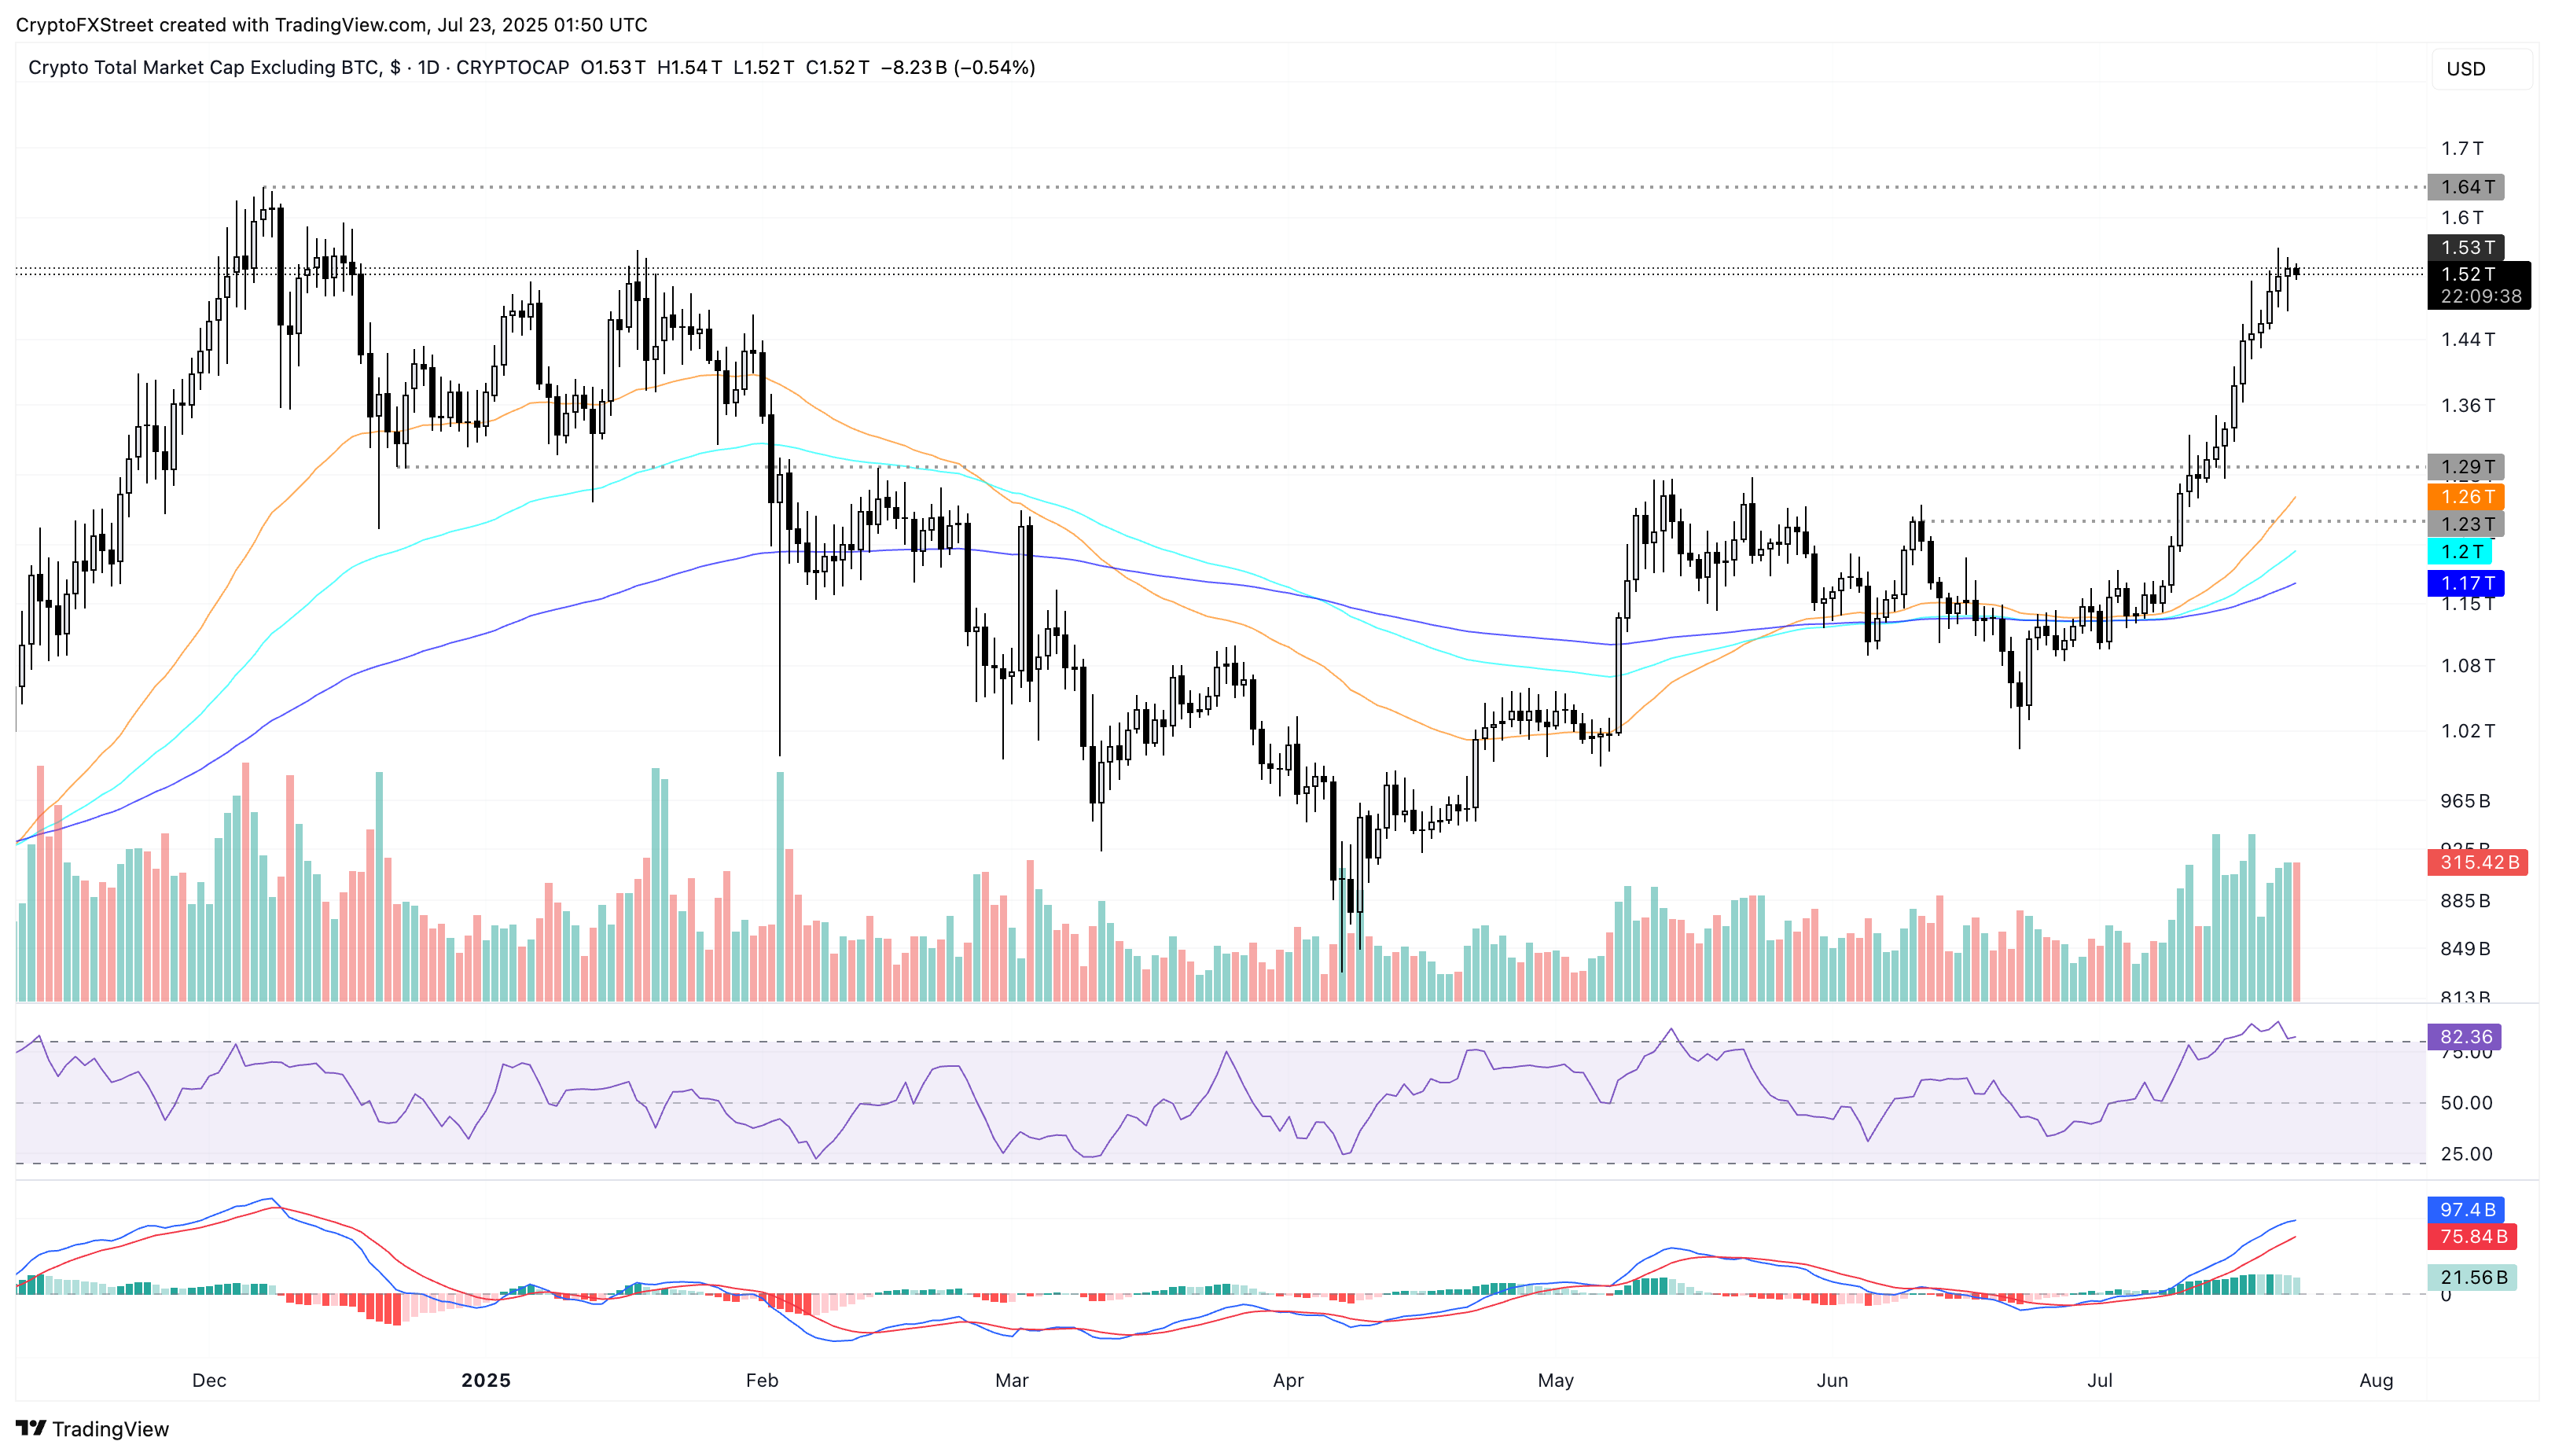
Total crypto market cap, excluding Bitcoin, daily price chart.
As altcoins heat up, Flare (FLR), Pudgy Penguins (PENGU), and Worldcoin (WLD) post double-digit gains over the last 24 hours, outpacing the broader cryptocurrency market.
Flare aims to surpass the 50% level at $0.02458
Flare edges higher by 4% at press time on Wednesday, extending the nearly 15% gains from the previous day. The uptrend challenges the 50% level at $0.02458, which is drawn from the $0.03827 peak on December 3 to the $0.01088 low on April 7.
If bullish momentum holds, a decisive close above this level could boost FLR to the $0.02851 level, last tested on January 30.
The 50-day Exponential Moving Average (EMA) is on the verge of crossing above the 200-day EMA, potentially signaling a Golden Cross. Investors could consider this a buy signal as the short-term surge outpaces the longer-term trend.
The Moving Average Convergence/Divergence (MACD) indicates a surge in bullish momentum, as evidenced by rising green histogram bars above the zero line.
The Relative Strength Index (RSI) reads 90 on the daily chart, indicating increased buying pressure that has led to an overbought condition.
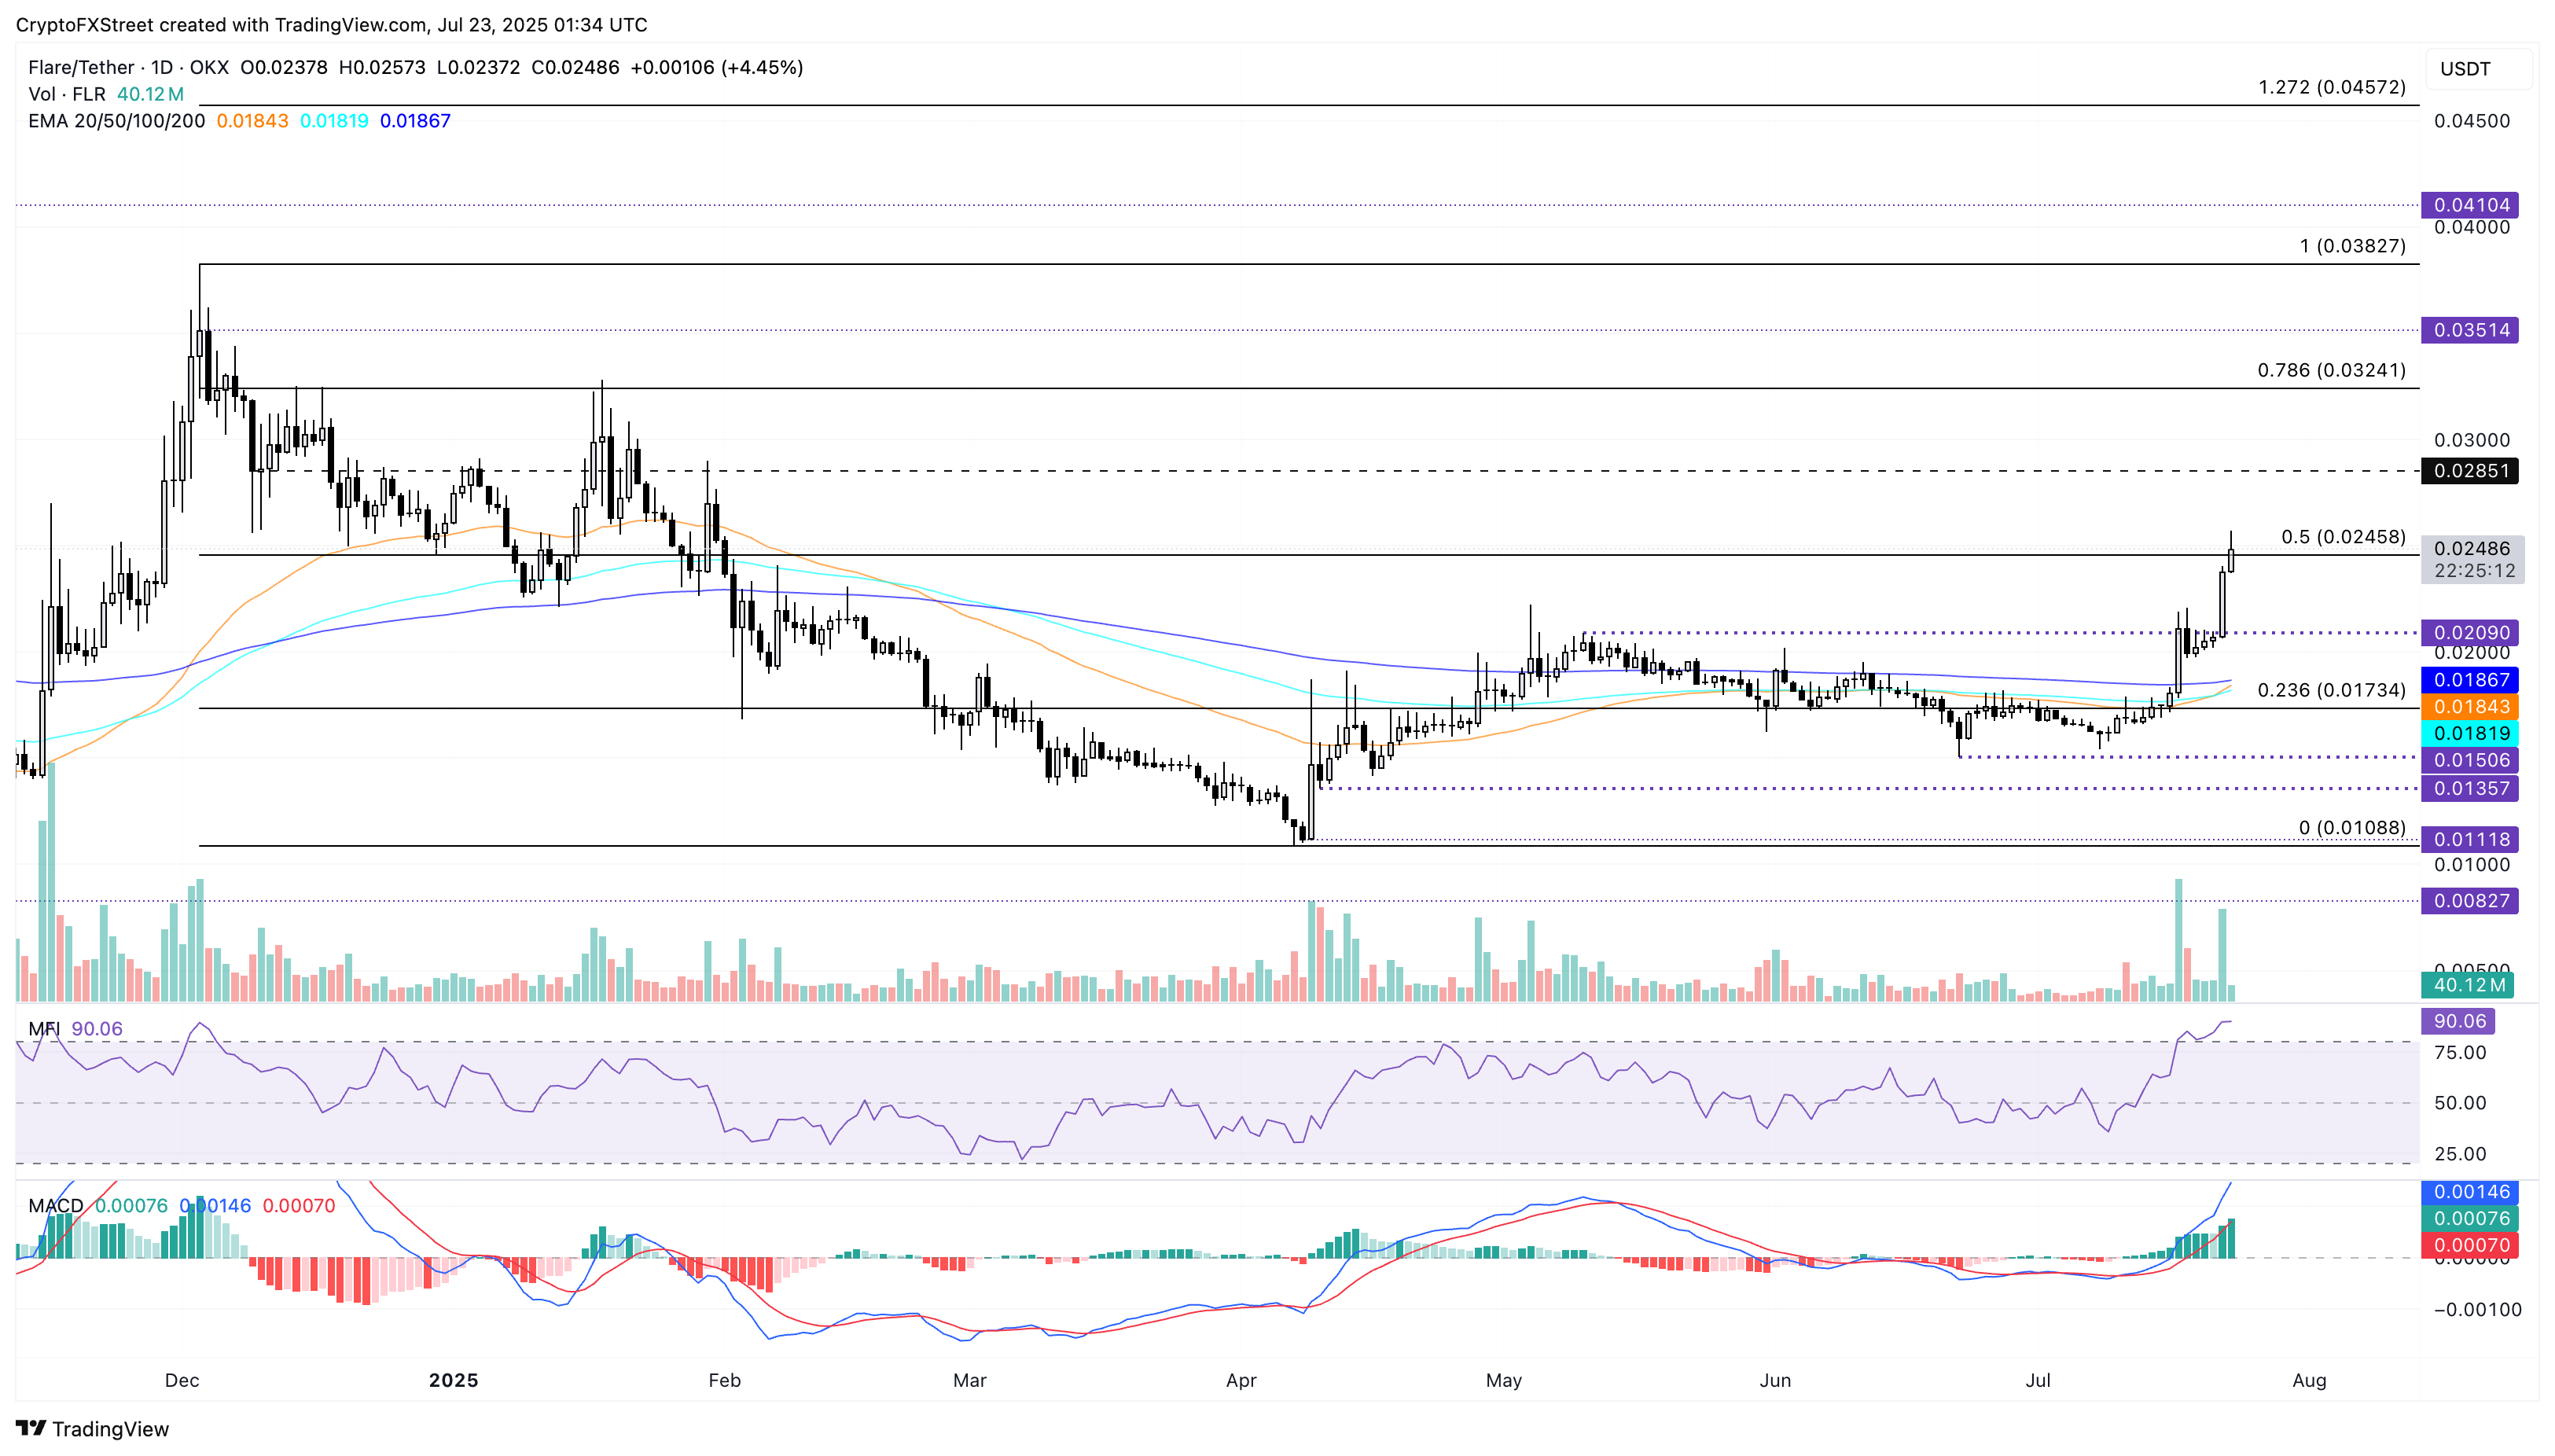
FLR/USDT daily price chart.
On the downside, if FLR fails to maintain a daily close above $0.02458, the declining trend could retest the $0.02090 support level, erasing the gains made on Tuesday.
Pudgy Penguins sustain the bullish run, targeting $0.07000
Pudgy Penguins maintain a bullish trend with the third consecutive positive candle so far this week, accounting for an over 45% rise. The uptrend inches closer to the $0.05000 psychological level as it exceeds the 78.6% retracement level at $0.03731, drawn from $0.07000 on December 17 to $0.00370 on April 9.
A decisive close above the $0.05000 level could extend the bullish trend to the $0.07000 peak.
The Golden Cross, followed by a crossover between the 100-day and 200-day EMAs, suggests a bullish trend is in motion.
The MACD indicator, with rising green histogram bars, and the RSI at 90 (indicating overbought conditions) on the daily chart, suggest continuous growth in bullish momentum.
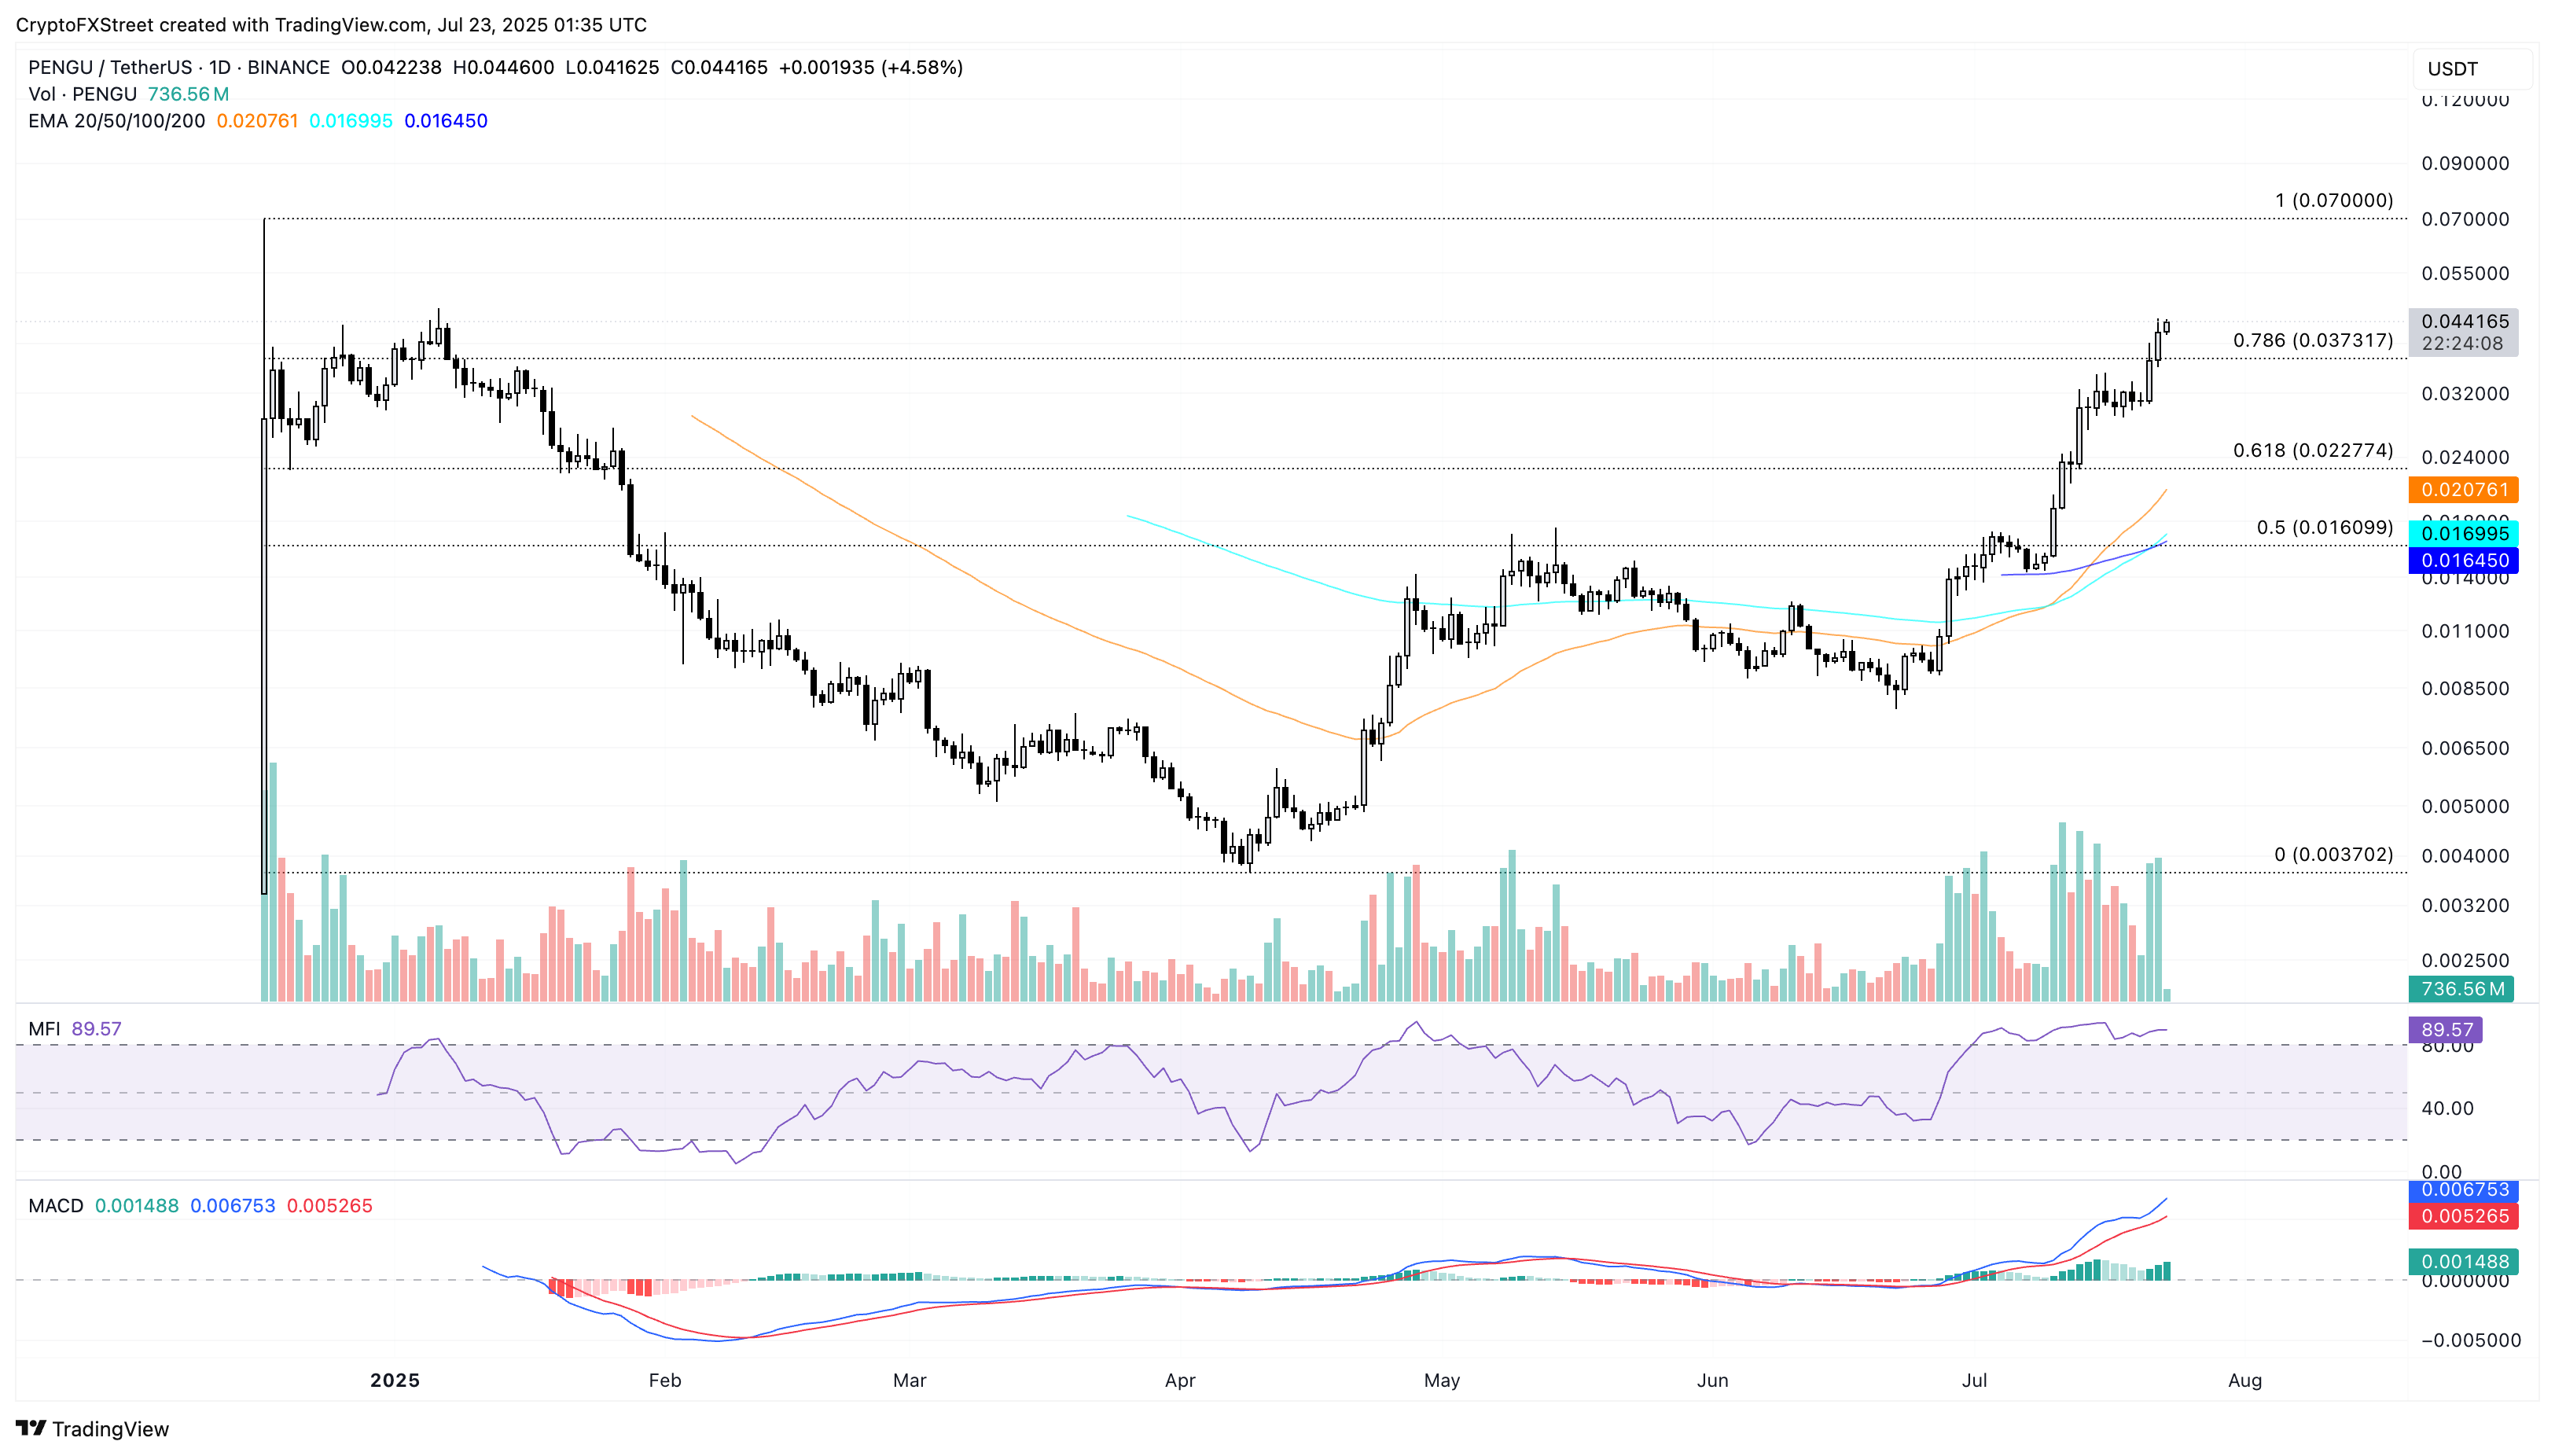
PENGU/USDT daily price chart.
On the downside, a reversal in PENGU could retest the 78.6% Fibonacci level at $0.03731.
Worldcoin reversal run holds above the 200-day EMA
Worldcoin ticks lower by 3% at press time on Wednesday, following a nearly 13% surge on Tuesday. WLD holds above the 200-day EMA at $1.28 and the 38.2% Fibonacci level at $1.22, drawn from $4.19 on December 6 to $0.57 on April 7.
The uptrend targets the 50% retracement level at $1.55, last tested on May 23. A decisive close above this level WOULD mark the highest close since February 1, potentially extending the uptrend to $1.96, aligning with the 61.8% level.
The 50-day and 100-day EMAs are on the verge of a crossover, signaling that short-term recovery is outpacing the medium-term trend.
The MACD and its signal line maintain an uptrend, with the RSI at 78, approaching the overbought boundary, suggesting extended recovery amid heightened bullish momentum.
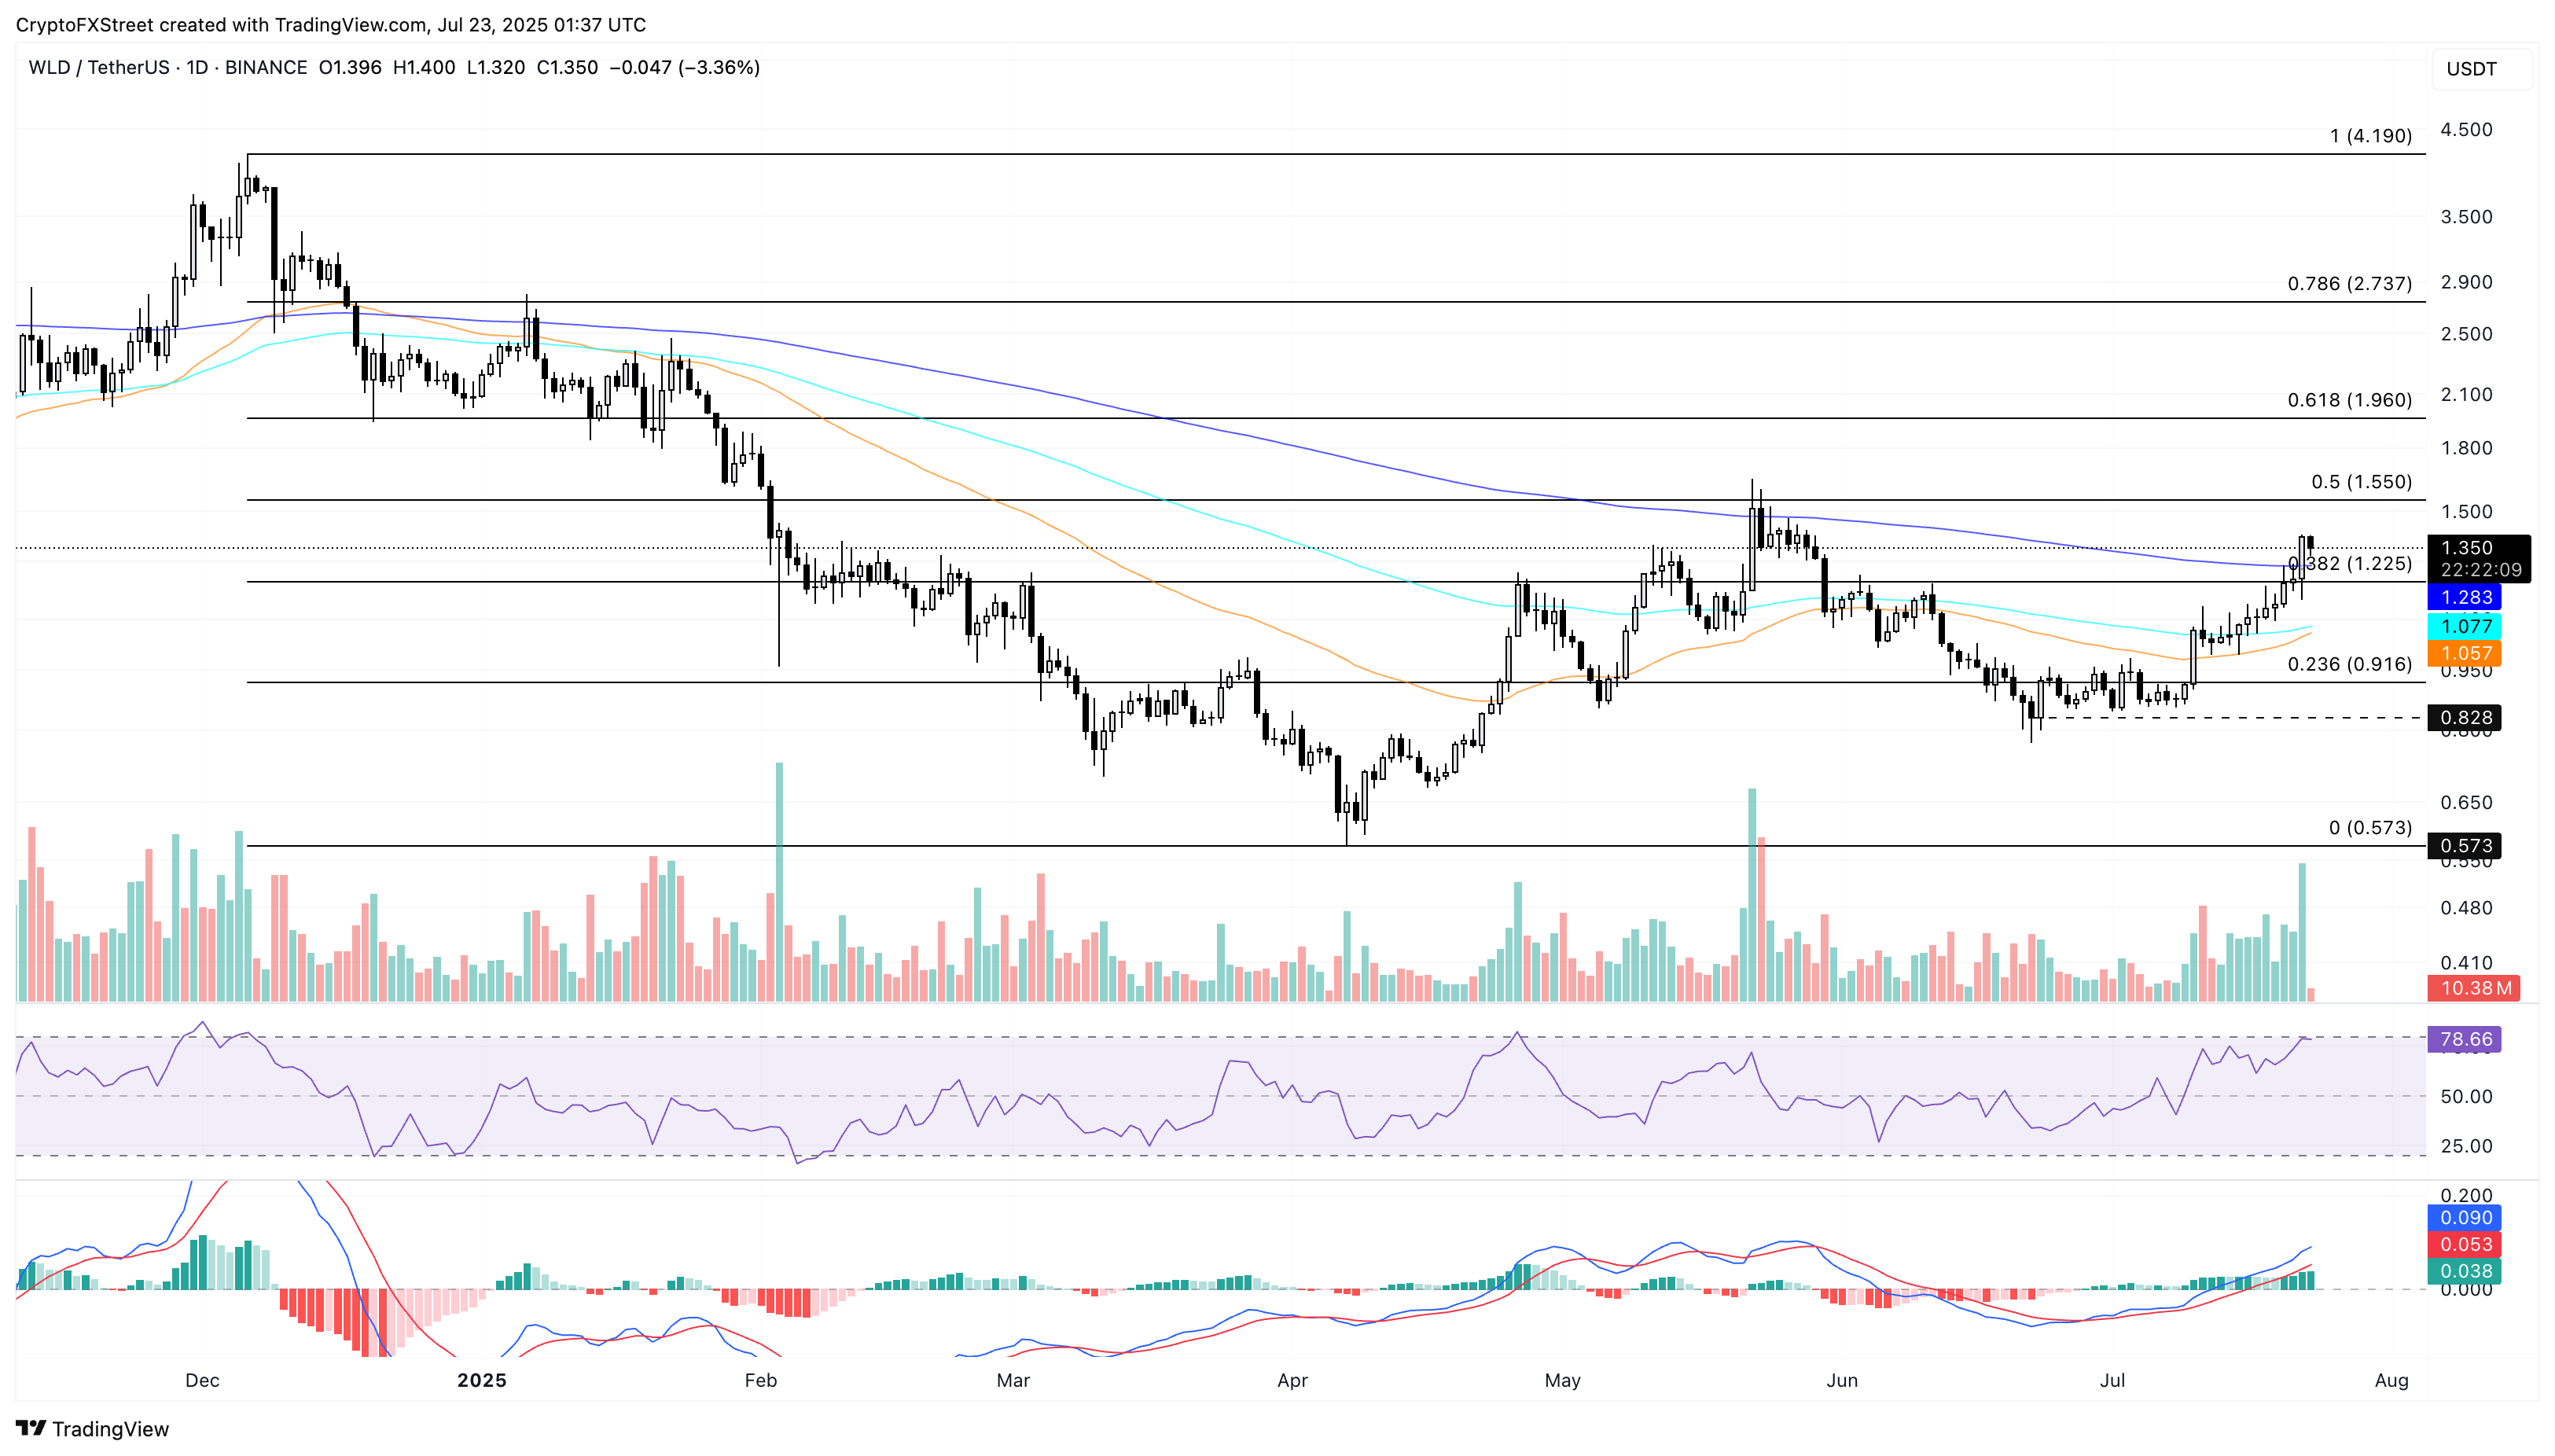
WLD/USDT daily price chart.
However, if WLD falls below the 200-day EMA at $1.28, it could retest the 38.2% Fibonacci level at $1.22, followed by the 100-day EMA at $1.07.

Log in to Reply
Log in to comment your thoughtsComments
Related Articles
|Square
Get the BTCC app to start your crypto journey
Get started today Scan to join our 100M+ users