Mantle (MNT) Primed for Breakout: 200-Day EMA Resistance in the Crosshairs

Mantle's native token MNT is flashing bullish signals as it tests a critical technical threshold—the 200-day exponential moving average. A decisive breakout here could send traders scrambling for exposure.
The Technical Tightrope
All eyes are on whether MNT can sustain momentum above this key trend indicator—a line in the sand that separates hesitant accumulation from full-throttle FOMO. Market makers love these setups; retail wallets? Not so much.
The Bigger Picture
While TA purists geek out over EMA crossovers, the real story is Mantle's growing utility in DeFi's modular stack. Because nothing says 'adoption' like degens leveraging obscure indicators to justify their next trade.
Watch this space—if the 200-day EMA cracks, the resulting liquidity grab could make even Wall Street's quant jocks crack a smile. Briefly.
Rising MNT Open Interest signals heightened optimism
Open Interest (OI) of a cryptocurrency refers to the total value of active positions in the derivatives market. Typically, an increase in OI suggests heightened capital inflow, a sign of increased trading activities.
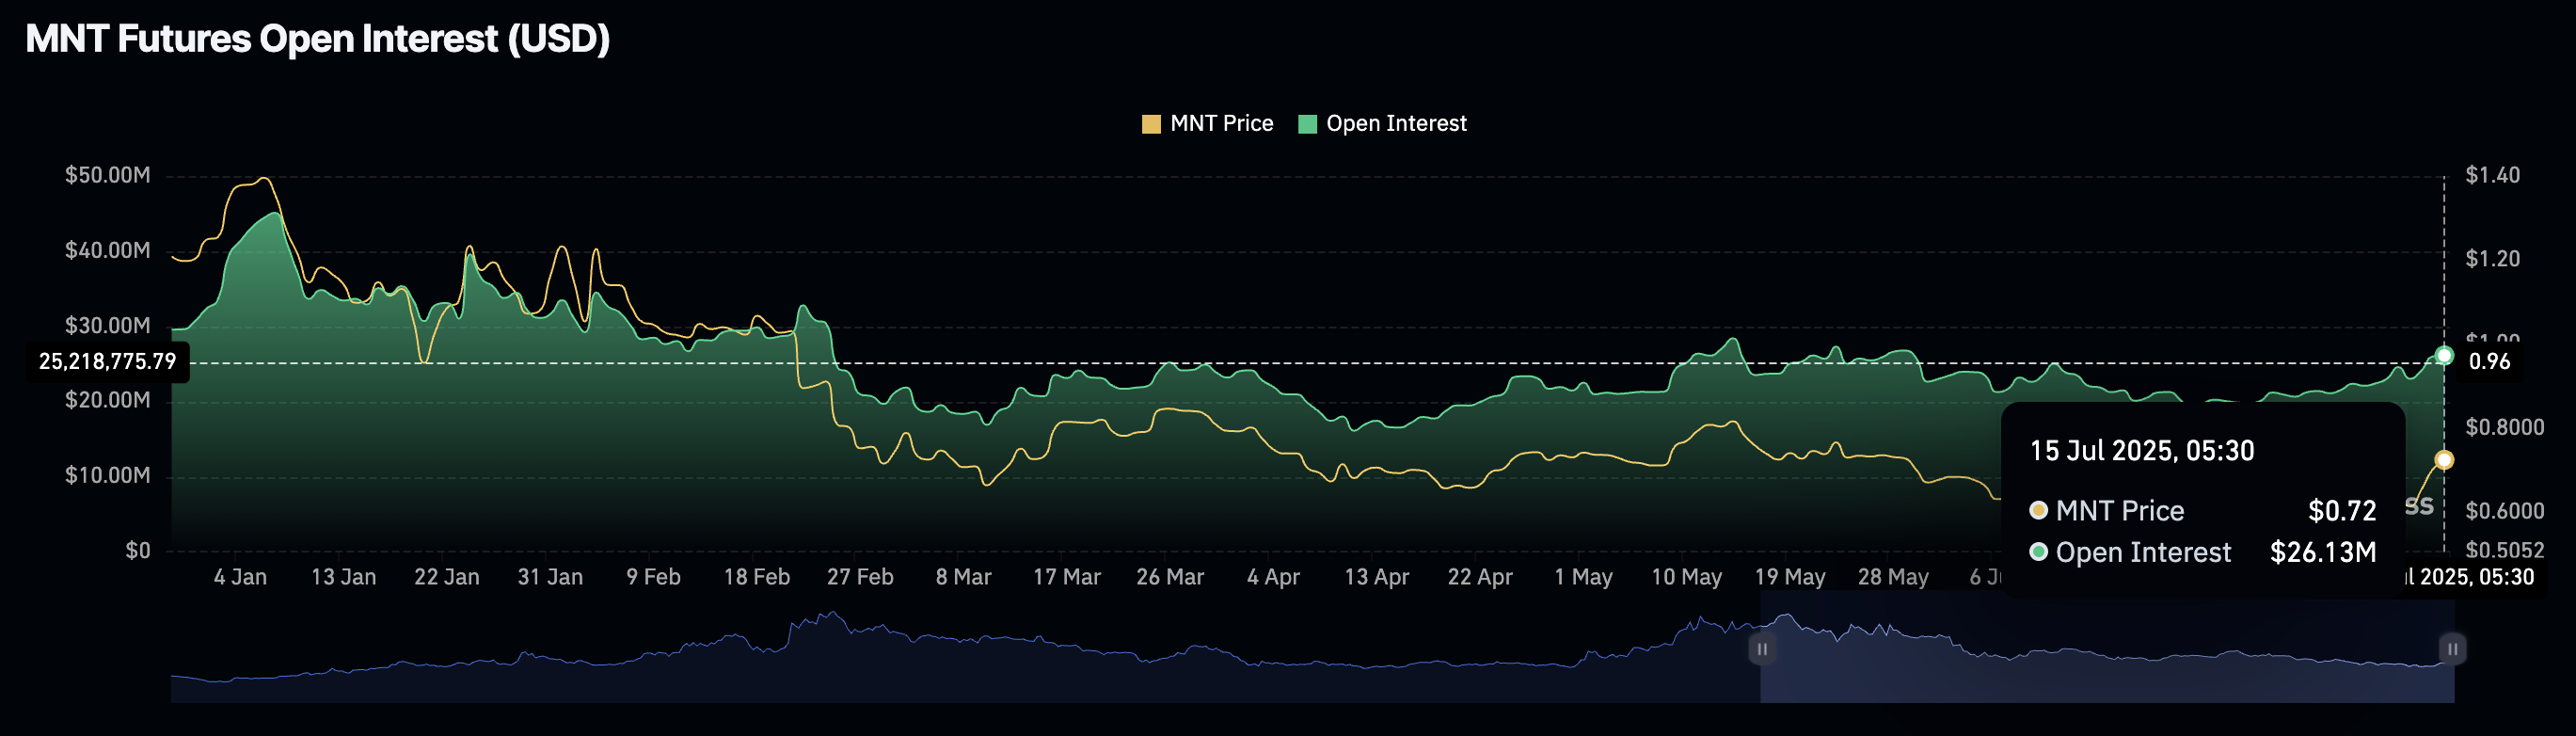
MNT Open Interest. Source: Coinglass
CoinGlass’ data shows an 18% rise in the MNT Open Interest of $21.63 million over the last week.
Bullish run in Mantle faces a crucial dynamic resistance
Mantle trades between the 100-day and 200-day EMAs at $0.6869 and $0.7485, respectively, while holding dominance above the 23.6% Fibonacci retracement level at $0.6903, drawn between the January 6 high at $1.4198 and the July 1 low at $0.5524.
Mantle’s falling wedge breakout rally, as shown on the daily chart below, aims to surpass the 200-day EMA. A decisive close above the dynamic resistance could extend the uptrend to the 50% Fibonacci level at $0.8856.
The Relative Strength Index (RSI) reads 69 on the daily chart, slightly below the overbought zone, suggesting increased buying pressure.
The Moving Average Convergence/Divergence (MACD) indicator displays a rising trend in the green histogram bars above the zero line, indicating increased bullish momentum. Further, the uptrend in the MACD and its signal line crossing into the positive territory suggests a trend reversal.
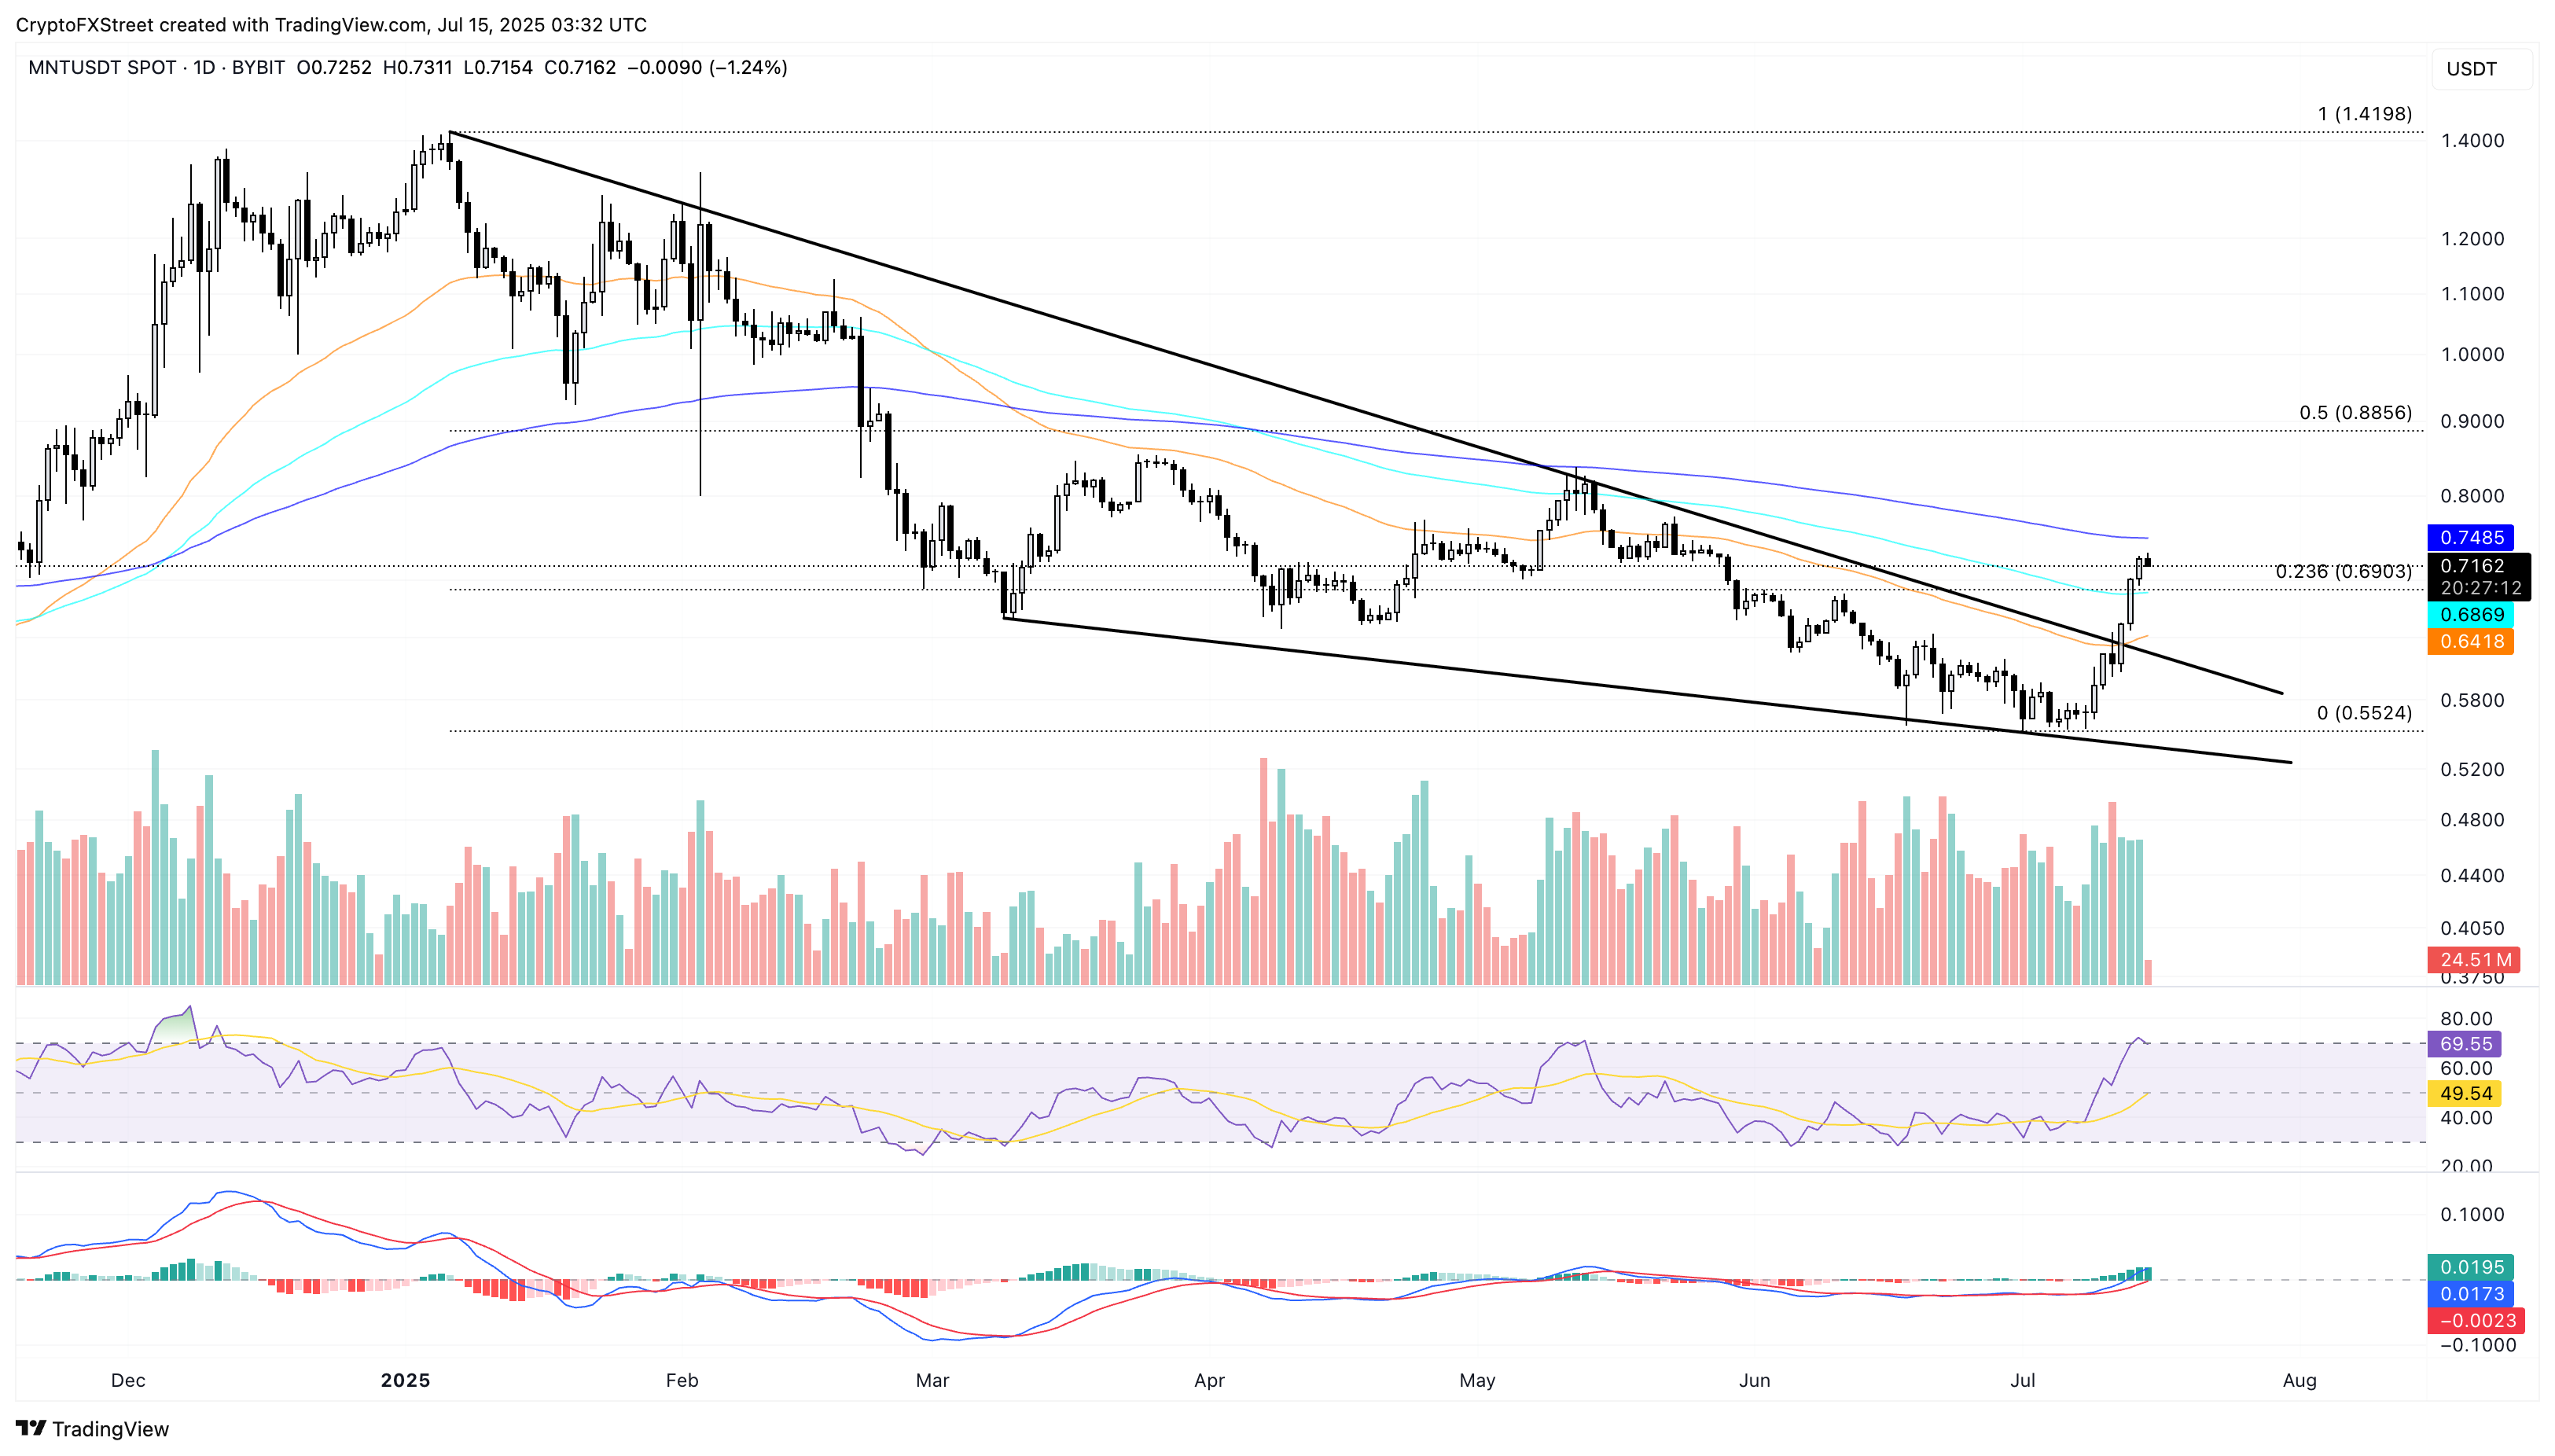
If MNT reverses from the 200-day EMA, it could retest the 23.6% Fibonacci level at $0.6903.
