🚀 Bonk Price Soars: BONK Hits Yearly High OI as LetsBonk.fun Dominates Solana Launchpad Revenue
Solana's meme coin darling isn't just barking—it's biting into serious market momentum. Open interest spikes to yearly highs while its flagship launchpad out-earns competitors. Here's why traders are suddenly allergic to shorting this dog.
### The OI Surge That's Shaking Futures Markets
BONK's open interest just smashed through its 2024 ceiling—proof even degens occasionally check their dashboards. When perpetual contracts pile up this fast, someone's either about to get liquidated or retire early (spoiler: it's usually the former).
### LetsBonk.fun Eats Solana's Launchpad Lunch
Top revenue generator across Solana launchpads this week? A platform that sounds like a rejected Nickelodeon game show. The project's absurd name-to-performance ratio perfectly encapsulates crypto's 'money printer go brrr' ethos.
### Meme Coin or Momentum Play?
Traders chasing the pump might want to check leash length—this rally's fueled equal parts by organic growth and leveraged gambles. One well-timed Elon tweet away from either Valhalla or vaporized collateral.
As always in crypto: the bigger the green candles, the harder the eventual rug pull. But for now? Let them eat BONK.
BONK’s Open Interest hits yearly high
Coinglass’ data shows that the futures’ OI in BONK at exchanges ROSE to $507.50 million on Tuesday from $393.80 million on Saturday, the highest yearly level not seen since December 9. An increasing OI represents new or additional money entering the market and new buying, which could fuel the current Bonk price rally.

Bonk Open Interest chart. Source: Coinglass
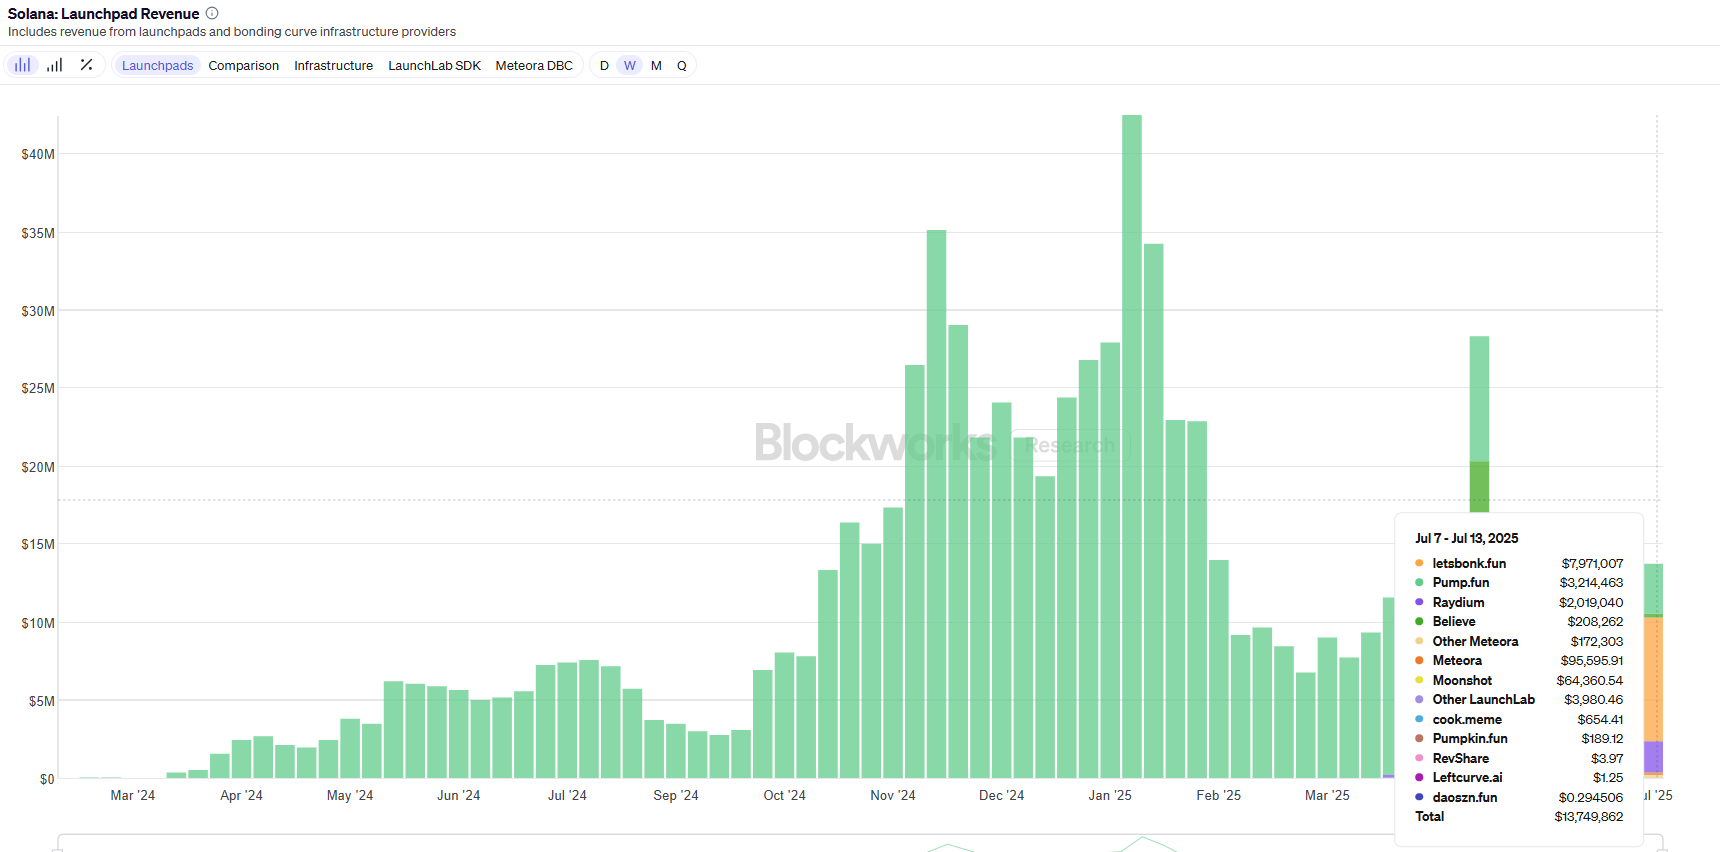
The chart below shows that for the first time, Bonk’s launchpad letsbonk.fun has flipped all other solana launchpads’ weekly revenue combined as it collects $7.97 million in revenue, further bolstering the bullish outlook.

Solana’s launchpad weekly revenue chart. Source: Blockworks
Bonk Price Forecast: BONK breaks above the key resistance level
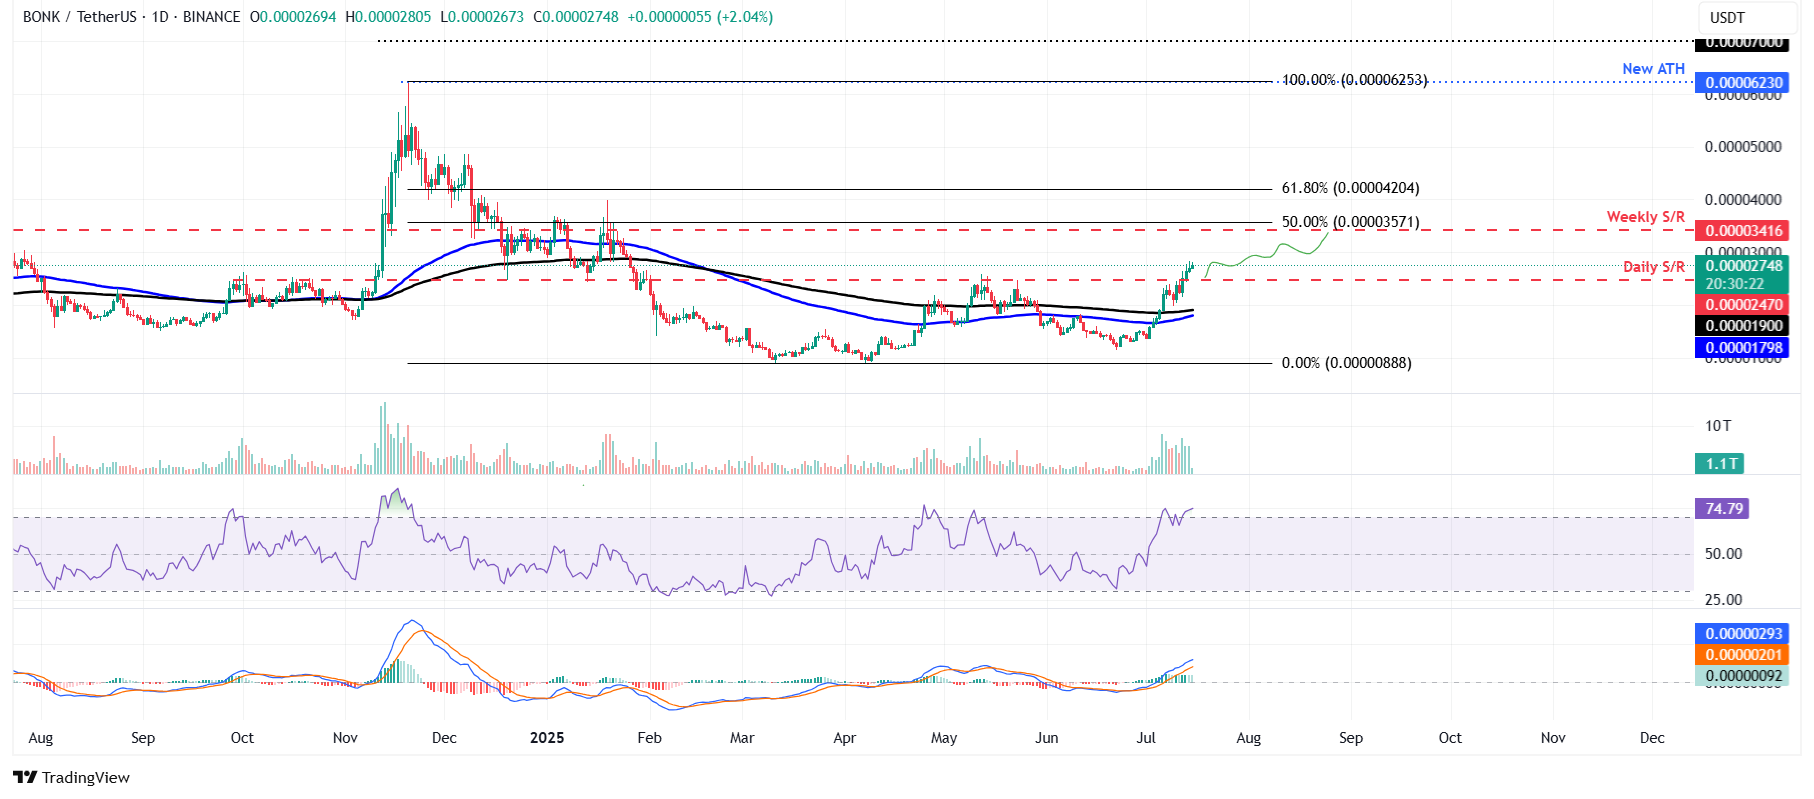
Bonk price broke above the daily resistance level at $0.000024 on Saturday and rallied 6.4% in the next two days. At the time of writing on Tuesday, it continues its upward trend, trading above $0.000027.
If the daily level at $0.000024 holds as support, BONK could extend the rally to retest its weekly resistance at $0.000034.
The Relative Strength Index (RSI) on the daily chart reads 74, above its overbought level of 70, indicating strong bullish momentum. However, traders should be cautious as the chances of a pullback are high due to its overbought condition. Meanwhile, the Moving Average Convergence Divergence (MACD) indicator displayed a bullish crossover at the end of June. It also shows rising green histogram bars above its neutral zero line, suggesting bullish momentum is gaining traction and continuing an upward trend.

BONK/USDT daily chart
However, if BONK faces a correction, it could extend the decline to find support around its daily level at $0.000024.

