🚀 XCN, PENGU, SUI Defy Market Slump: These Altcoins Are Outpacing Bitcoin’s Drop Below $119K

While Bitcoin stumbles, these crypto underdogs are stealing the spotlight—and the gains.
The Contrarian Rally: In a classic 'risk-on' pivot, traders are dumping blue-chip crypto for high-beta plays. XCN’s governance token pumps 42% amid DAO hype, meme coin PENGU waddles up 28% on influencer shilling, and Sui’s Layer-1 soars 19% after exchange listings. Meanwhile, BTC bleeds out below $119K—because apparently even digital gold isn’t safe from Fed jitters.
Why It Matters: Altseason isn’t dead—it’s just wearing a disguise. These movers prove capital rotates faster than a DeFi yield farm’s APY. (Pro tip: Watch for the inevitable 'take profits' tweets from the same influencers now hyping the pumps.)
The Bottom Line: When Bitcoin sneezes, altcoins catch volatility—but today, they’re spiking the fever. Just remember: what goes up 50% in a week can crater twice as fast. Ask your 2021 NFT bagholder friends.
XCN trendline breakout rally hits key resistance
Onyxcoin edges lower by 2% at press time on Tuesday, following the 13% surge from the previous day. XCN bounced off the 200-day Exponential Moving Average (EMA) and exceeded a resistance trendline formed by connecting the peaks of January 26 and May 16.
The breakout rally struggles to surpass the 50% Fibonacci retracement level at $0.019, drawn from the $0.050 peak of January 26 and the $0.007 low of April 7. A decisive close above this level could stretch the Onyxcoin rally to the April 11 peak of $0.029.
The Moving Average Convergence/Divergence (MACD) indicator displays a positive trend of MACD and signal line crossing above the zero line, suggesting a trend reversal.
The Relative Strength Index (RSI) reads 67 as it reverts from the overbought zone, suggesting a minor decline in bullish momentum with the intraday pullback.
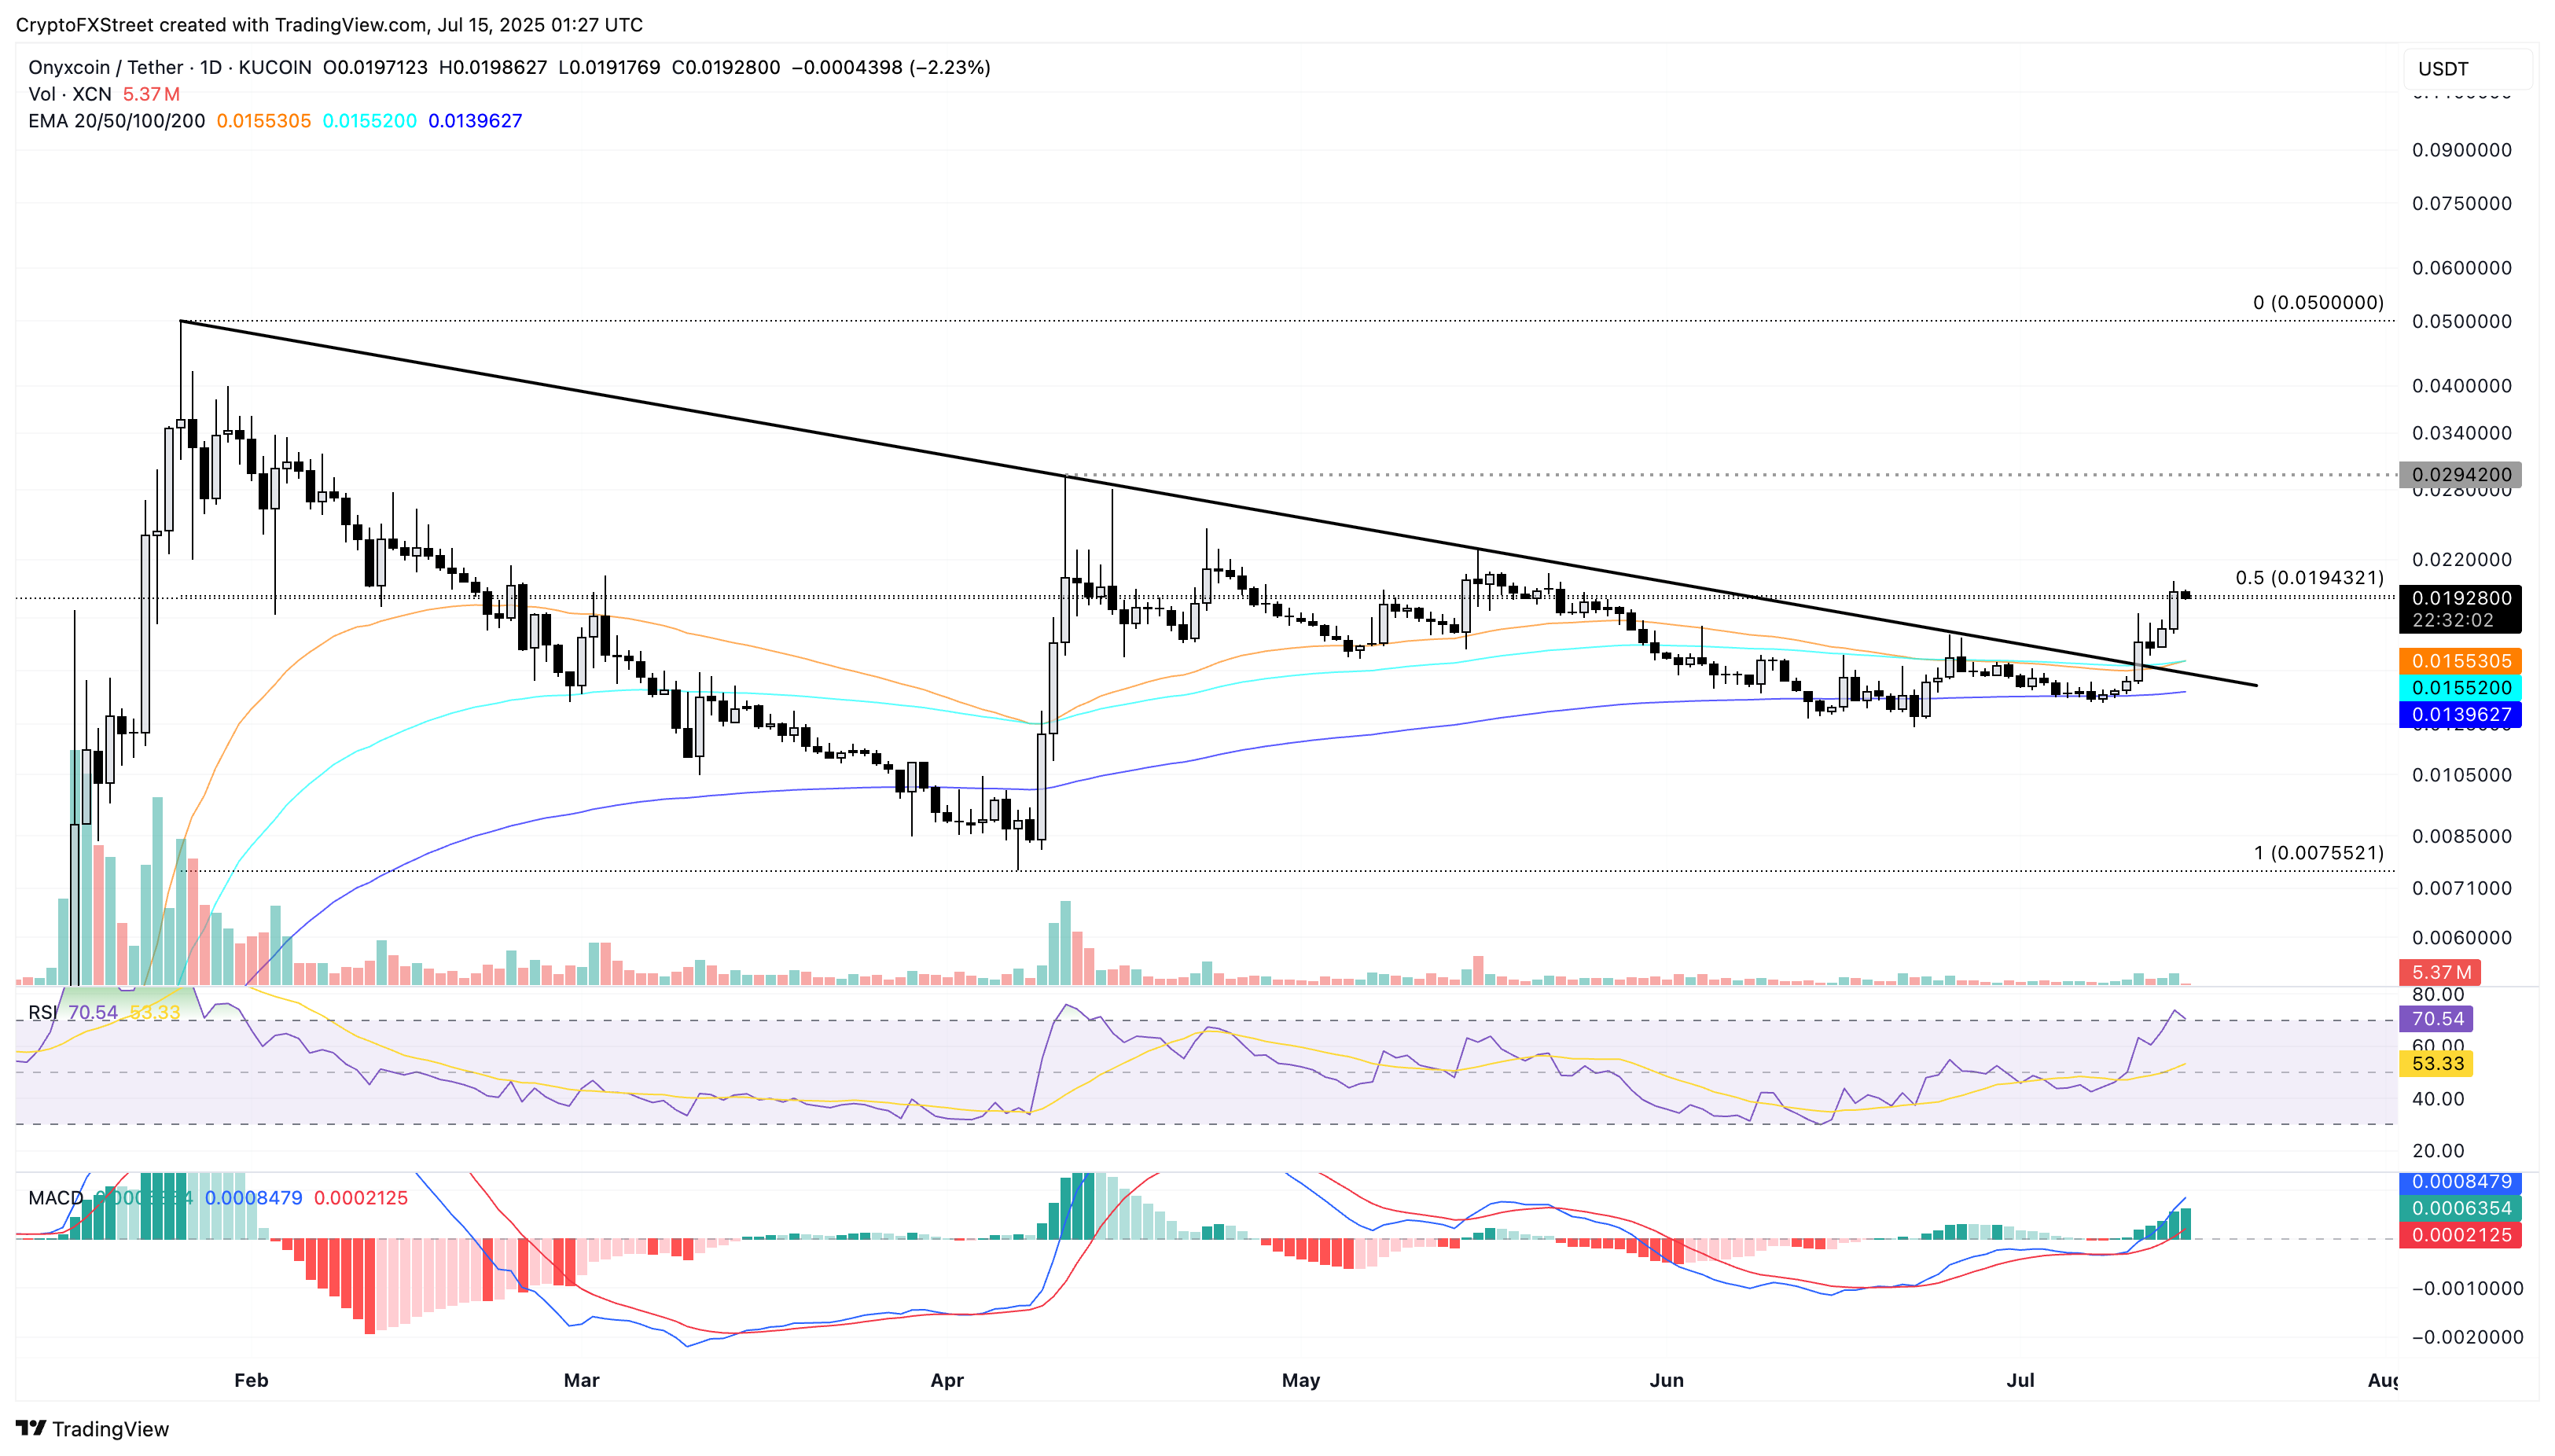
XCN/USDT daily price chart.
If XCN reverses from the 50% Fibonacci level at $0.019, it could result in a retest of the 50-day EMA at $0.015.
PENGU’s trend reversal nears crucial resistance level
Pudgy Penguins’ trend reversal rally holds NEAR the $0.030 level, holding the 28% gains from Sunday. At the time of writing, the PENGU edges higher by 2% so far on Tuesday, trading between the 61.8% and 78.6% Fibonacci retracement levels of $0.022 and $0.037, drawn from the December 17 peak of $0.070 to the April 9 low of $0.003.
Sidelined investors could await a decisive close above $0.037 to confirm upside chances, with the next target at the $0.050 psychological mark.
The 50-day EMA crossing above the 200-day EMA marks a golden crossover, typically considered a trend reversal signal.
The momentum indicators, such as MACD with rising green histogram bars and RSI at 86 signaling overbought conditions, highlight a bullish bias.
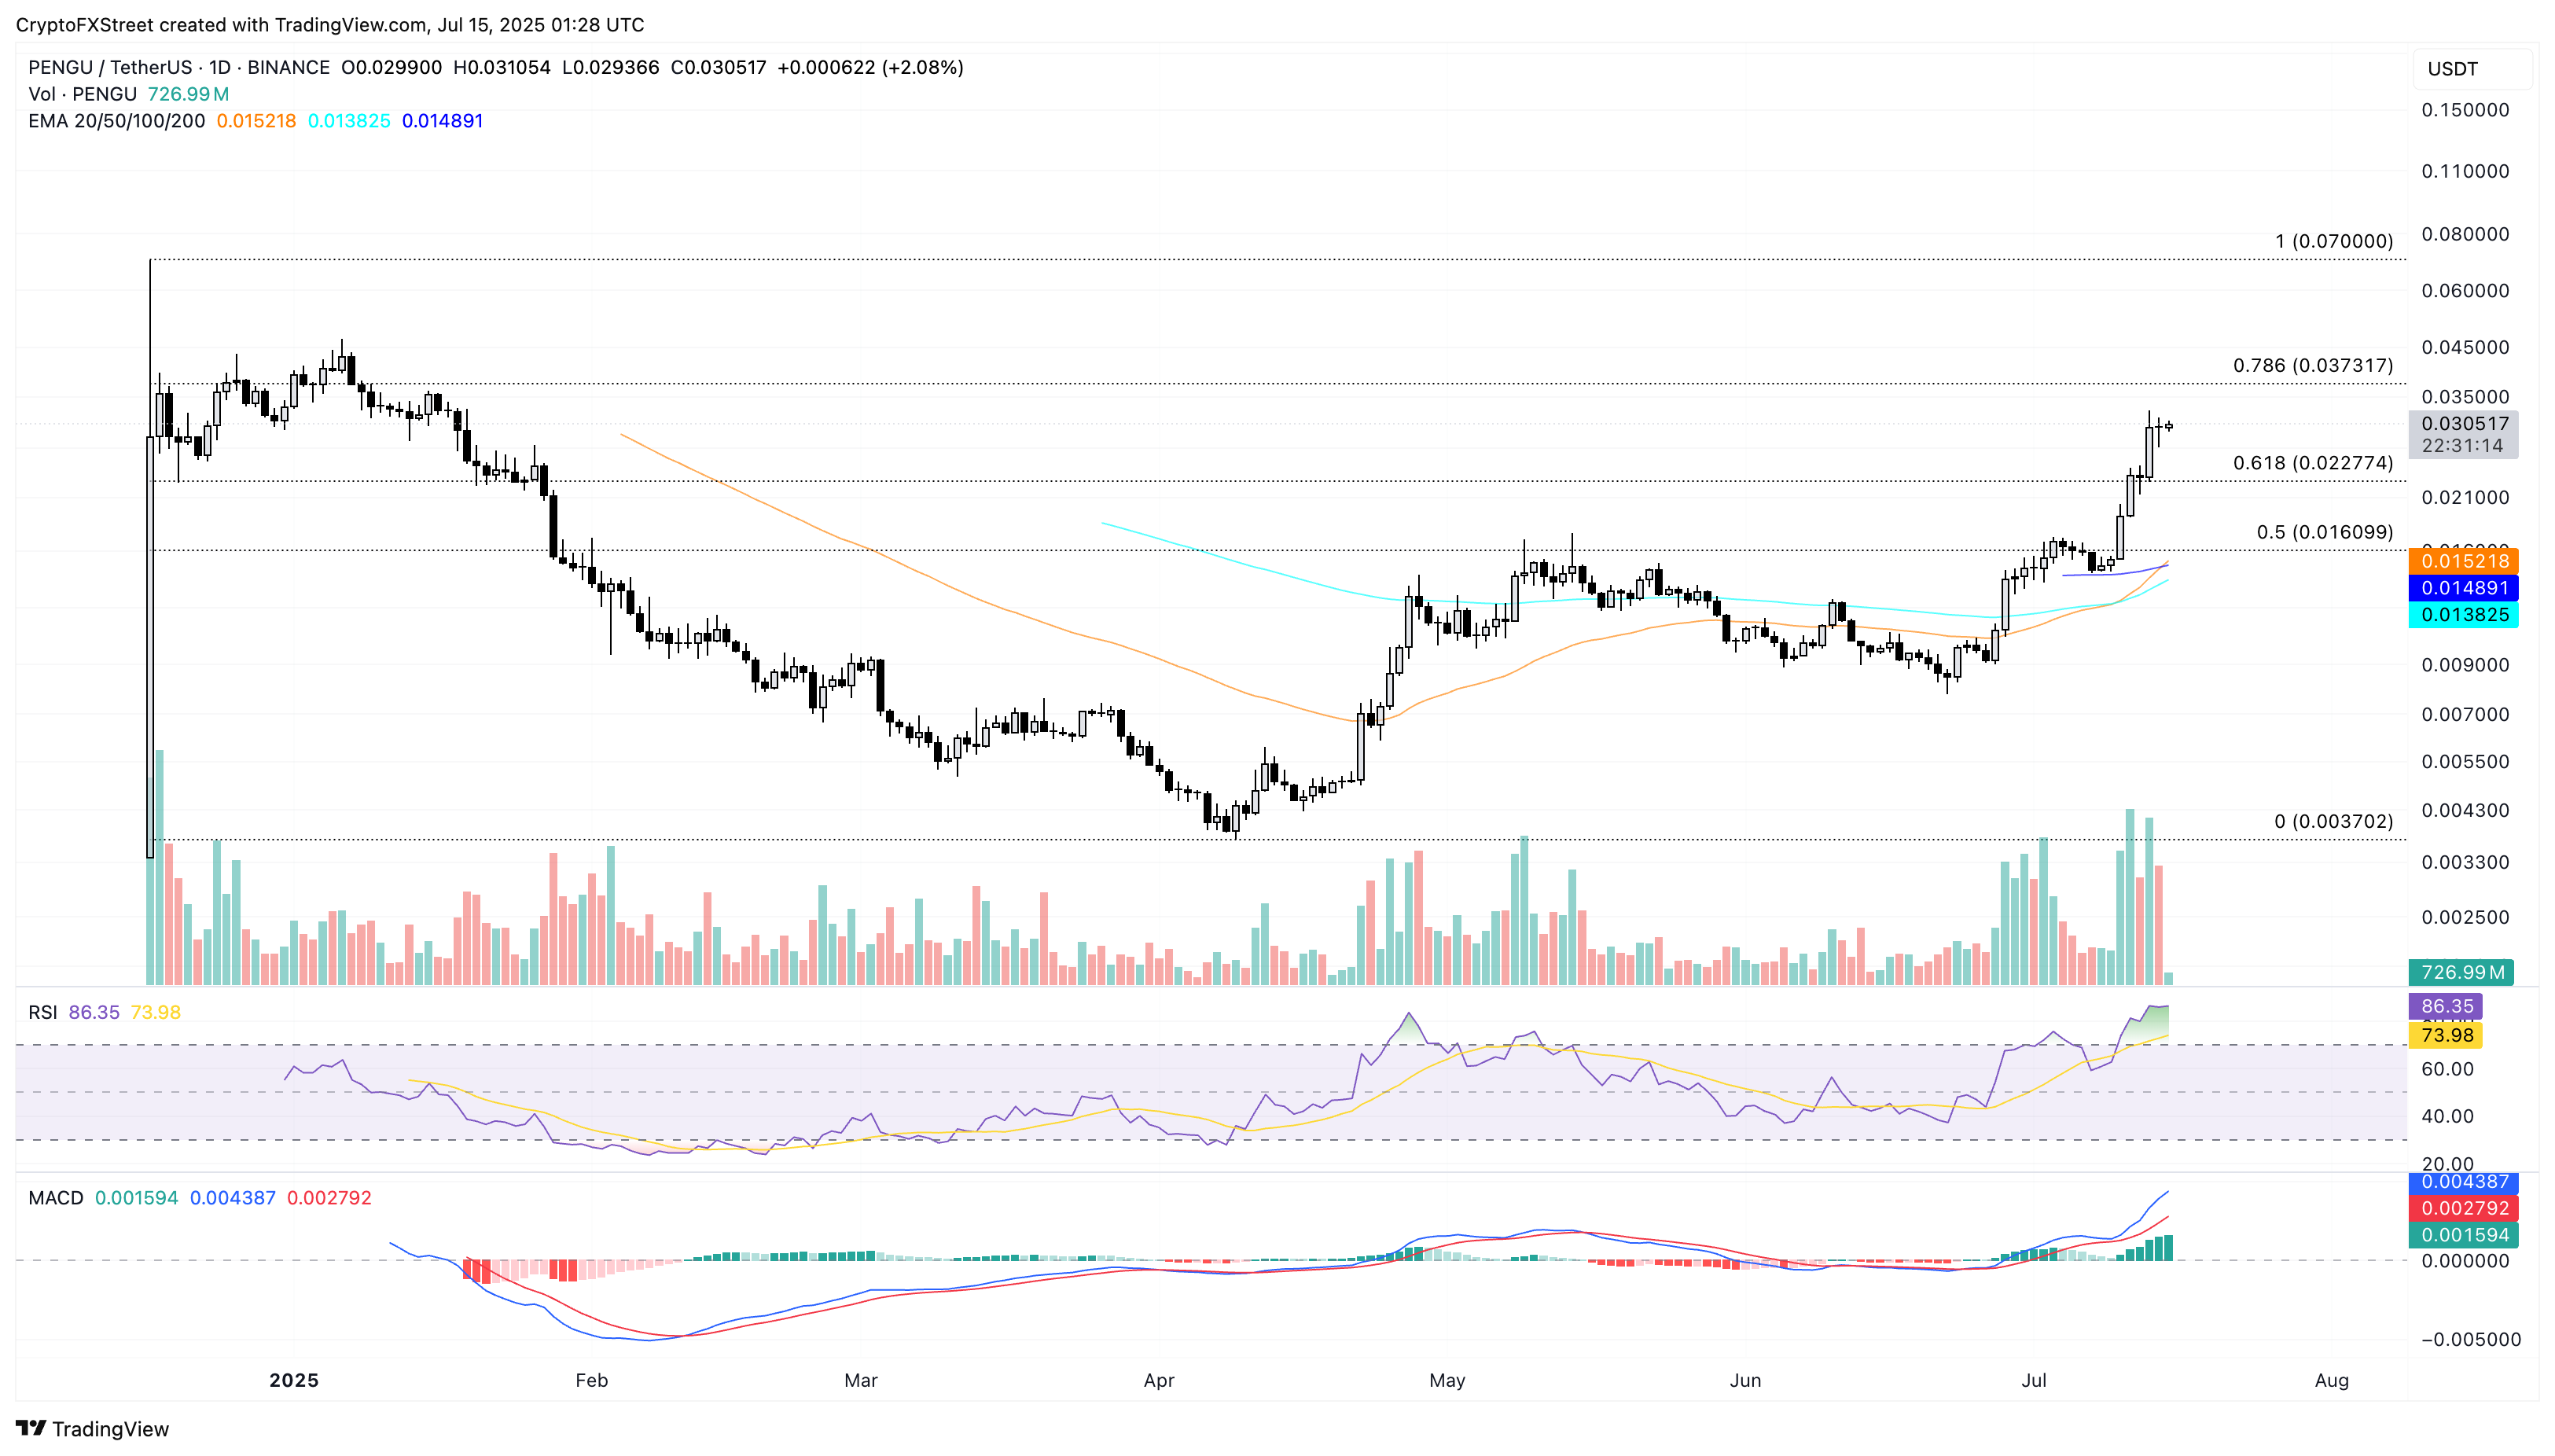
PENGU/USDT daily price chart.
If PENGU fails to uphold momentum, it could retest the 61.8% Fibonacci level at $0.022.
SUI bullish run eyes further gains beyond $4
SUI edges lower marginally by under 0.50% at press time on Tuesday as it holds an 11% gain from Monday. The altcoin broke out of a resistance trendline formed by connecting May 12 and June 10 peaks on Wednesday.
SUI inches closer to reclaiming the $4 milestone, while the bulls target the 78.6% Fibonacci retracement level at $4.20, drawn from $5.36 on January 6 to $1.71 on April 7. A clean push above this level could stretch the breakout rally to the January 6 peak of $5.36.
The 50-day and 100-day EMAs inch closer to a bullish crossover, a positive signal for buyers. The RSI at 70 hits the overbought boundary line, with the MACD indicator displaying an uptrend of green histogram bars, suggesting heightened bullish momentum.
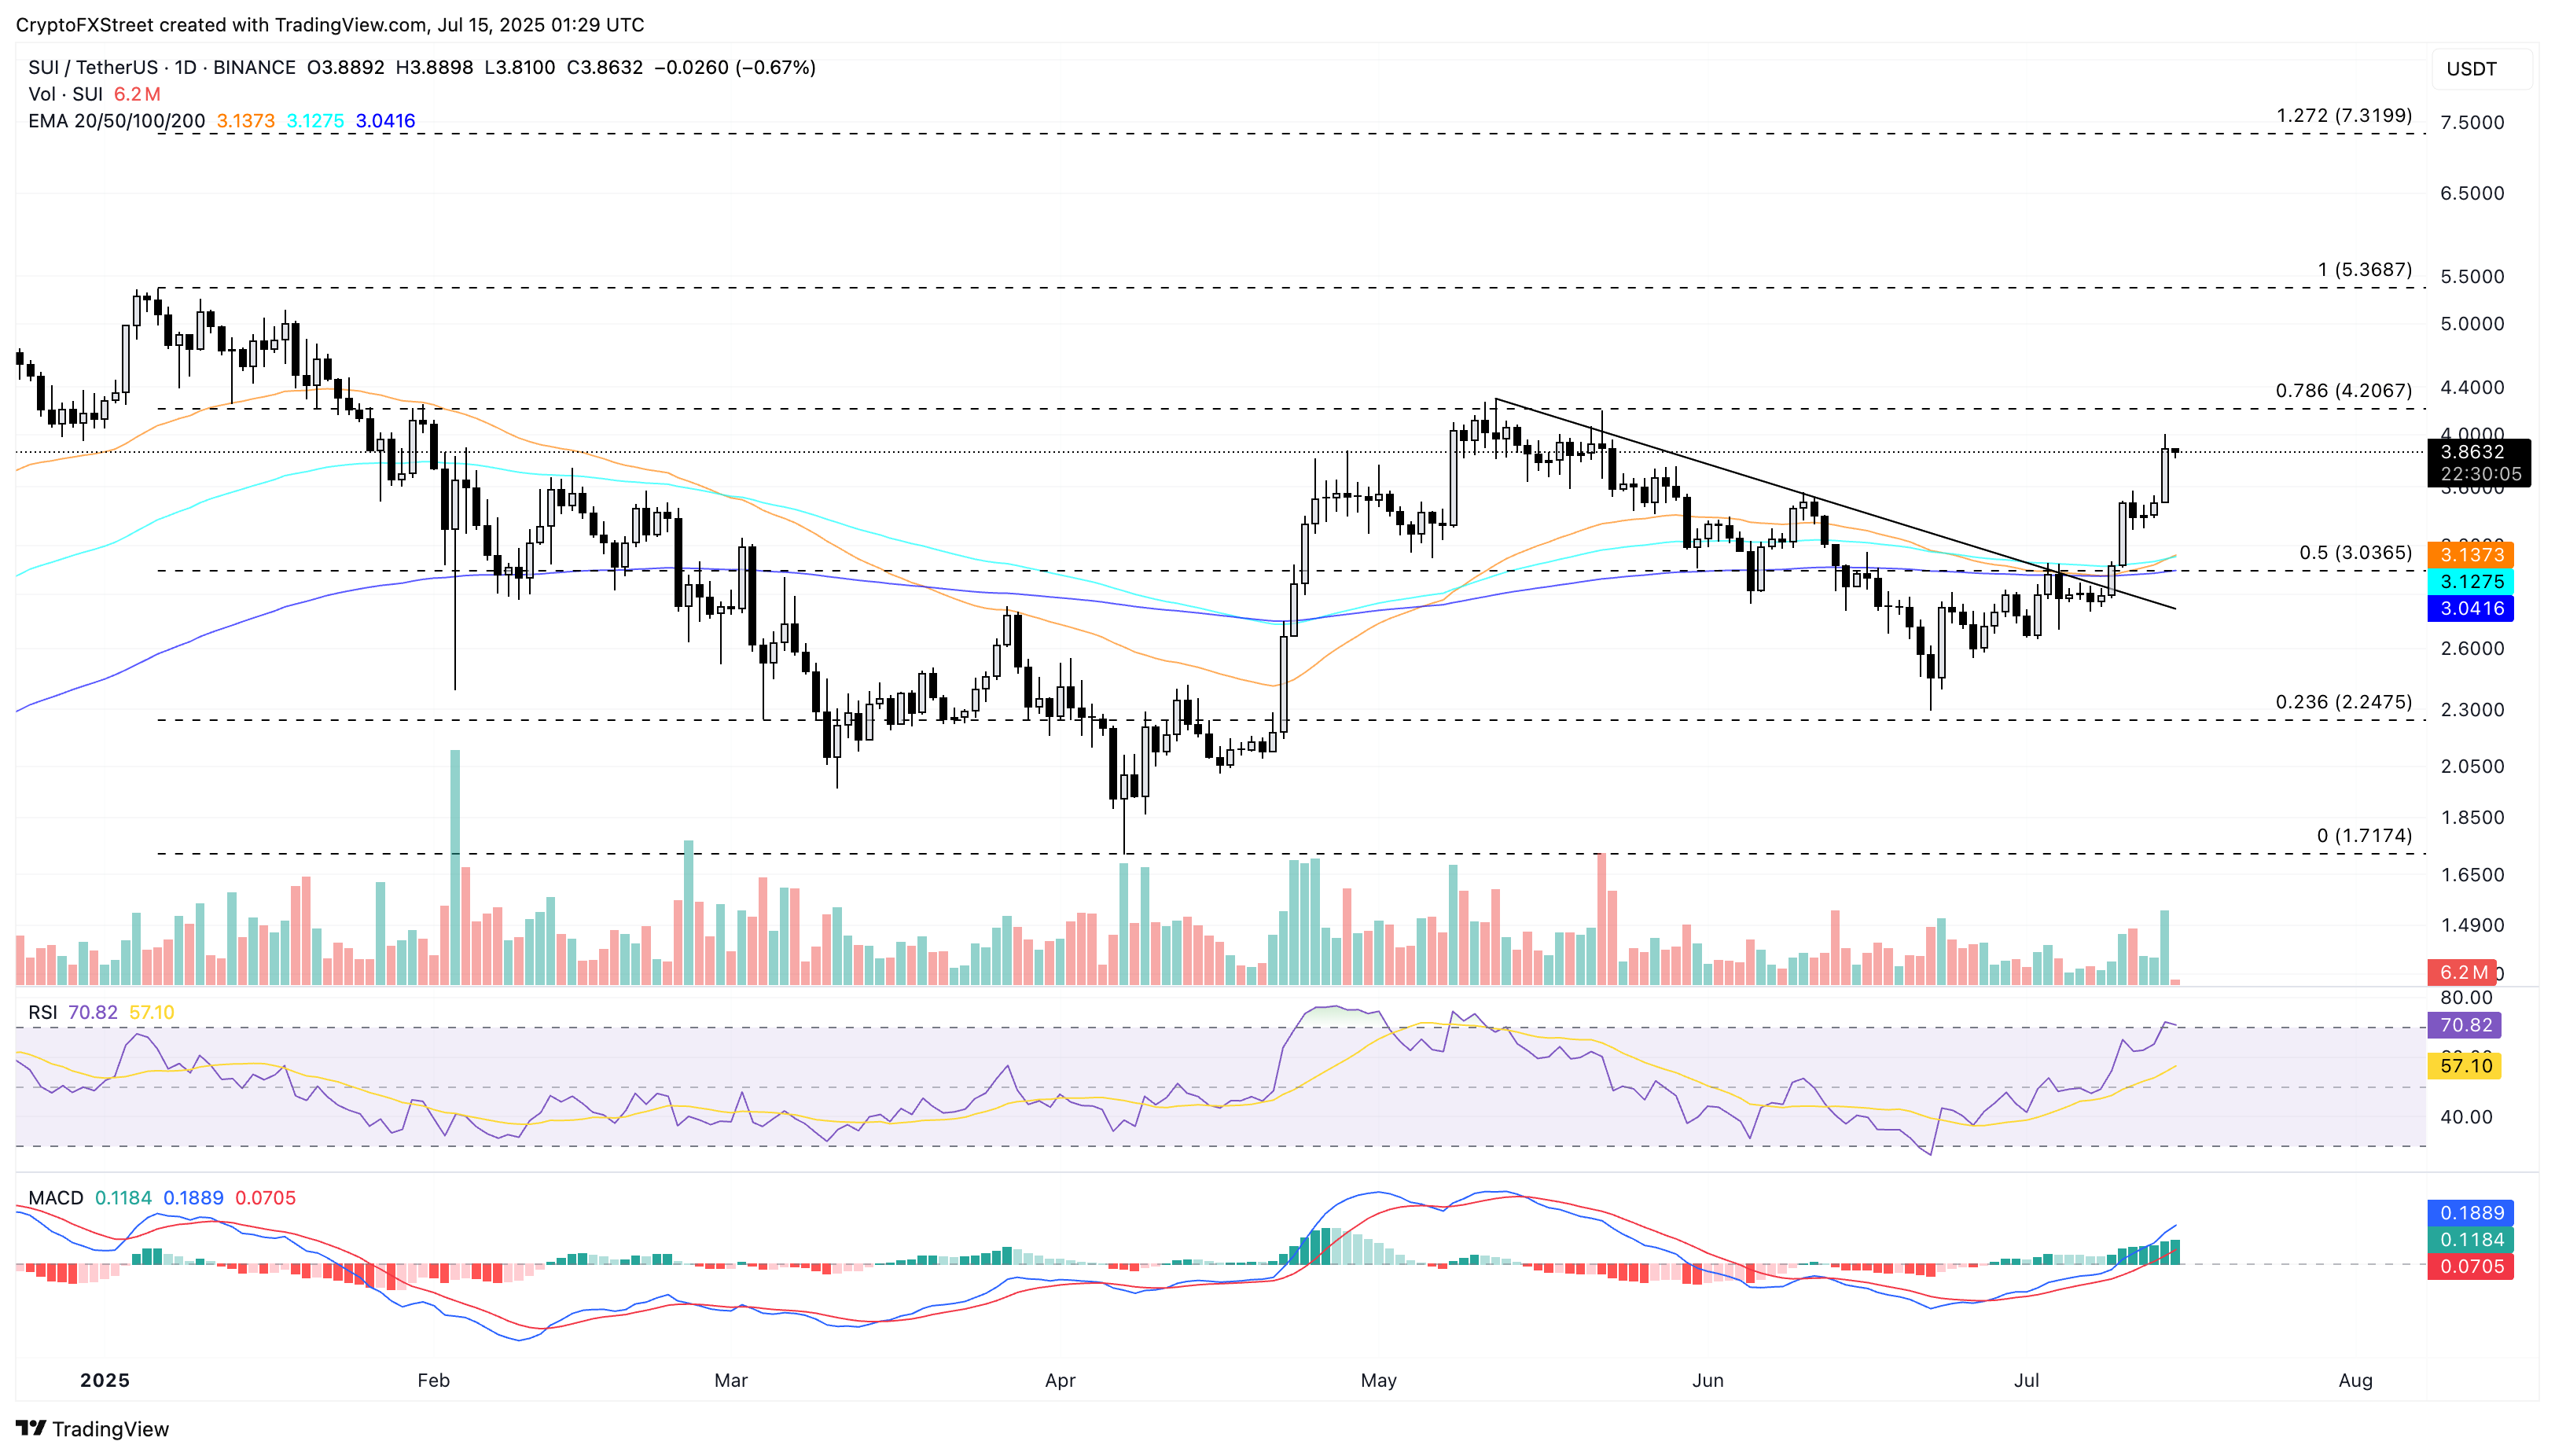
SUI/USDT daily price chart.
On the downside, a reversal in sui could retest the 50-day EMA at $3.13.
