NASDAQ 100 Alert: Is a 5% Market Correction Looming in July 2025?

Tech bulls, brace yourselves—the NASDAQ 100 might be gearing up for a reality check.
Rumblings of a 5% pullback are spreading faster than a meme stock rally. Could this be the market’s way of saying 'enough' after another relentless climb?
Here’s the kicker: Wall Street’s crystal ball is as reliable as a free NFT. But the numbers don’t lie—corrections are the market’s version of a detox after a liquidity binge.
Stay sharp. The only thing predictable about tech stocks? Their unpredictability.
Figure 1. NDX daily chart with our preferred Elliott Wave count and several technical indicators
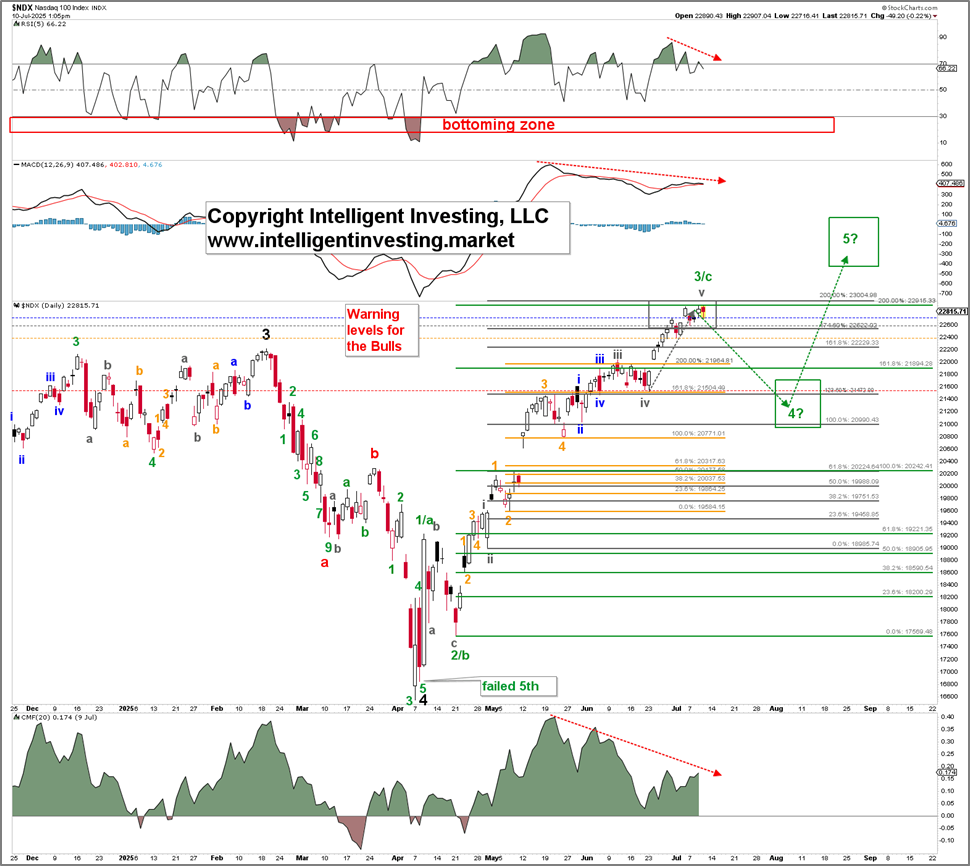
Furthermore, as the index increased, we adjusted our warning levels for the bulls accordingly. Blue indicates the first warning level for the bulls, also known as a radar lock, at $22733. Gray represents the second warning level, called a shot across the bow, at $22587. Orange marks the third warning for the bulls at $22386, and red signifies the point where the ship sinks, so to speak; then we MOVE to the alternative EW count, currently at $21532. These levels help keep our premium members on the right side of the trade for as long as possible, so we don’t have to worry about a shallower 4th wave than ideal or not. Namely, if the orange or red levels are not breached, we can continue riding the upside regardless of any news or other factors.
Understanding our position in the market’s shifting waves is essential, as it helps us set realistic expectations. Specifically, a trader's main goal is to identify the most profitable wave patterns, such as a third wave or a C wave. In this case, the 3rd wave (green W-3/c) is approaching its end, one way or another, but aside from the fact that the (gray) target zone has been reached and there are negative divergences on the technical indicators (red dotted arrows on the RSI5, MACD, and Money Flow); we have no objective, i.e., price-based, signal yet indicating it is over. Therefore, we remain in the market.
Therefore, although we cannot predict or rule out any extension of the wave from the May 26 and June 23 lows, we expect the green W-3/c to finish in the next few days. Since Elliott Wave (EW) analysis is based on price action, we don’t need to second-guess; instead, we can rely on our warning levels to identify when the next corrective phase—the green W-4—begins.
