🚀 Crypto Alert: Bitcoin Stalls Below $109K While Ethereum & XRP Flash Bullish Signals Before FOMC Minutes Drop

Markets hold their breath as Bitcoin consolidates under $109,000—but Ethereum and XRP are painting green on the charts ahead of today's Federal Reserve revelations.
Recovery Mode Activated: ETH and XRP show technical resilience while traders brace for potential volatility from the FOMC minutes. No surprises here—Wall Street's crystal ball remains cloudier than a DeFi protocol's fine print.
The Fed Effect: Every crypto trader suddenly becomes a macroeconomist when Powell's printer goes brrr—or doesn't. Meanwhile, Bitcoin's acting like it's stuck in regulatory purgatory (again).
Bottom Line: The crypto market's playing chicken with the Fed. Will the minutes spark a breakout or another 'buy the rumor, sell the news' circus? Place your bets—the house always wins.
Market overview: Focus shifts to FOMC minutes
The Fed left interest rates unchanged in the range of 4.25% to 4.50%, meeting market expectations, at the end of its policy meeting in June. The Fed Chairman Jerome Powell, in his remarks, said that the central bank needs time to sturdy incoming data in light of higher tariffs, which could trigger short-term inflation.
The Federal Open Market Committee (FOMC) minutes, scheduled for release on Wednesday, provide insight into the direction of the Fed's monetary policy. According to highlights of Powell's speech, highlighted in a report by FXStreet in June, the central bank is content with the current policy stance, especially with inflation "running somewhat above our goal."
The implementation of higher tariffs on August 1 could see the Fed delay interest rate cuts. Nonetheless, the market still expects at least two cuts before the end of the year, which could bolster interest in riskier assets, such as Bitcoin and altcoins.
Data spotlight: Bitcoin spot ETF inflows drop
Institutional interest in bitcoin spot Exchange Traded Funds (ETFs) remains steady. However, there is a noticeable drop in the daily net inflow volume, with about $80 million recorded on Tuesday. This is the lowest in four days, with the highest being the $602 million posted on July 3.
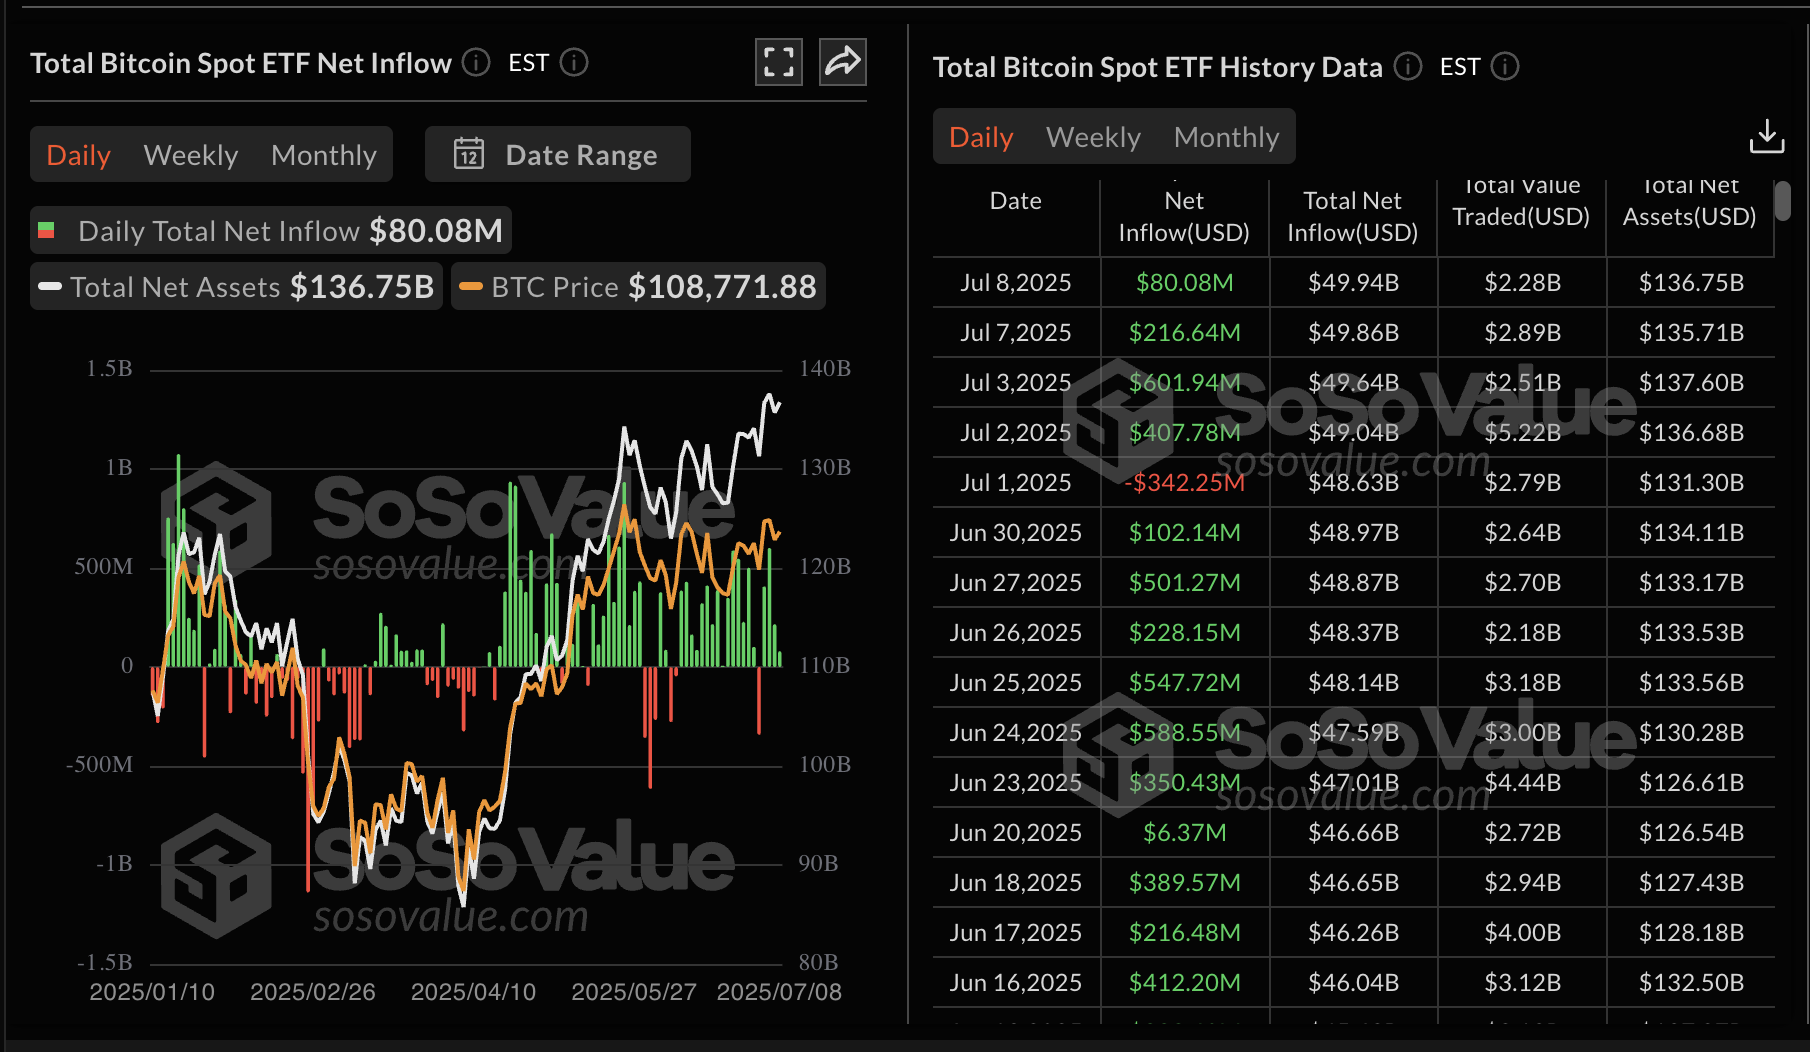
Bitcoin spot ETF data | Source: SoSoValue
Retail interest in Bitcoin remains significantly low despite the price holding above $100,000 and trading NEAR all-time highs. Institutional interest has been the driving force behind the elevated BTC price, underscoring the role that large-volume investors are playing in steadying spot ETF inflows.
As for Ethereum spot ETFs, the total daily net inflow volume reached approximately $47 million on Tuesday, extending the bullish streak. The cumulative total net inflow currently stands at $4.51 billion, with a total of $11.03 billion in net assets.
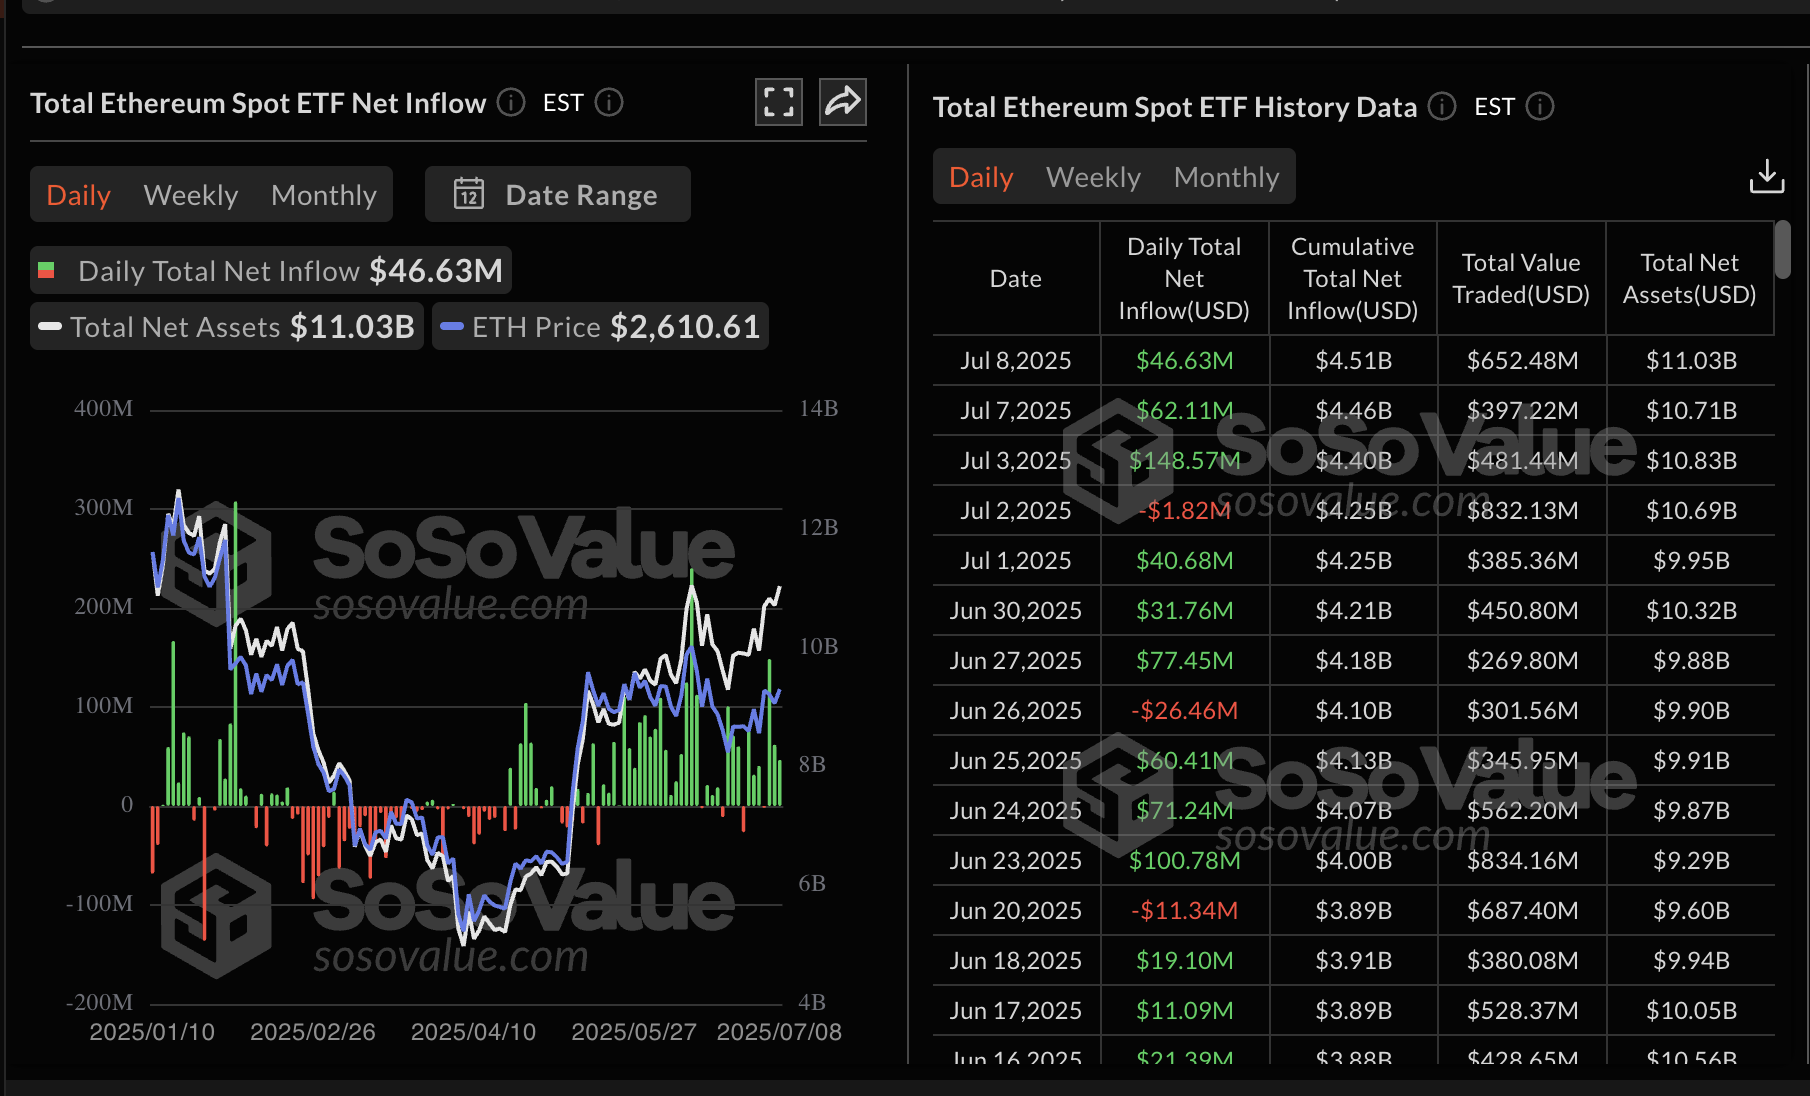
Ethereum spot ETF data | Source: SoSoValue
Chart of the day: Bitcoin edges lower
Bitcoin's price has declined slightly on Wednesday, following a minor upswing the previous day, which stalled at $109,216. With bears seemingly on the upper hand, BTC is trading at around $108,698 at the time of writing.
The path of least resistance could remain downward, particularly with the Money FLOW Index (MFI) downtrending above 54. This tool tracks the amount of money entering and leaving BTC. Hence, a persistent drop indicates a risk-off sentiment, which can influence Bitcoin's price toward lower levels.

BTC/USDT daily chart
Still, Bitcoin holds above a recently broken key descending trendline, which had capped Bitcoin's uptrend since it reached its all-time high of around $111,980 on May 22.
If respected as support, bulls will likely gain confidence in BTC's recovery potential, thus encouraging risk sentiment among traders while anticipating an upswing past the $110,000 level, followed by a subsequent rally to new all-time highs.
Altcoins update: Ethereum, XRP fluent recovery signs
Ethereum's price is currently trading at around $2,611, having faced resistance at approximately $2,644, its intraday high. The Moving Average Convergence Divergence (MACD) indicator affirms a slightly bullish outlook on the daily chart, with a buy signal maintained since July 1. Traders may continue to seek exposure as long as the blue MACD line remains above the red signal line, backed by the green histogram bars above the mean line.
Should bulls push above the resistance at $2,644, the path of least resistance could remain upward, extending the bullish scope to the next key hurdle at $2,880, which was tested on June 11.
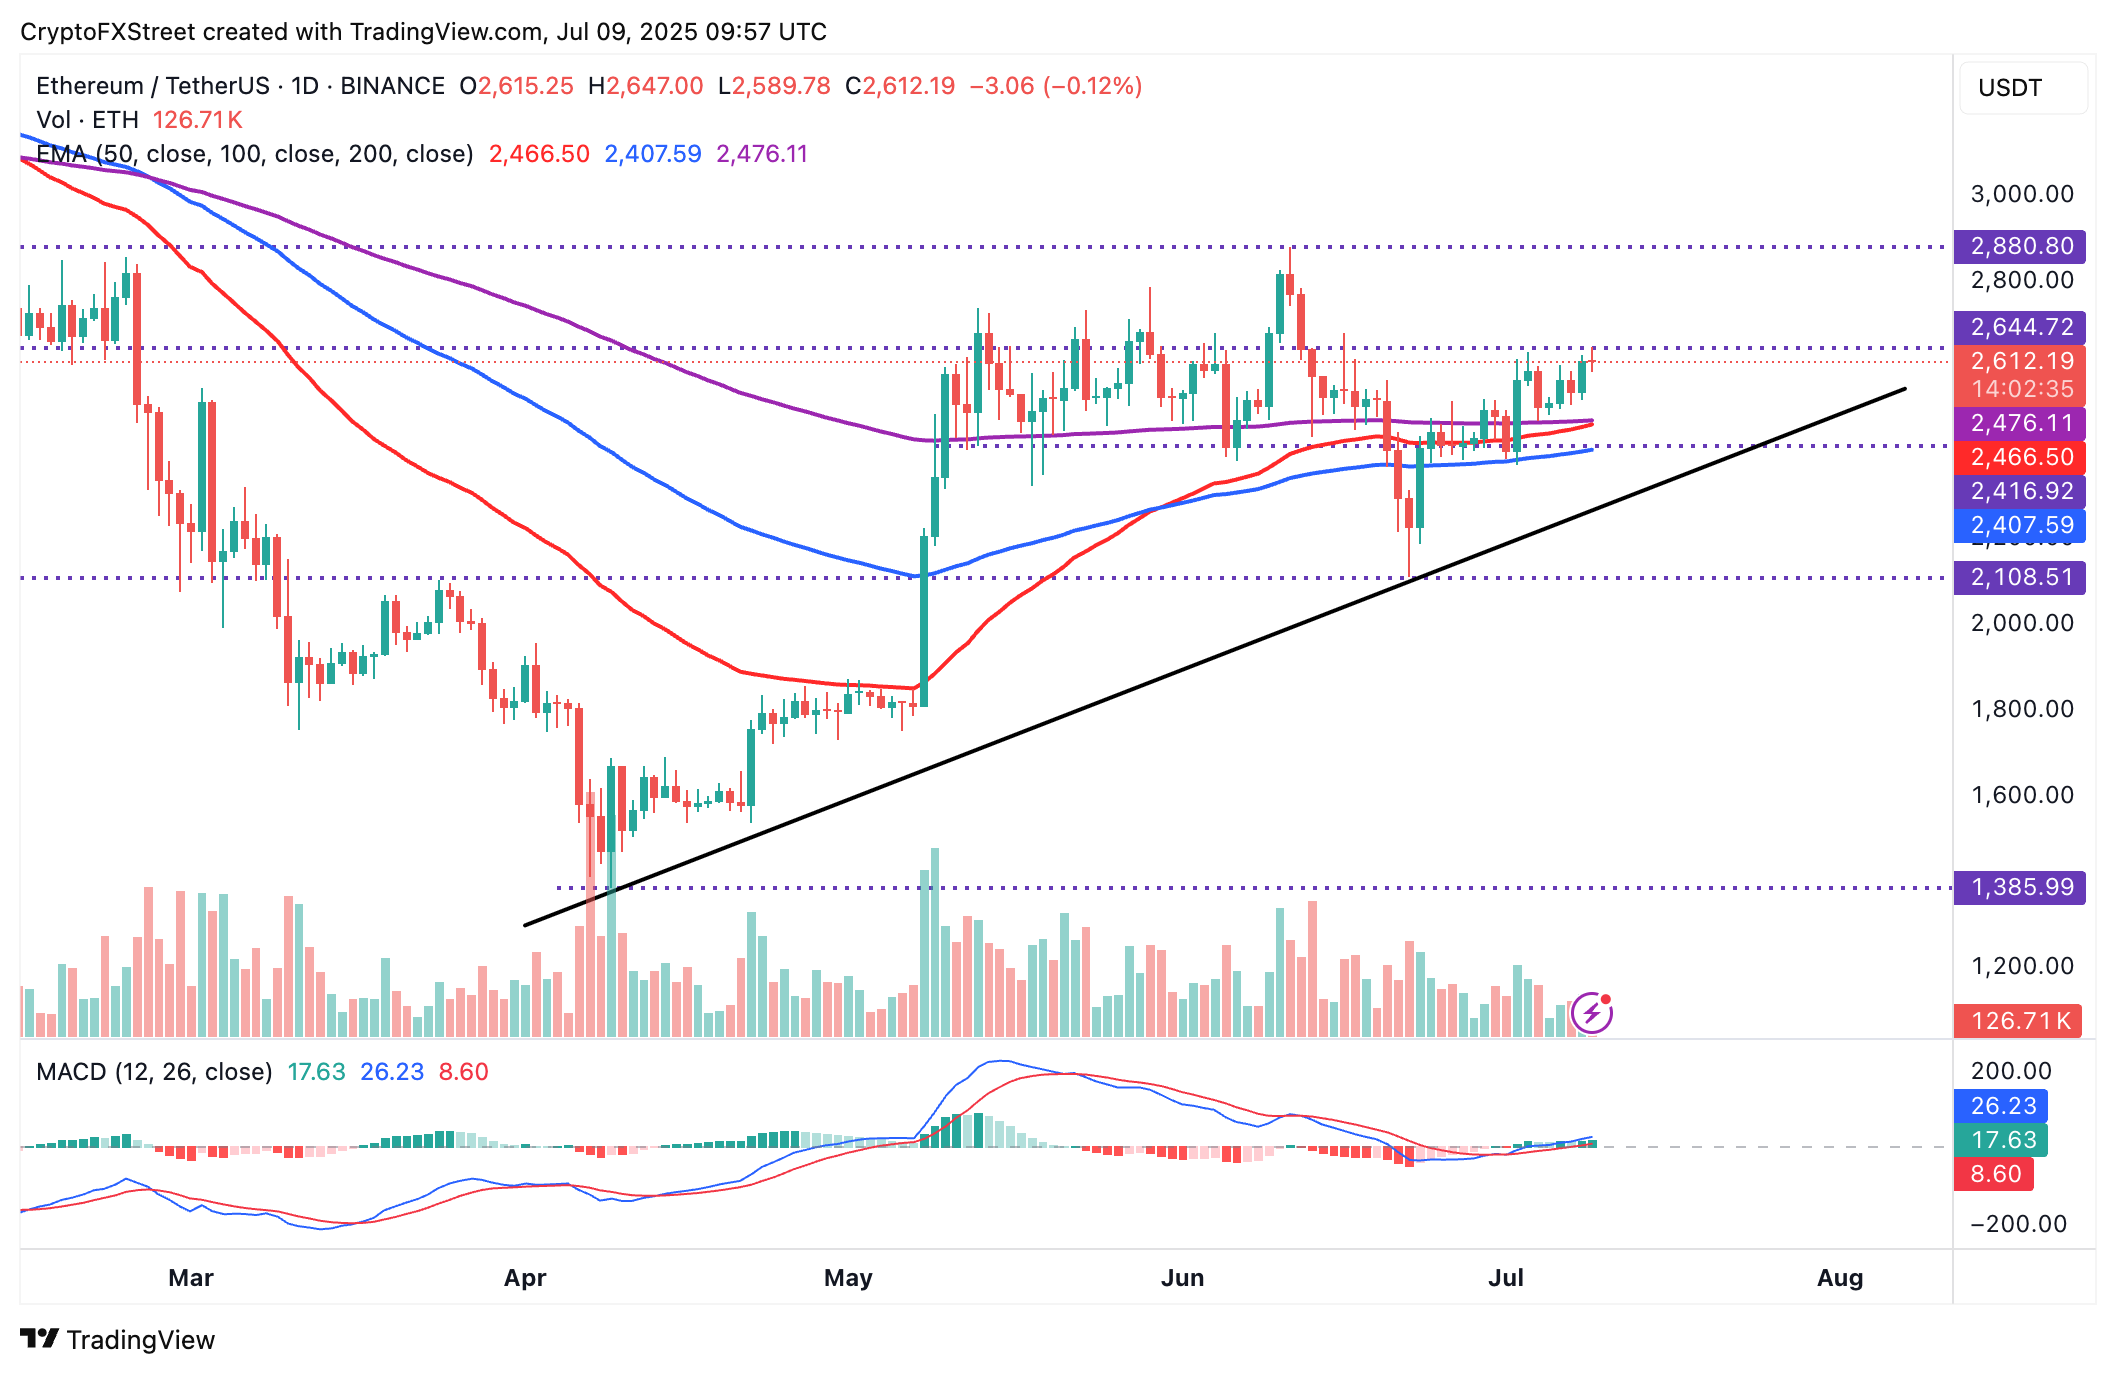
ETH/USDT daily chart
As for the cross-border money remittance token, XRP, bulls are on the cusp of validating an 18% breakout from an inverse head-and-shoulders (H&S) pattern on the 8-hour chart discussed in the previous price forecast.
If validated and accompanied by a surge in trading volume, XRP could accelerate the uptrend, reaching highs of $2.76 as the measured target of the pattern and closing in on the psychological resistance level of $3.00.
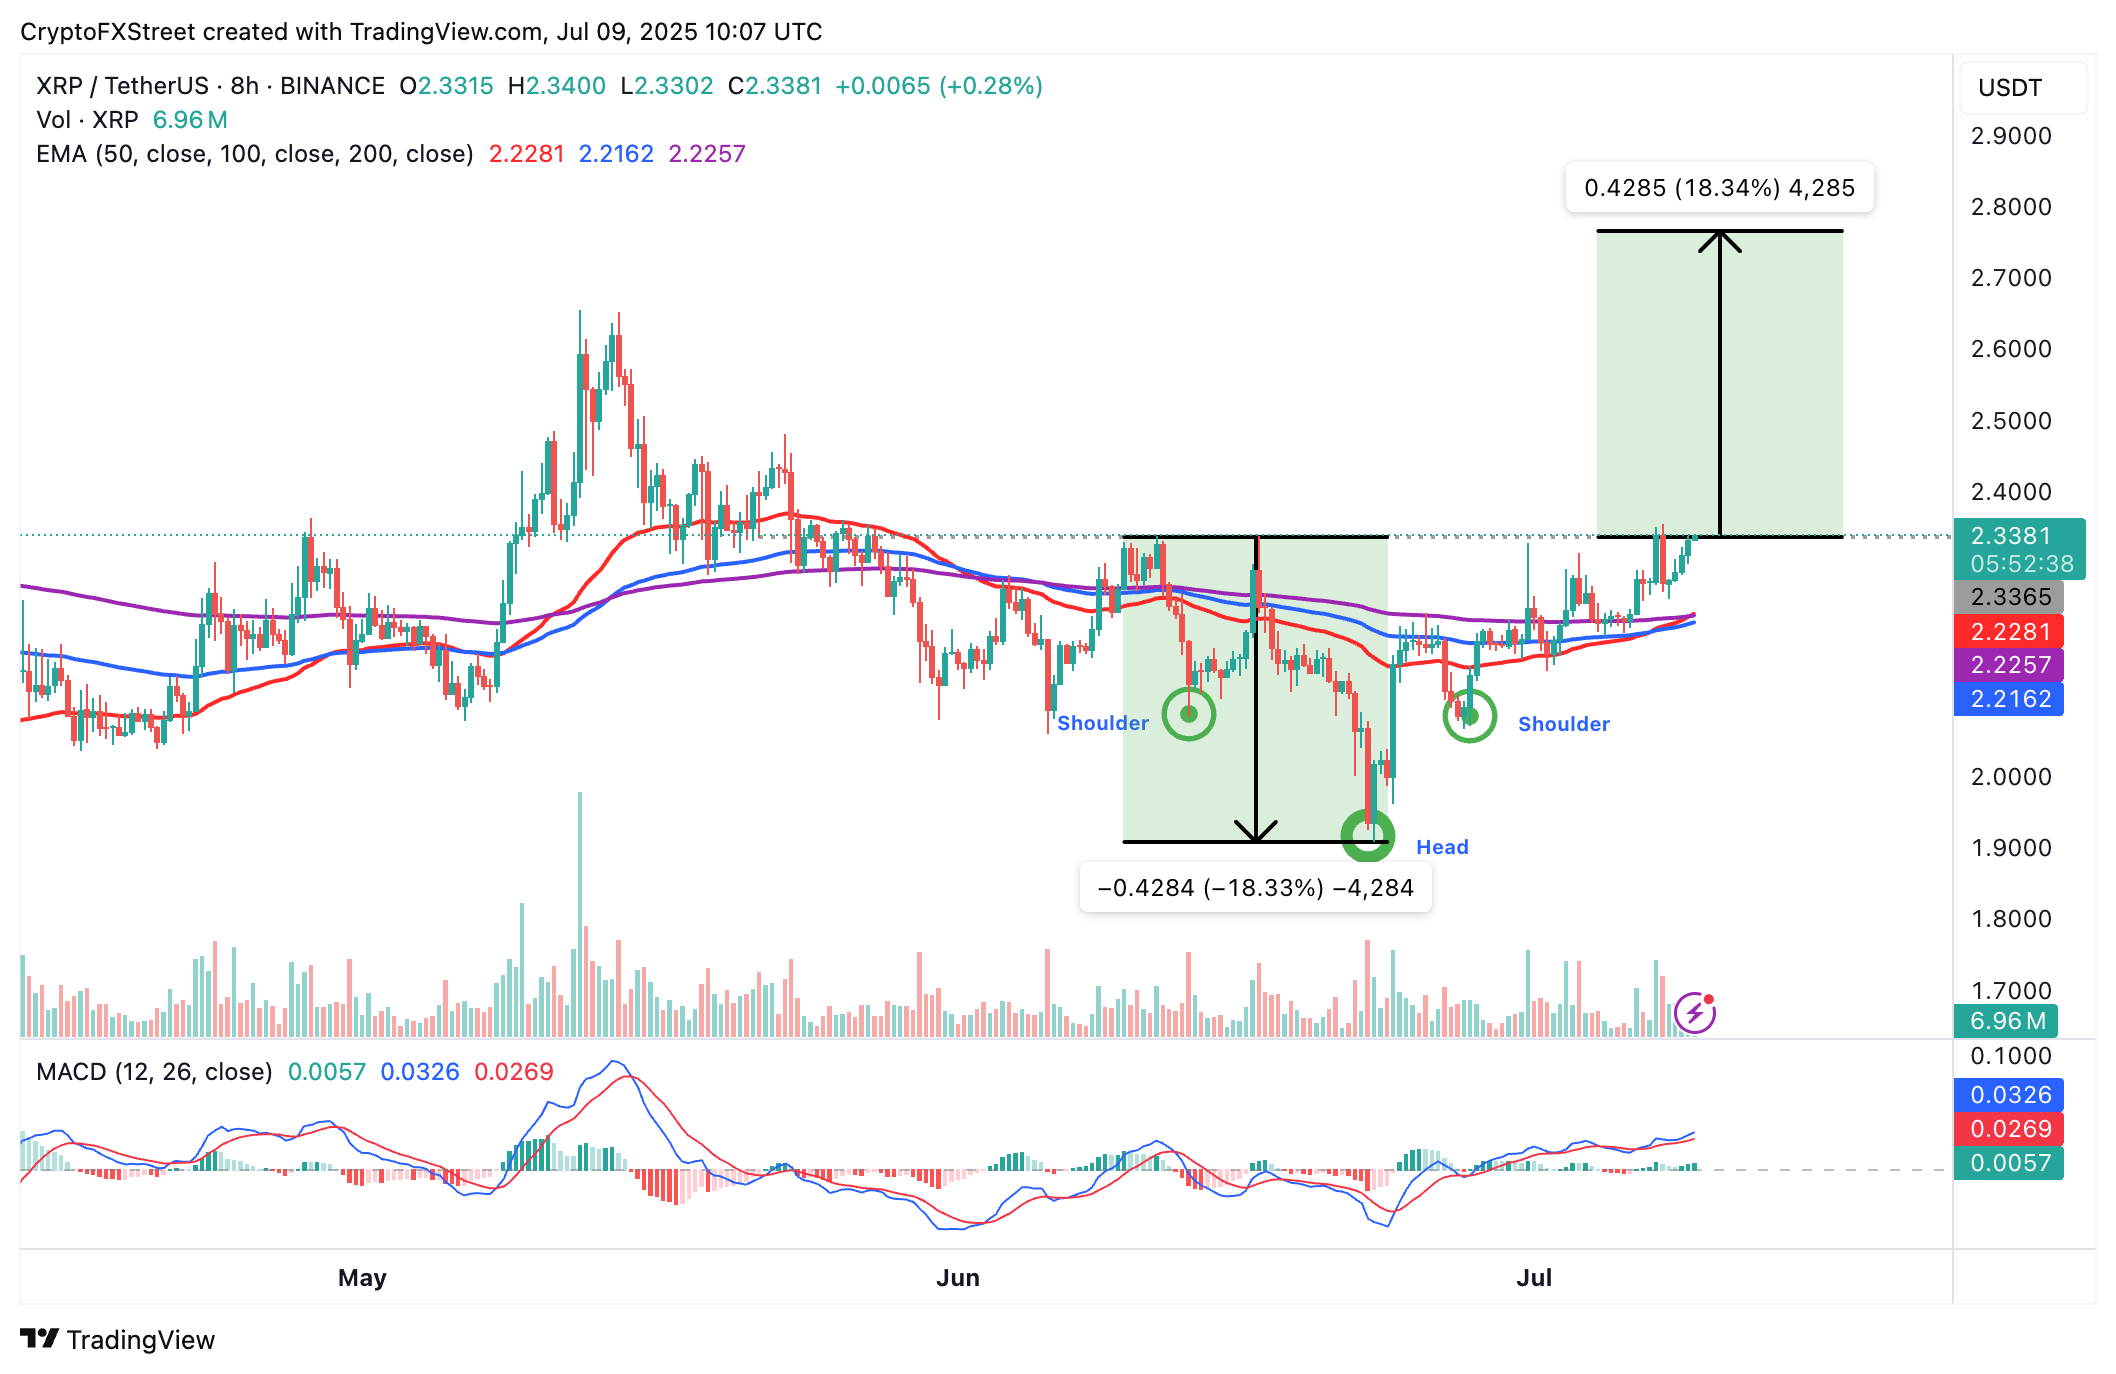
XRP/USDT 8-hour chart
The MACD indicator supports the uptrend with a sustained buy signal that has been in effect since Sunday. Moreover, the 50-period Exponential Moving Average (EMA) crossing above the 200-period EMA, around $2.22 on the daily chart, reinforces the bullish grip.
Cryptocurrency metrics FAQs
What is circulating supply?
The developer or creator of each cryptocurrency decides on the total number of tokens that can be minted or issued. Only a certain number of these assets can be minted by mining, staking or other mechanisms. This is defined by the algorithm of the underlying blockchain technology. On the other hand, circulating supply can also be decreased via actions such as burning tokens, or mistakenly sending assets to addresses of other incompatible blockchains.
What is market capitalization?
Market capitalization is the result of multiplying the circulating supply of a certain asset by the asset’s current market value.
What is trading volume?
Trading volume refers to the total number of tokens for a specific asset that has been transacted or exchanged between buyers and sellers within set trading hours, for example, 24 hours. It is used to gauge market sentiment, this metric combines all volumes on centralized exchanges and decentralized exchanges. Increasing trading volume often denotes the demand for a certain asset as more people are buying and selling the cryptocurrency.
What is the funding rate?
Funding rates are a concept designed to encourage traders to take positions and ensure perpetual contract prices match spot markets. It defines a mechanism by exchanges to ensure that future prices and index prices periodic payments regularly converge. When the funding rate is positive, the price of the perpetual contract is higher than the mark price. This means traders who are bullish and have opened long positions pay traders who are in short positions. On the other hand, a negative funding rate means perpetual prices are below the mark price, and hence traders with short positions pay traders who have opened long positions.
