SPX6900 Primed for Takeoff: Triangle Breakout & Surging Social Buzz Signal Major Bull Run Ahead

Markets whisper—then scream. The SPX6900's tightening triangle pattern isn't just textbook tech; it's a coiled spring.
Social volume spikes like a caffeinated algo trader. Retail's late? Always. But the charts don't lie.
Breakout mechanics: When symmetrical triangles resolve, they move hard. Measured targets suggest 20%+ upside if resistance cracks—and sentiment's already leaning greedy.
Warning lights: Every 'can't miss' trade has blown up hedge funds before. (See: 2022's 'inflation transitory' crowd.) But this time? The technicals smell like 2021's bull trap... or 2025's rocket fuel.
Close: Whether you're frontrunning or fading, one truth remains—Wall Street sells shovels, but crypto's still digging graves and gold mines in equal measure.
SPX social dominance hits a two-month high
The social dominance of SPX6900 refers to the share of SPX-related discussions in the cryptocurrency media. Santiment’s data indicates that, out of all the crypto media discussions, SPX’s share is 0.913%, a three-month high.
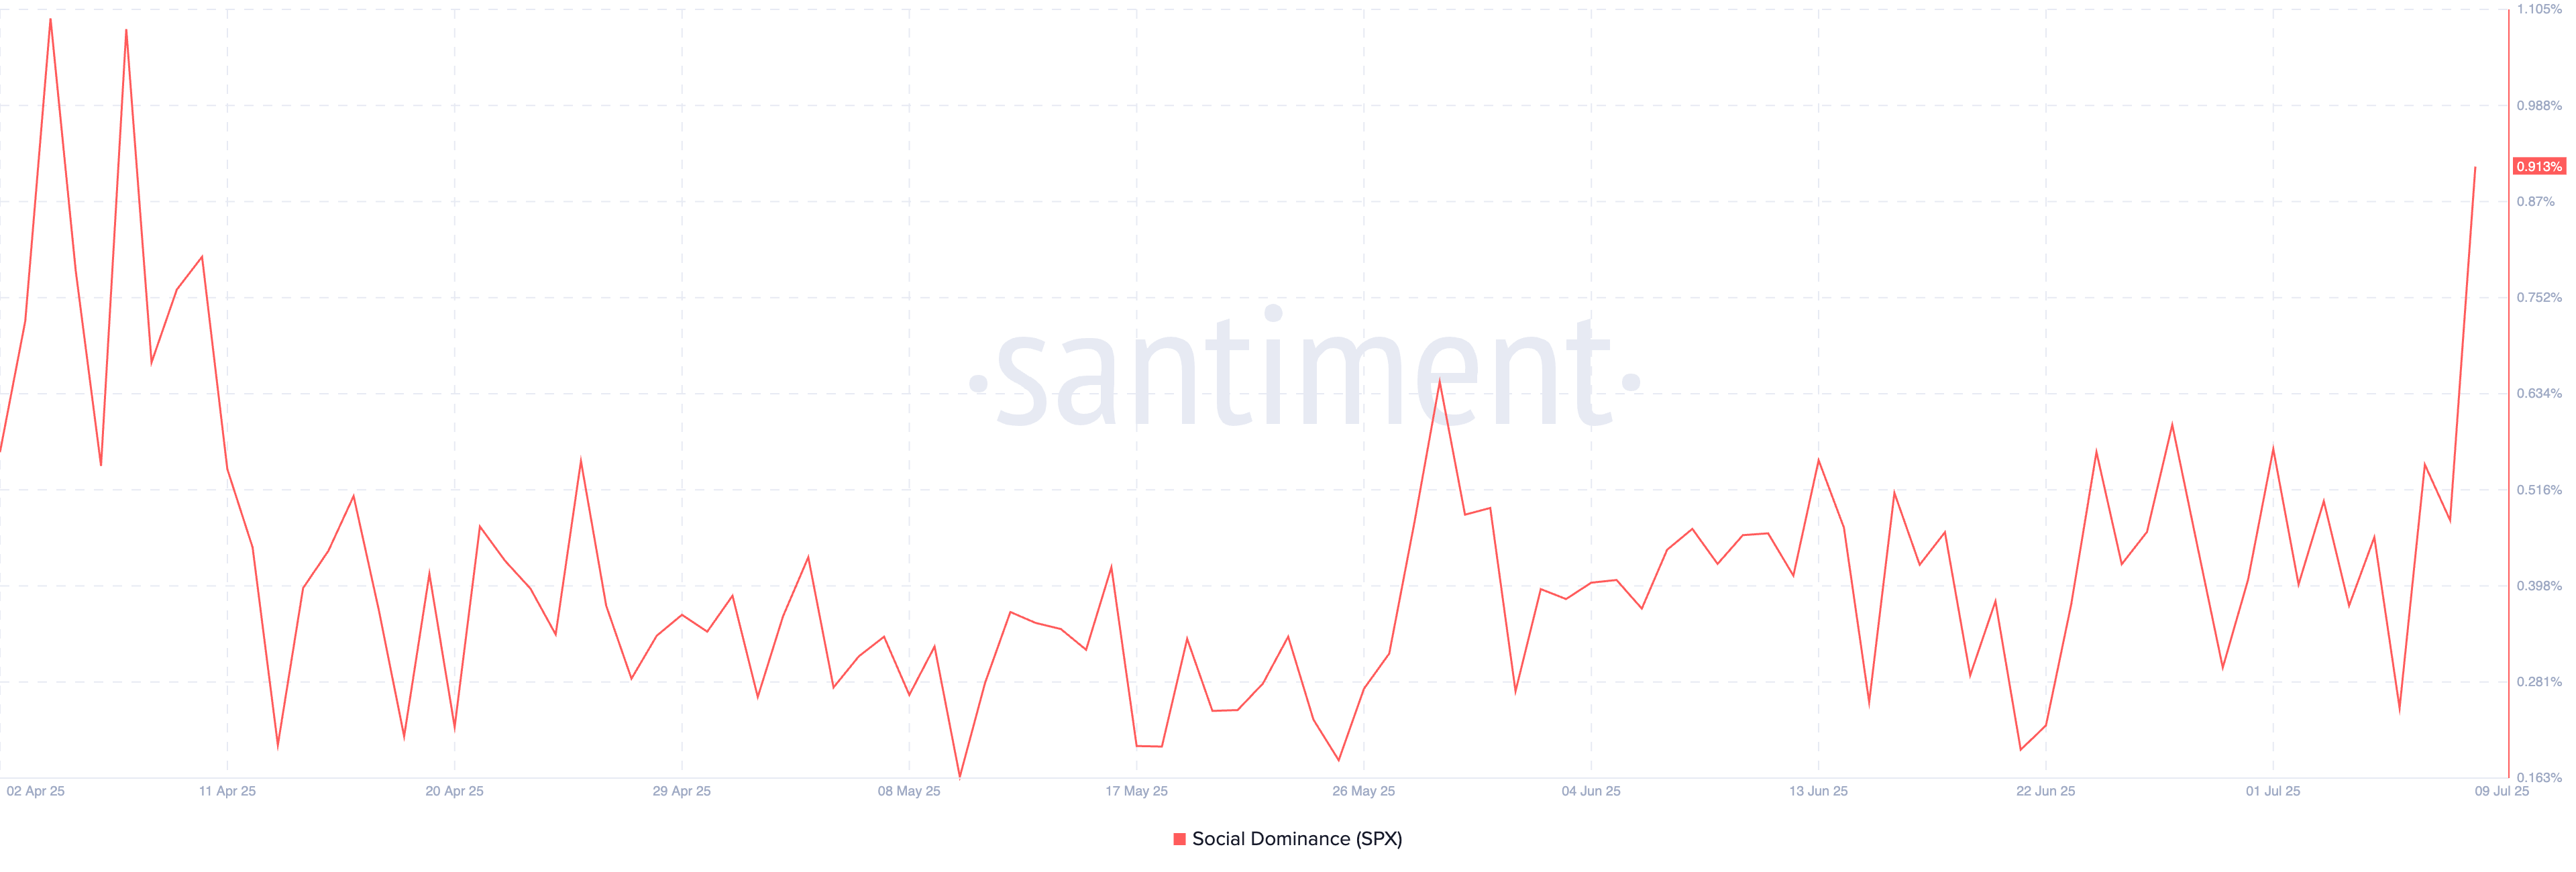
SPX social dominance. Source: Santiment
As social chatter around the meme coin intensifies, the chances of a hype-driven rally increase. However, investors must remain cautious, as the surge in retail demand has historically served as an exit liquidity for large and early investors.
Derivatives data signals heightened optimism
CoinGlass’ data shows a 23.53% rise in SPX Open Interest (OI) over the last 24 hours, reaching $148.84 million. An OI spike refers to an increase in buying activity in the derivatives market as traders anticipate further gains in the asset.
In alignment with the OI surge, the OI-weighted funding rate flips positive to 0.0056%, suggesting a boost in bullish activity. Traders with bullish positions pay the funding rate, if positive, to sellers to balance the swap and spot prices and vice versa.
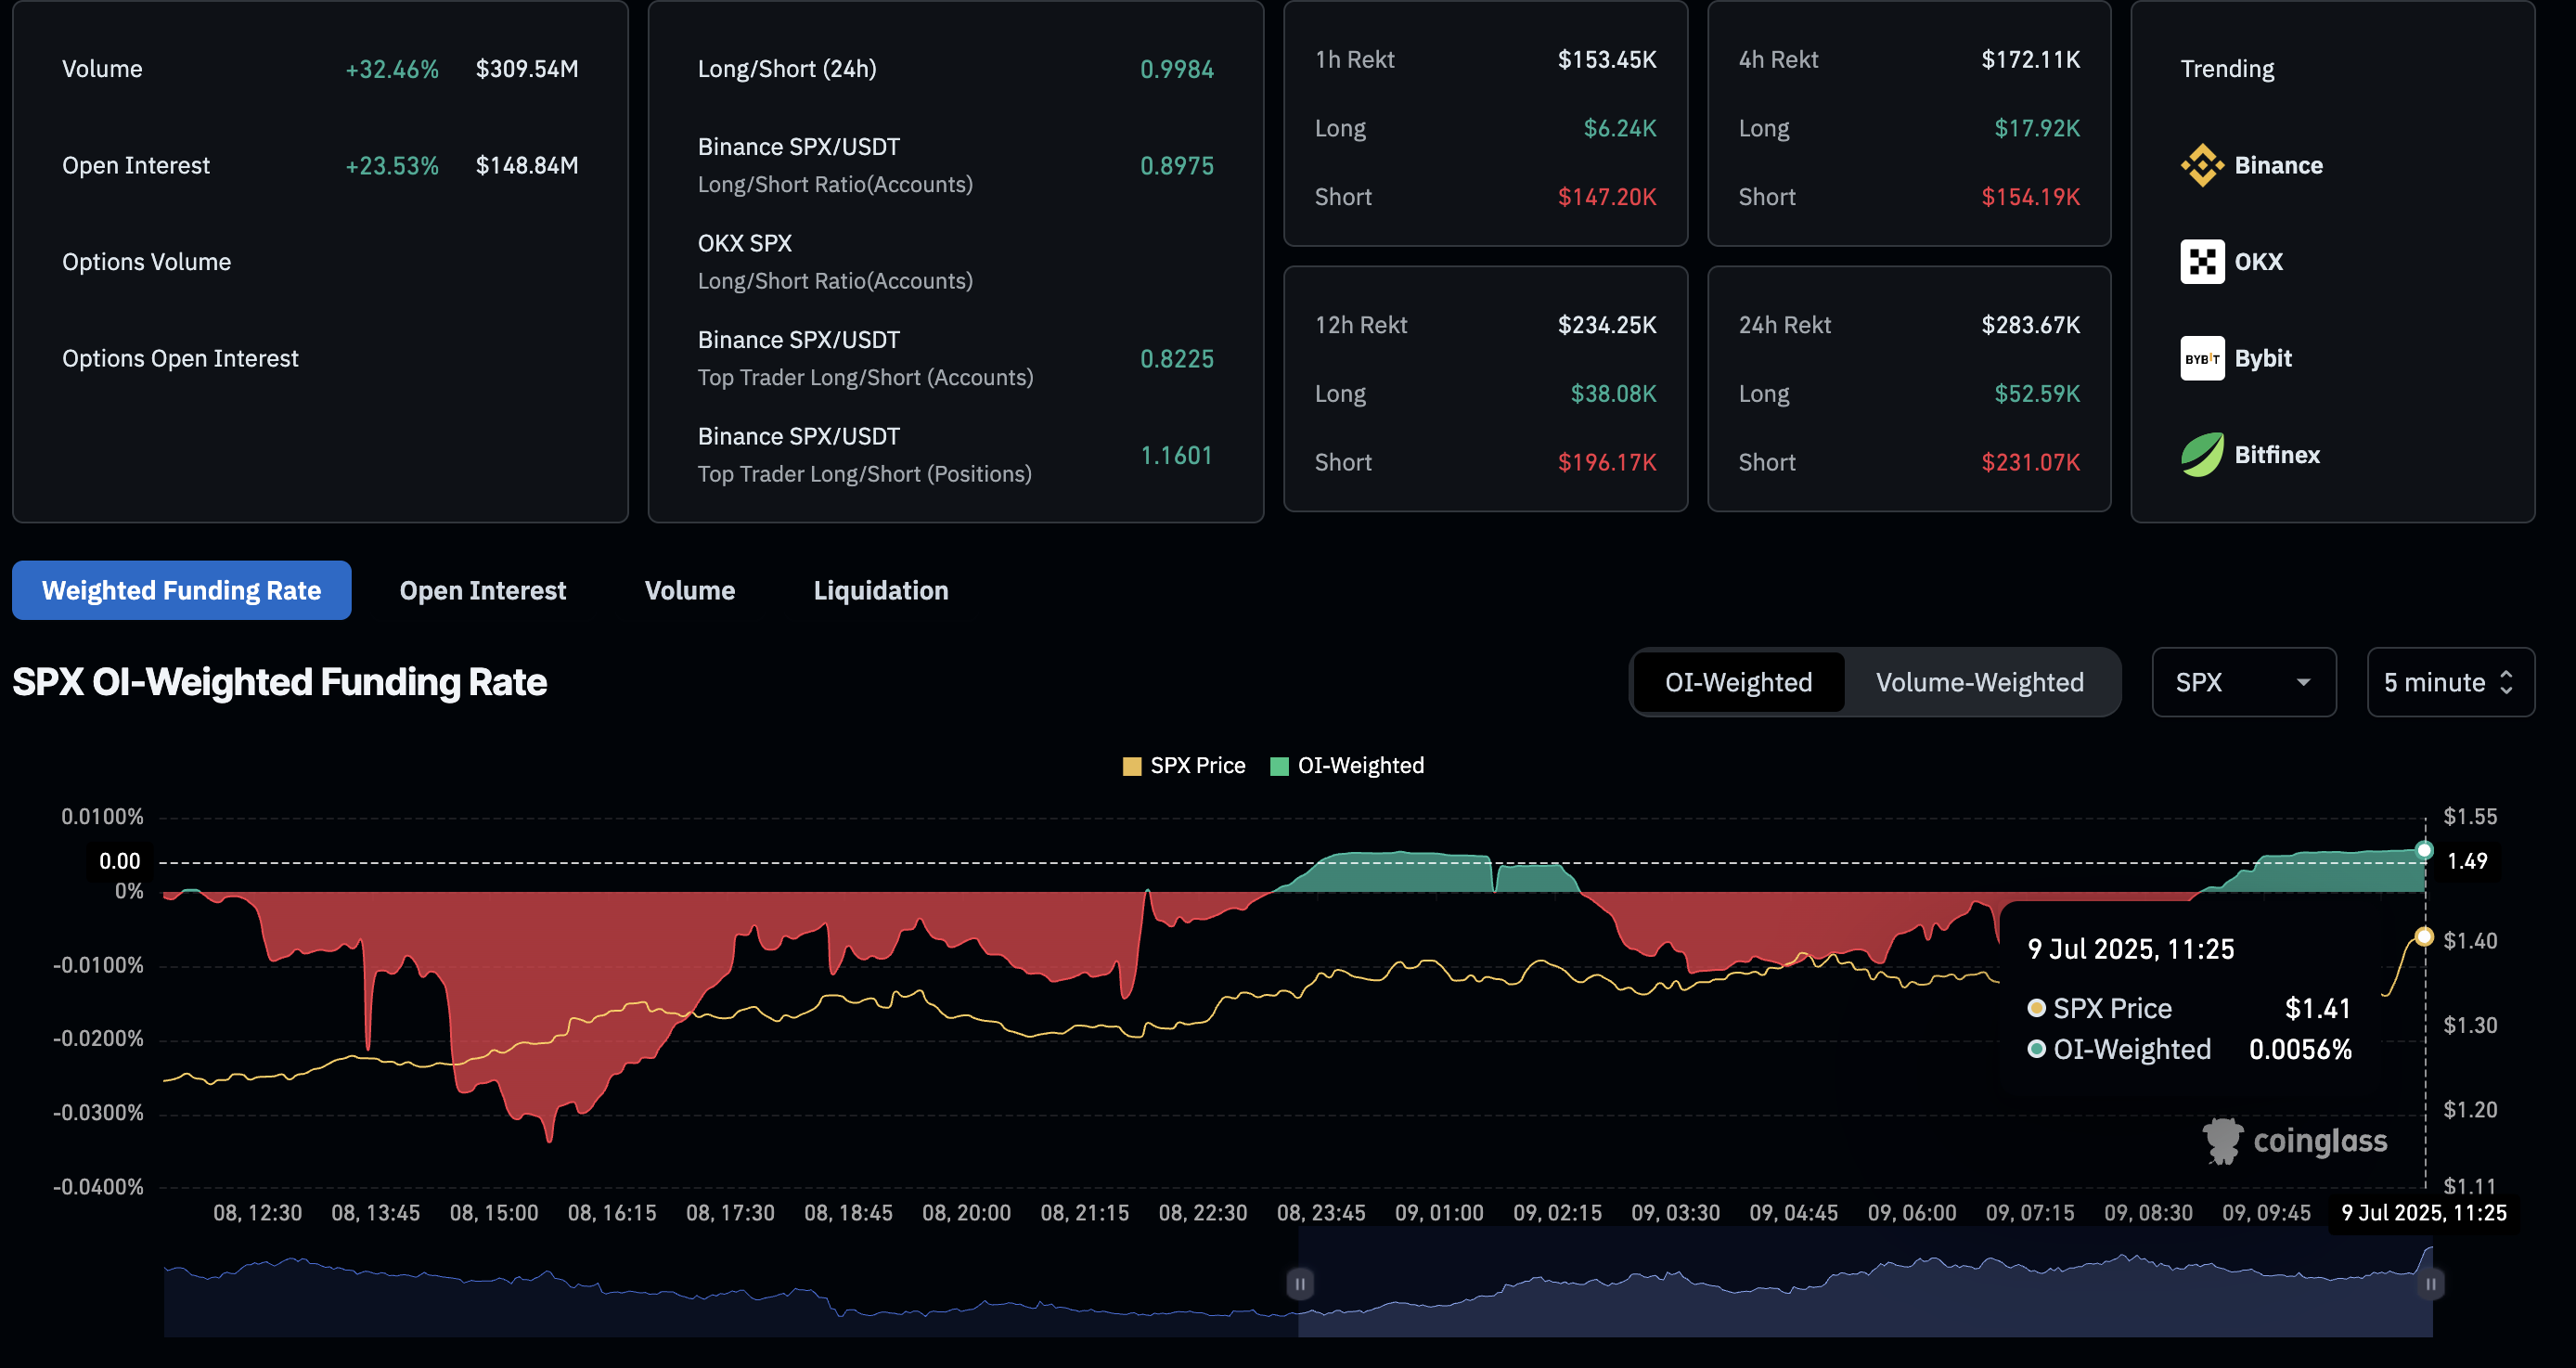
SPX Derivatives. Source: Coinglass
SPX’s potential triangle breakout eyes $1.74
SPX appreciates by over 4% on the day, building on the 8.44% rise from the previous day. The meme coin trades above the $1.35 supply zone and is close to marking the breakout of an ascending triangle pattern.
Price action has created an ascending triangle pattern on the 4-hour chart, with a support trendline formed by connecting the bottoms on January 21 and July 1, and the $1.35 zone serving as the upper boundary.
A daily close above the $1.35 zone could propel SPX towards the 78.6% Fibonacci level at $1.56, drawn from the June 11 high of $1.74 to the June 21 low of $0.91.
The technical indicators display a gradual increase in momentum, with the Relative Strength Index (RSI) at 63, approaching the overbought zone. The Moving Average Convergence/Divergence (MACD) indicator displays a rising trend, indicated by green histogram bars and the average lines.
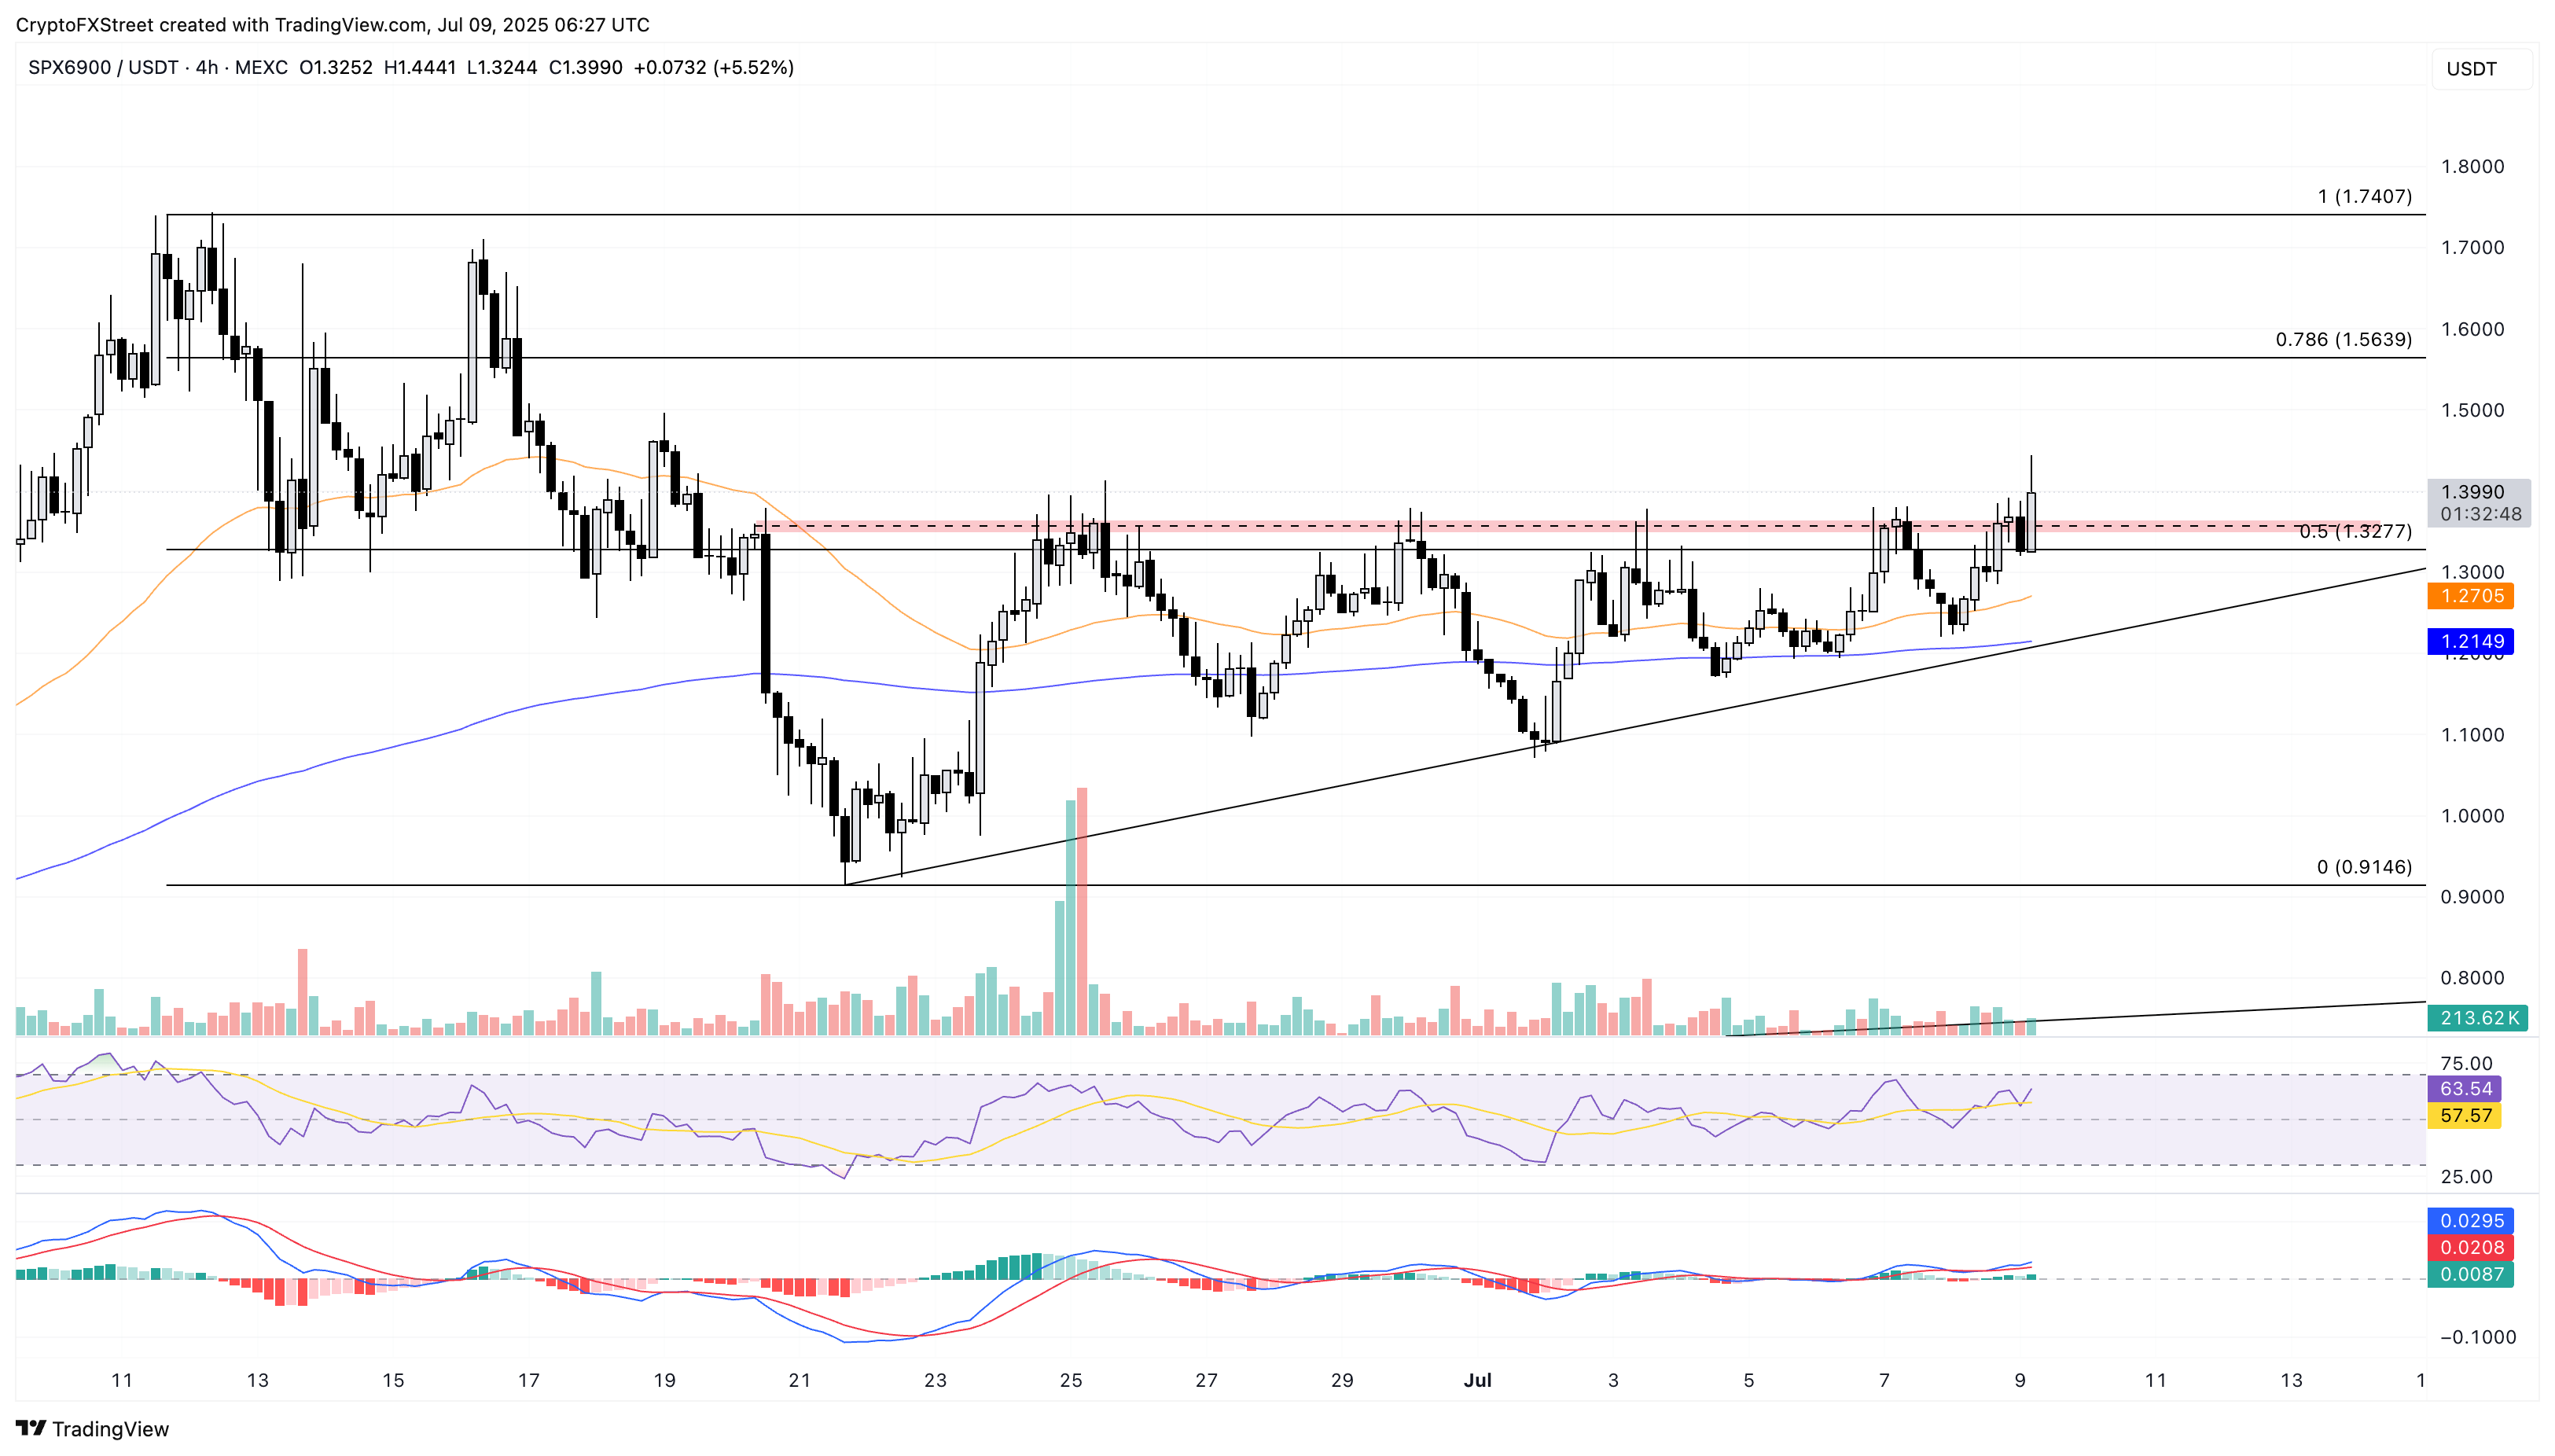
SPX/USDT daily price chart.
If SPX fails to fix above the $1.35 supply zone, a reversal within the triangle pattern could retest the support trendline NEAR $1.21.

Log in to Reply
Log in to comment your thoughtsComments
Related Articles
|Square
Get the BTCC app to start your crypto journey
Get started today Scan to join our 100M+ users