🚀 Crypto Resilience: Bitcoin, Ethereum, XRP Defy Tariff Chaos With Bullish Rebound Potential | July 2025

Crypto markets shrug off geopolitical noise as major players flash recovery signals.
The Big Three Flex Their Muscle
Bitcoin claws back above key psychological levels while Ethereum's smart contract dominance remains unchallenged. XRP—the perpetual underdog—quietly builds momentum despite regulators playing whack-a-mole with crypto projects.
Tariffs? What Tariffs?
Traders yawn at renewed trade war headlines, proving digital assets increasingly decouple from traditional market tantrums. (Meanwhile, legacy finance still can't decide if crypto is a threat or just their next fee-generating product.)
The Bottom Line
This isn't 2021's reckless euphoria—it's a measured march toward price discovery. The real question isn't if crypto recovers, but how fast Wall Street tries to co-opt the revolution after fighting it for a decade.
Market update: Tariff tensions keep Bitcoin and altcoins on edge
US President Donald Trump’s announced 90-day tariff pause is set to end on Wednesday, with countries yet to strike trade deals likely to receive letters detailing higher rates expected to take effect on August 1. CNN reported on Tuesday that some countries have already been notified of the high tariff rates, which could reach as high as 40%.
China has cautioned the US against reigniting trade tensions by reinstating tariffs on its goods, effective August 1. The Asian economic giant has vowed to retaliate against countries that cut trade deals with the US in a way that undermines Beijing’s interests, according to a Reuters report.
The US and China agreed on a trade framework following negotiations in June, which restored a delicate truce. However, details of the trade agreement remain unclear, leaving traders from both nations in a state of uncertainty.
US President TRUMP has hinted at an additional 10% tariff on countries allied with the BRICS economic movement.
Data spotlight: Institutional interest remains high with Bitcoin spot ETF inflows
Digital asset products saw $1.04 billion in weekly inflows, according to the CoinShares report, which is released every Monday. Bitcoin-related financial products recorded $790 million in inflows last week, with approximately $226 million going into Ethereum investment assets.
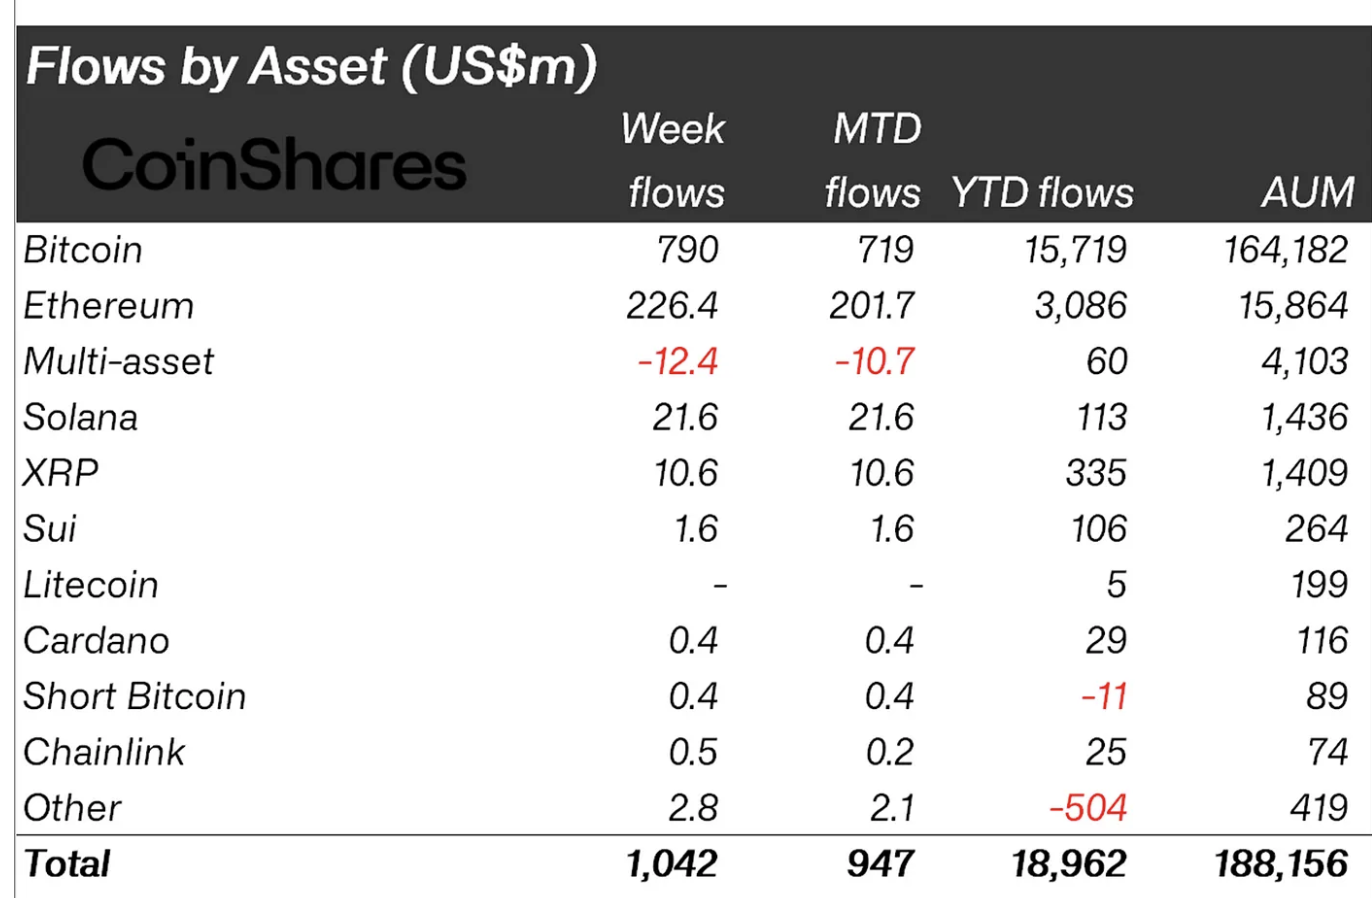
Digital asset products flows stats: Source: CoinShares
Despite the positive flows, CoinShares noted a slowdown from the previous three weeks, which averaged $1.5 billion, citing a cautious approach by investors as the price approaches all-time highs.
“The moderation in inflows suggests that investors are becoming more cautious as bitcoin approaches its all-time high price levels,” the CoinShares report states.
Bitcoin spot Exchange Traded Funds (ETFs) have maintained positive daily inflows since July 2, posting approximately $217 million in net inflow volume on Monday.
The cumulative total net inflow is nearing the $50 billion mark, but stood at $49.86 billion as of Monday. The total net assets for the 12 spot ETFs licensed in the US are around $136 billion, according to SoSoValue.
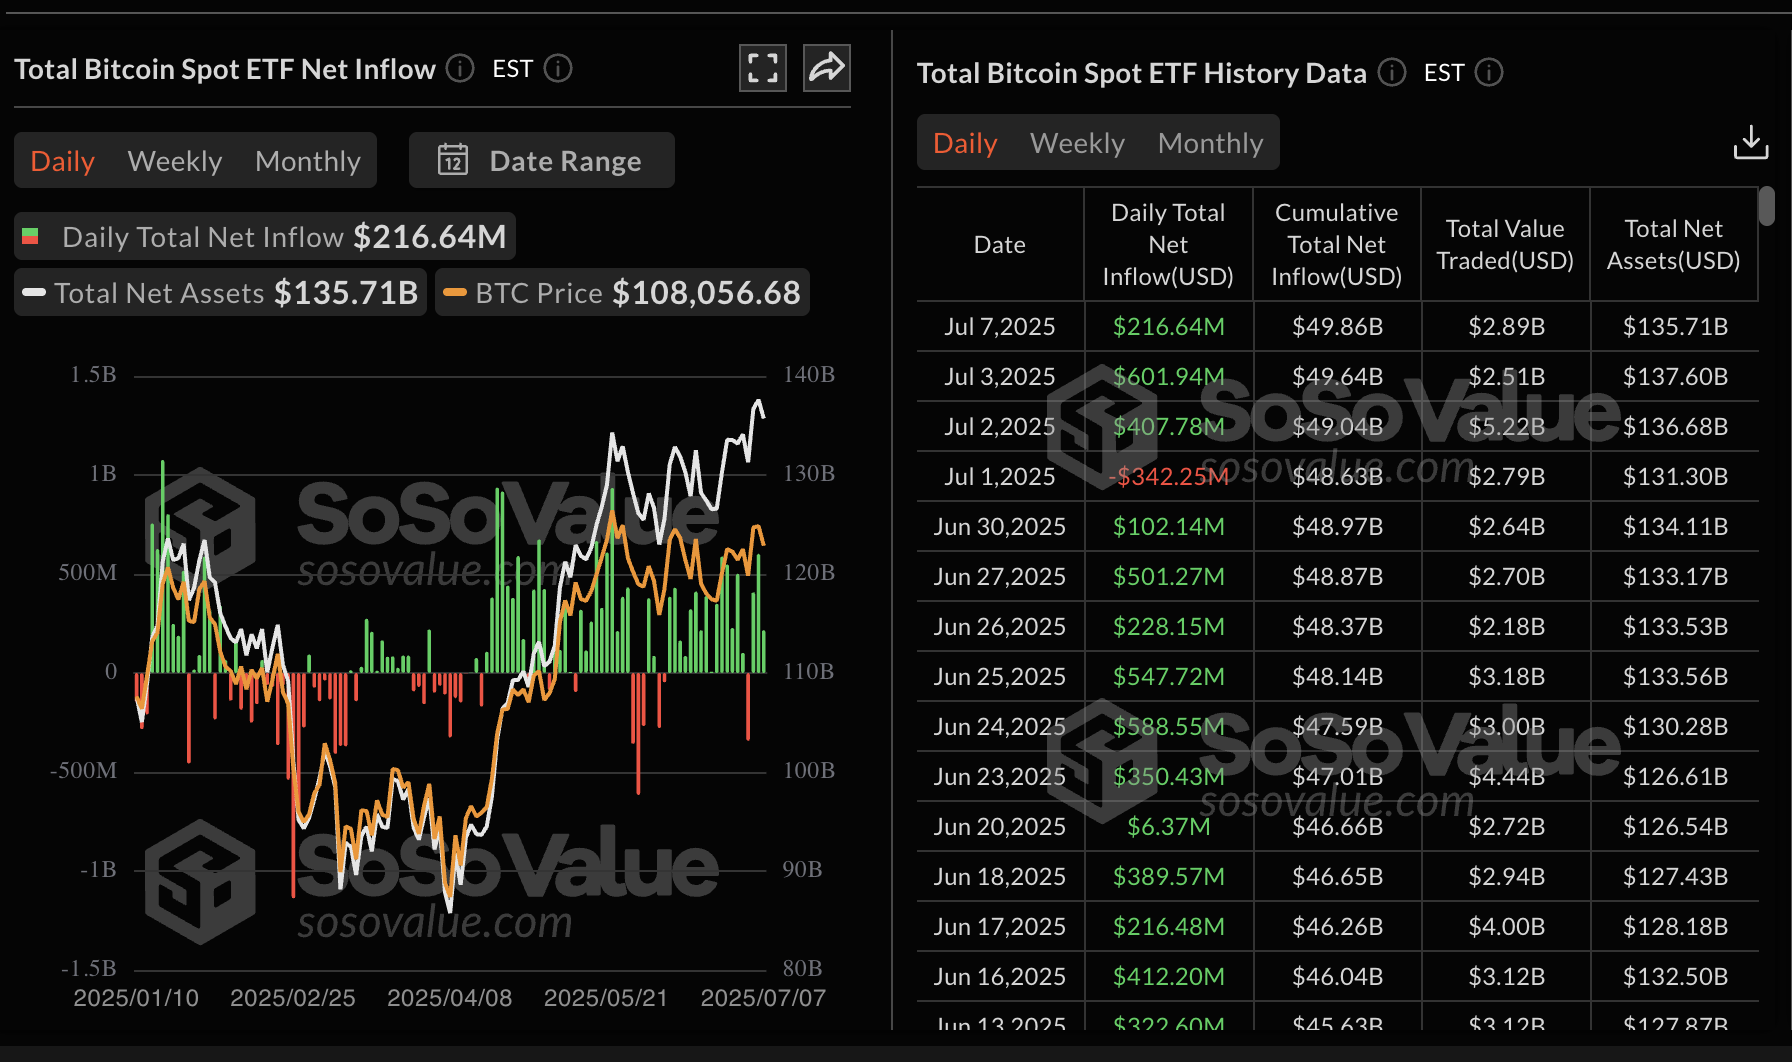
Bitcoin spot ETF data | Source: SoSoValue
Chart of the day: Bitcoin offers mixed technical signals
Bitcoin’s price is trading at around $108,441 at the time of writing as it recovers from intraday lows of $107,429. The largest crypto by market capitalization holds above a recently broken descending trendline.
If the price can stabilize above this level, bulls will have ample time to collect liquidity ahead of another attempt to break the resistance at around $110,527, which capped the price action last week.
Bitcoin also holds significantly above key moving averages, including the 50-day Exponential Moving Average (EMA), currently at $105,259, the 100-day EMA at $101,500 and the 200-day EMA at $95,641. This outlook backs the notion of a stable technical structure, which could predispose Bitcoin to further gains and also serve as tentative support levels in the event of a trend reversal.
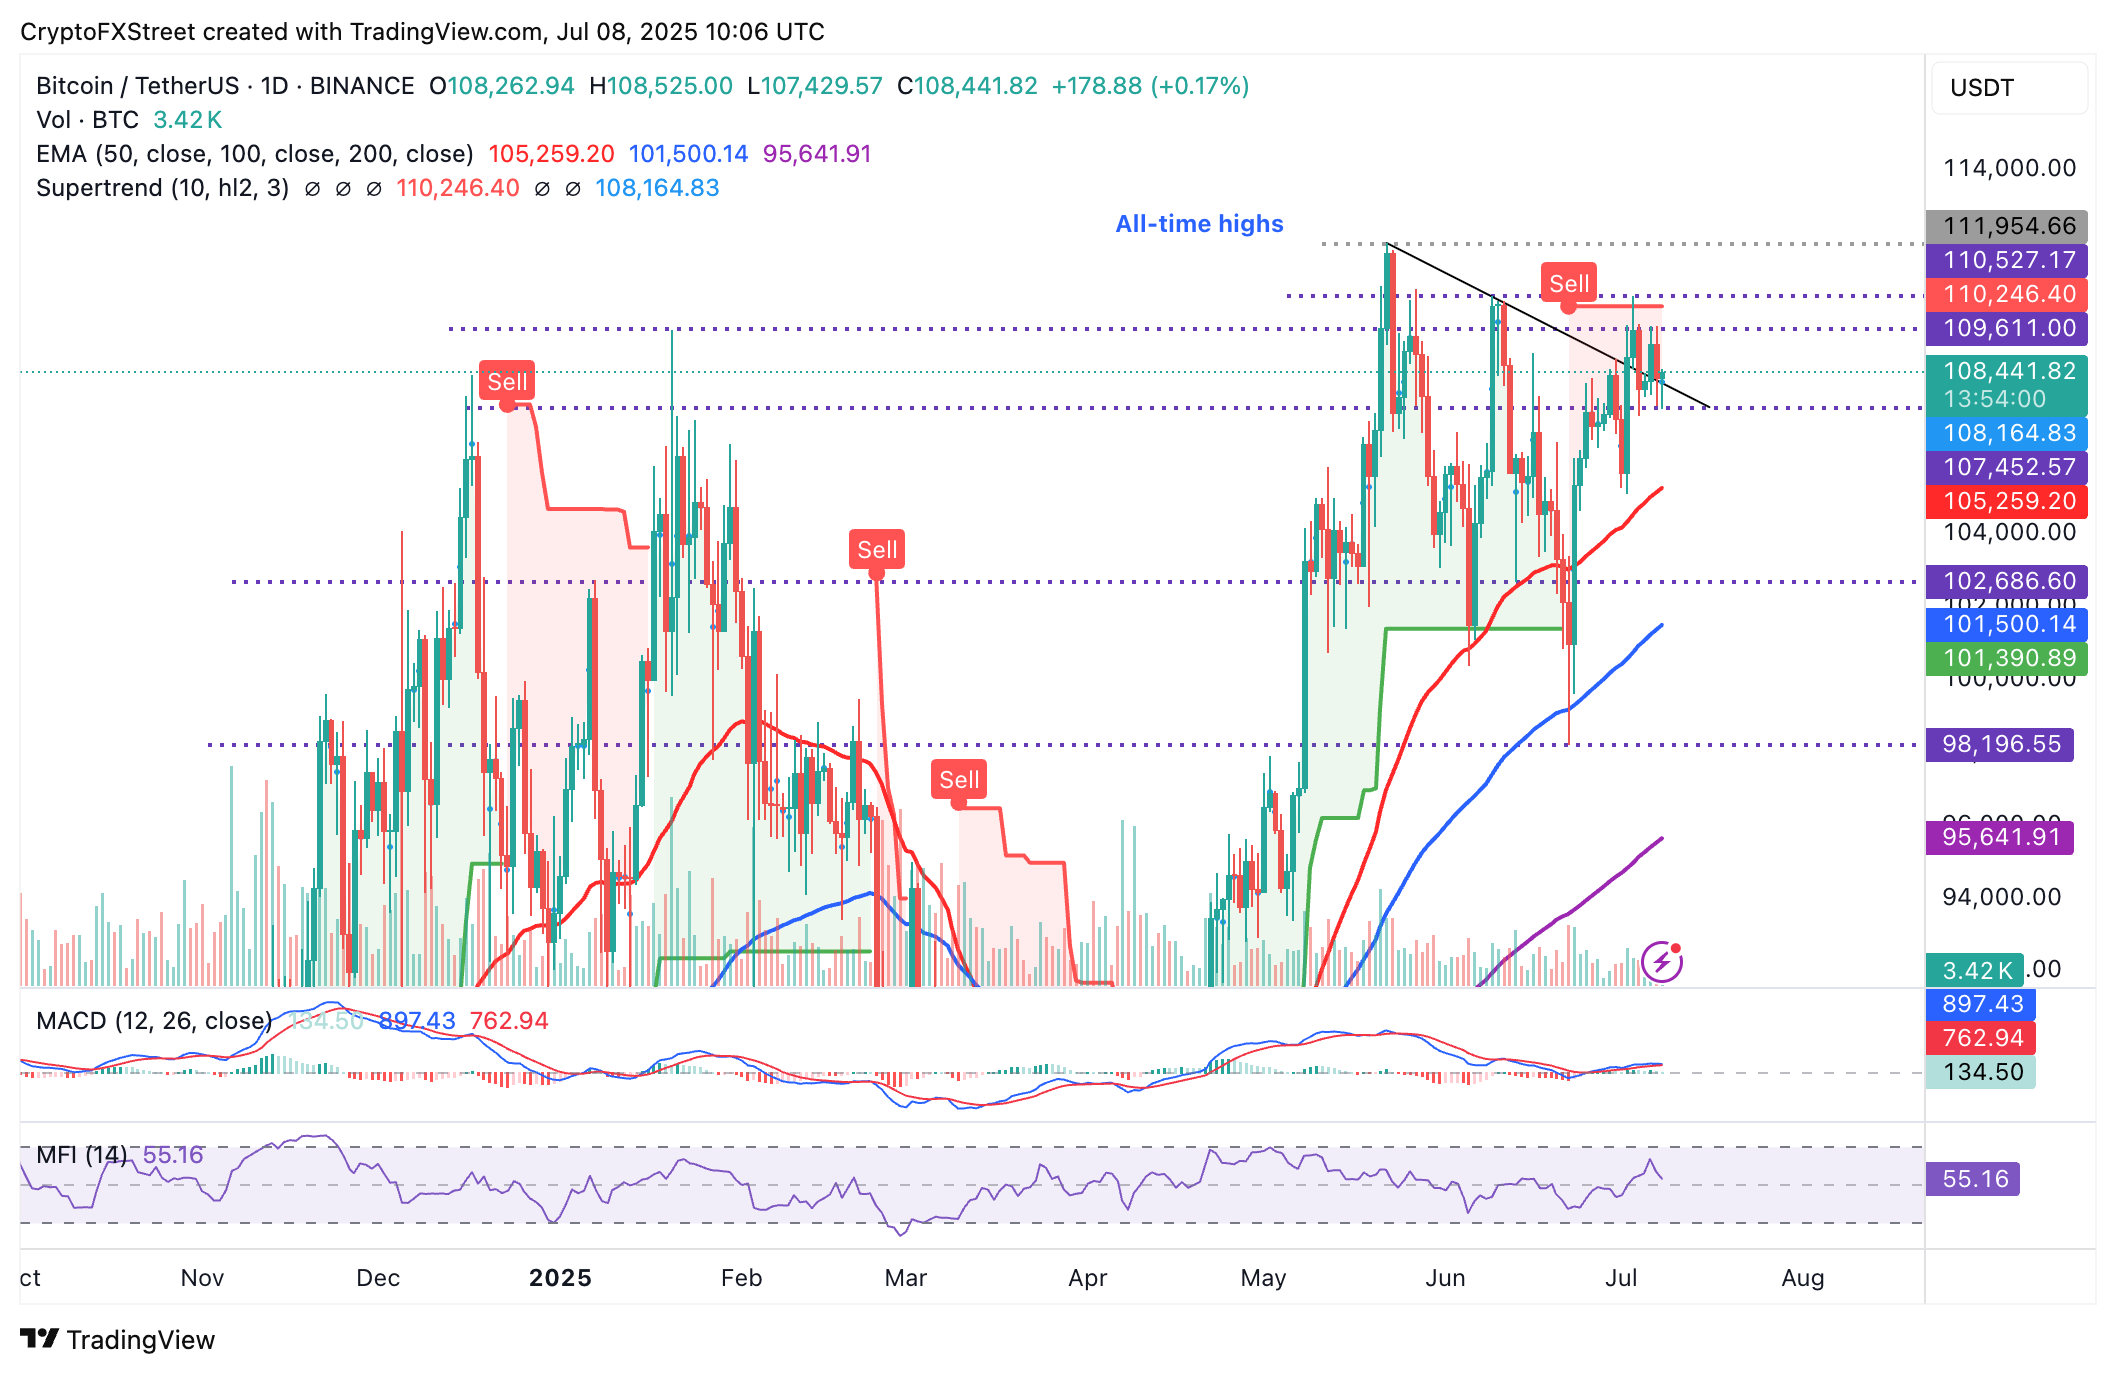
BTC/USDT daily chart
The path of least resistance appears upward based on a slightly bullish bias portrayed by the Moving Average Convergence Divergence (MACD) indicator’s buy signal. Traders tend to seek exposure with the blue MACD line holding above the red signal line.
Still, the downward-trending movement of the Money FLOW Index (MFI) at 55 indicates that money is leaving Bitcoin, which could hinder the expected bullish breakout.
Altcoins update: Ethereum, XRP consolidation extends
Ethereum’s price has maintained a bullish outlook, even as it consolidates broadly above the support provided by key moving averages, including the 200-day EMA currently at $2,474, the 50-day EMA at $ 2,458 and the 100-day EMA at $2,402.
The MACD indicator provides a bullish signal, as the blue line remains above the red signal line. Traders should maintain their exposure as long as the MACD indicator remains trending upward, which encourages a risk-on sentiment.
A breakout above the resistance highlighted at $2,633, which was tested on Thursday, could expand the bullish scope toward $2,880, the level that capped the price in June, and the round-figure psychological resistance at $3,000.
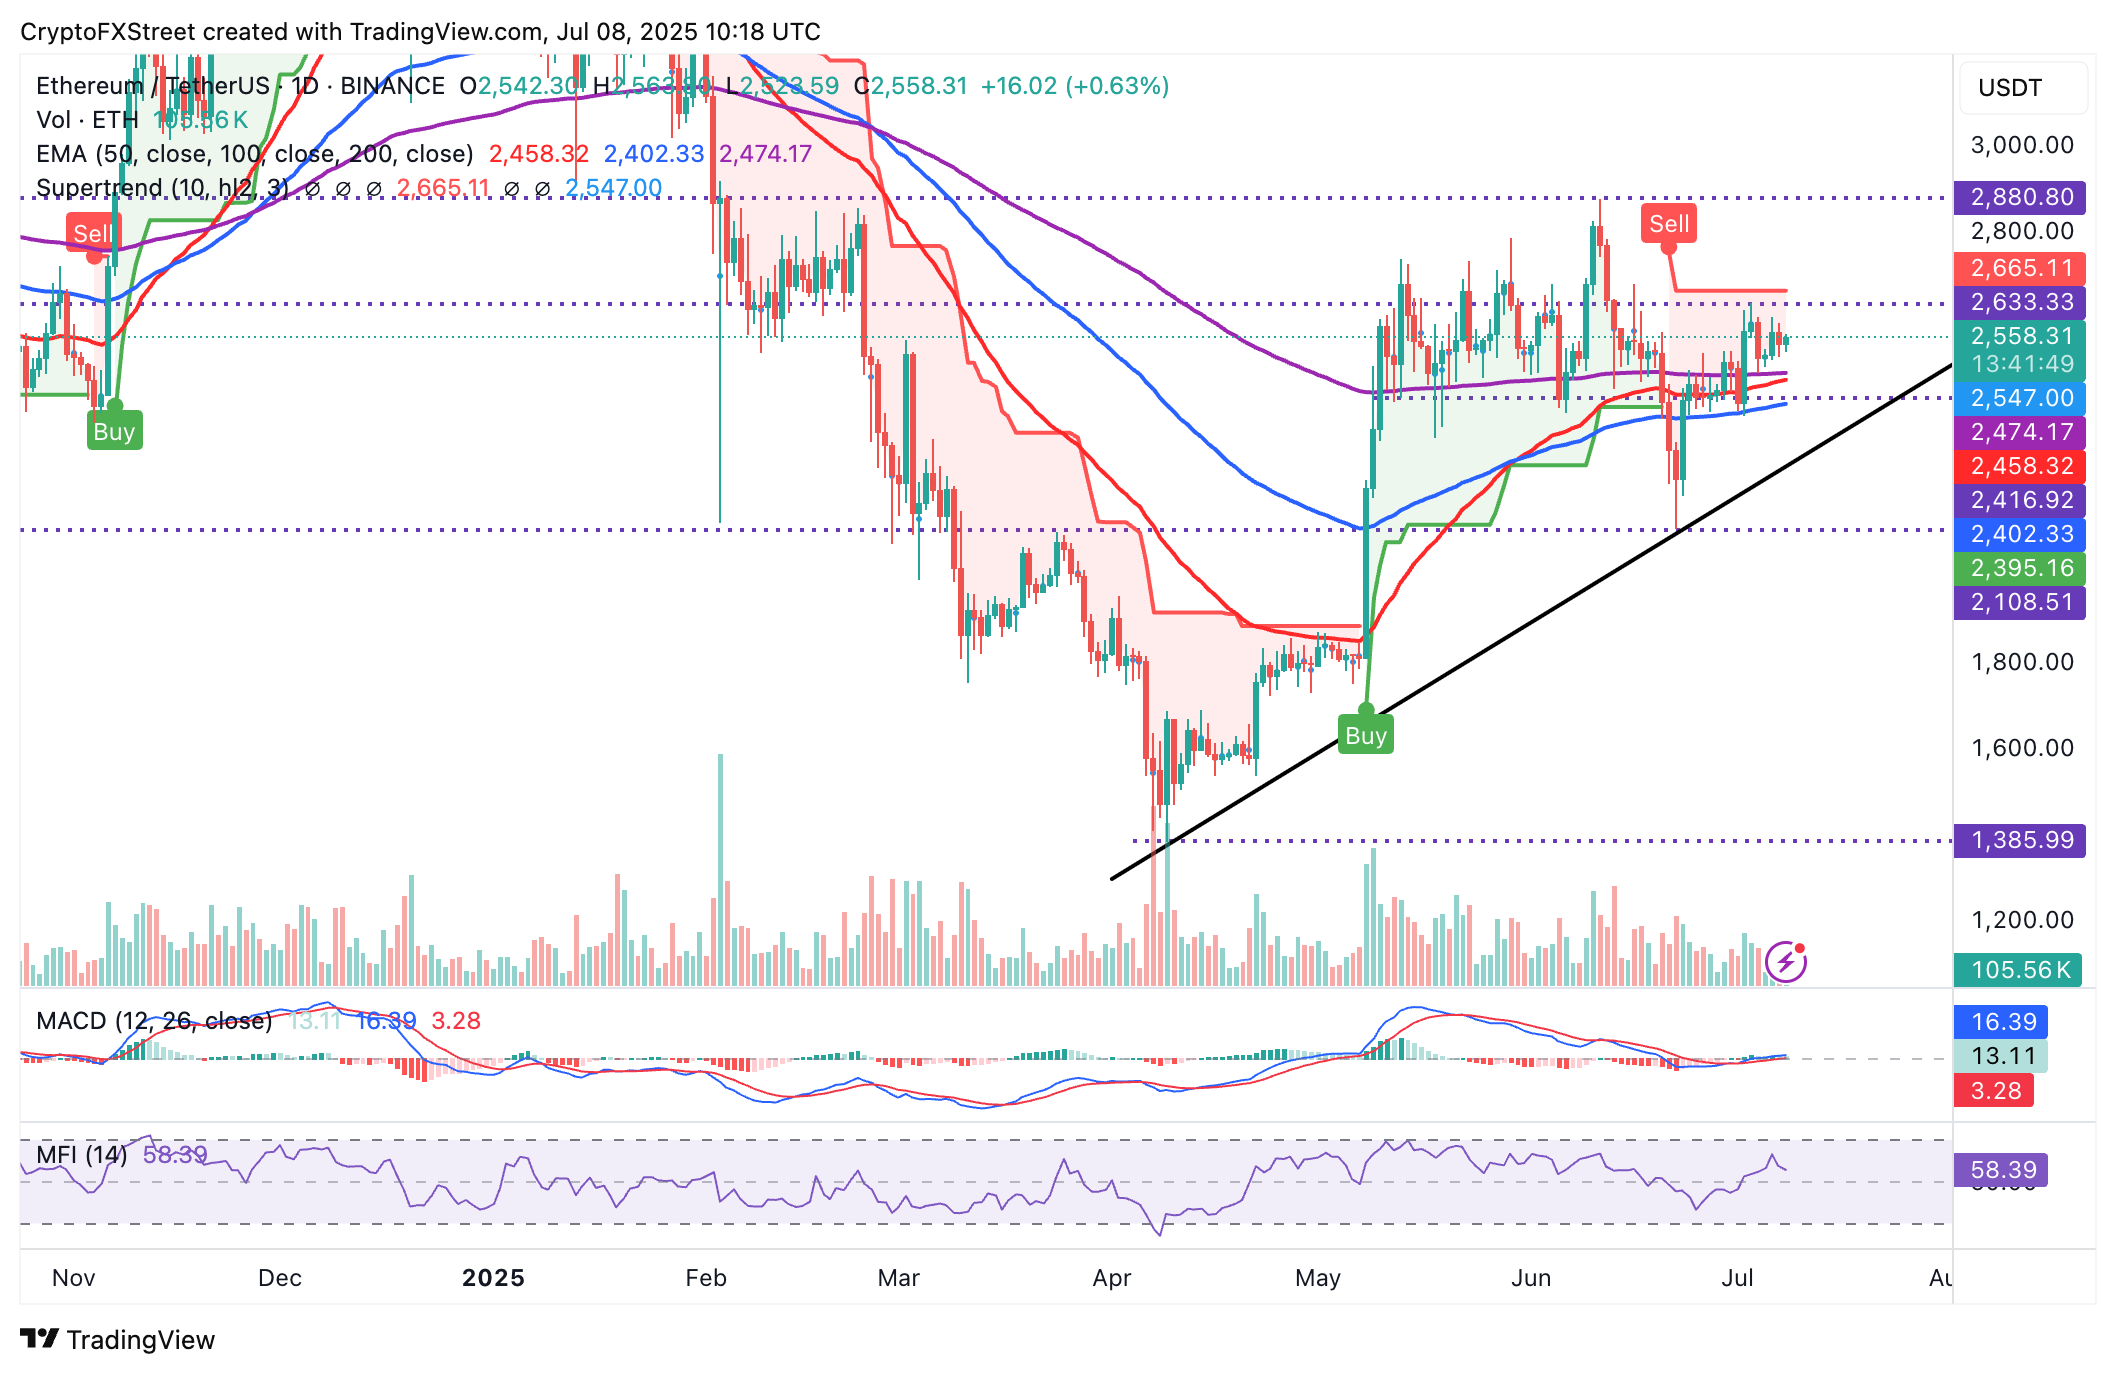
ETH/USDT daily chart
As for XRP, bulls remain in control, with the price hovering at around $2.29. The path of least resistance appears to be upward, with the MACD indicator displaying a buy signal since Saturday. Support is provided by the 100-day EMA, currently at $2.22, and the 50-day EMA, which is slightly below at $2.21.
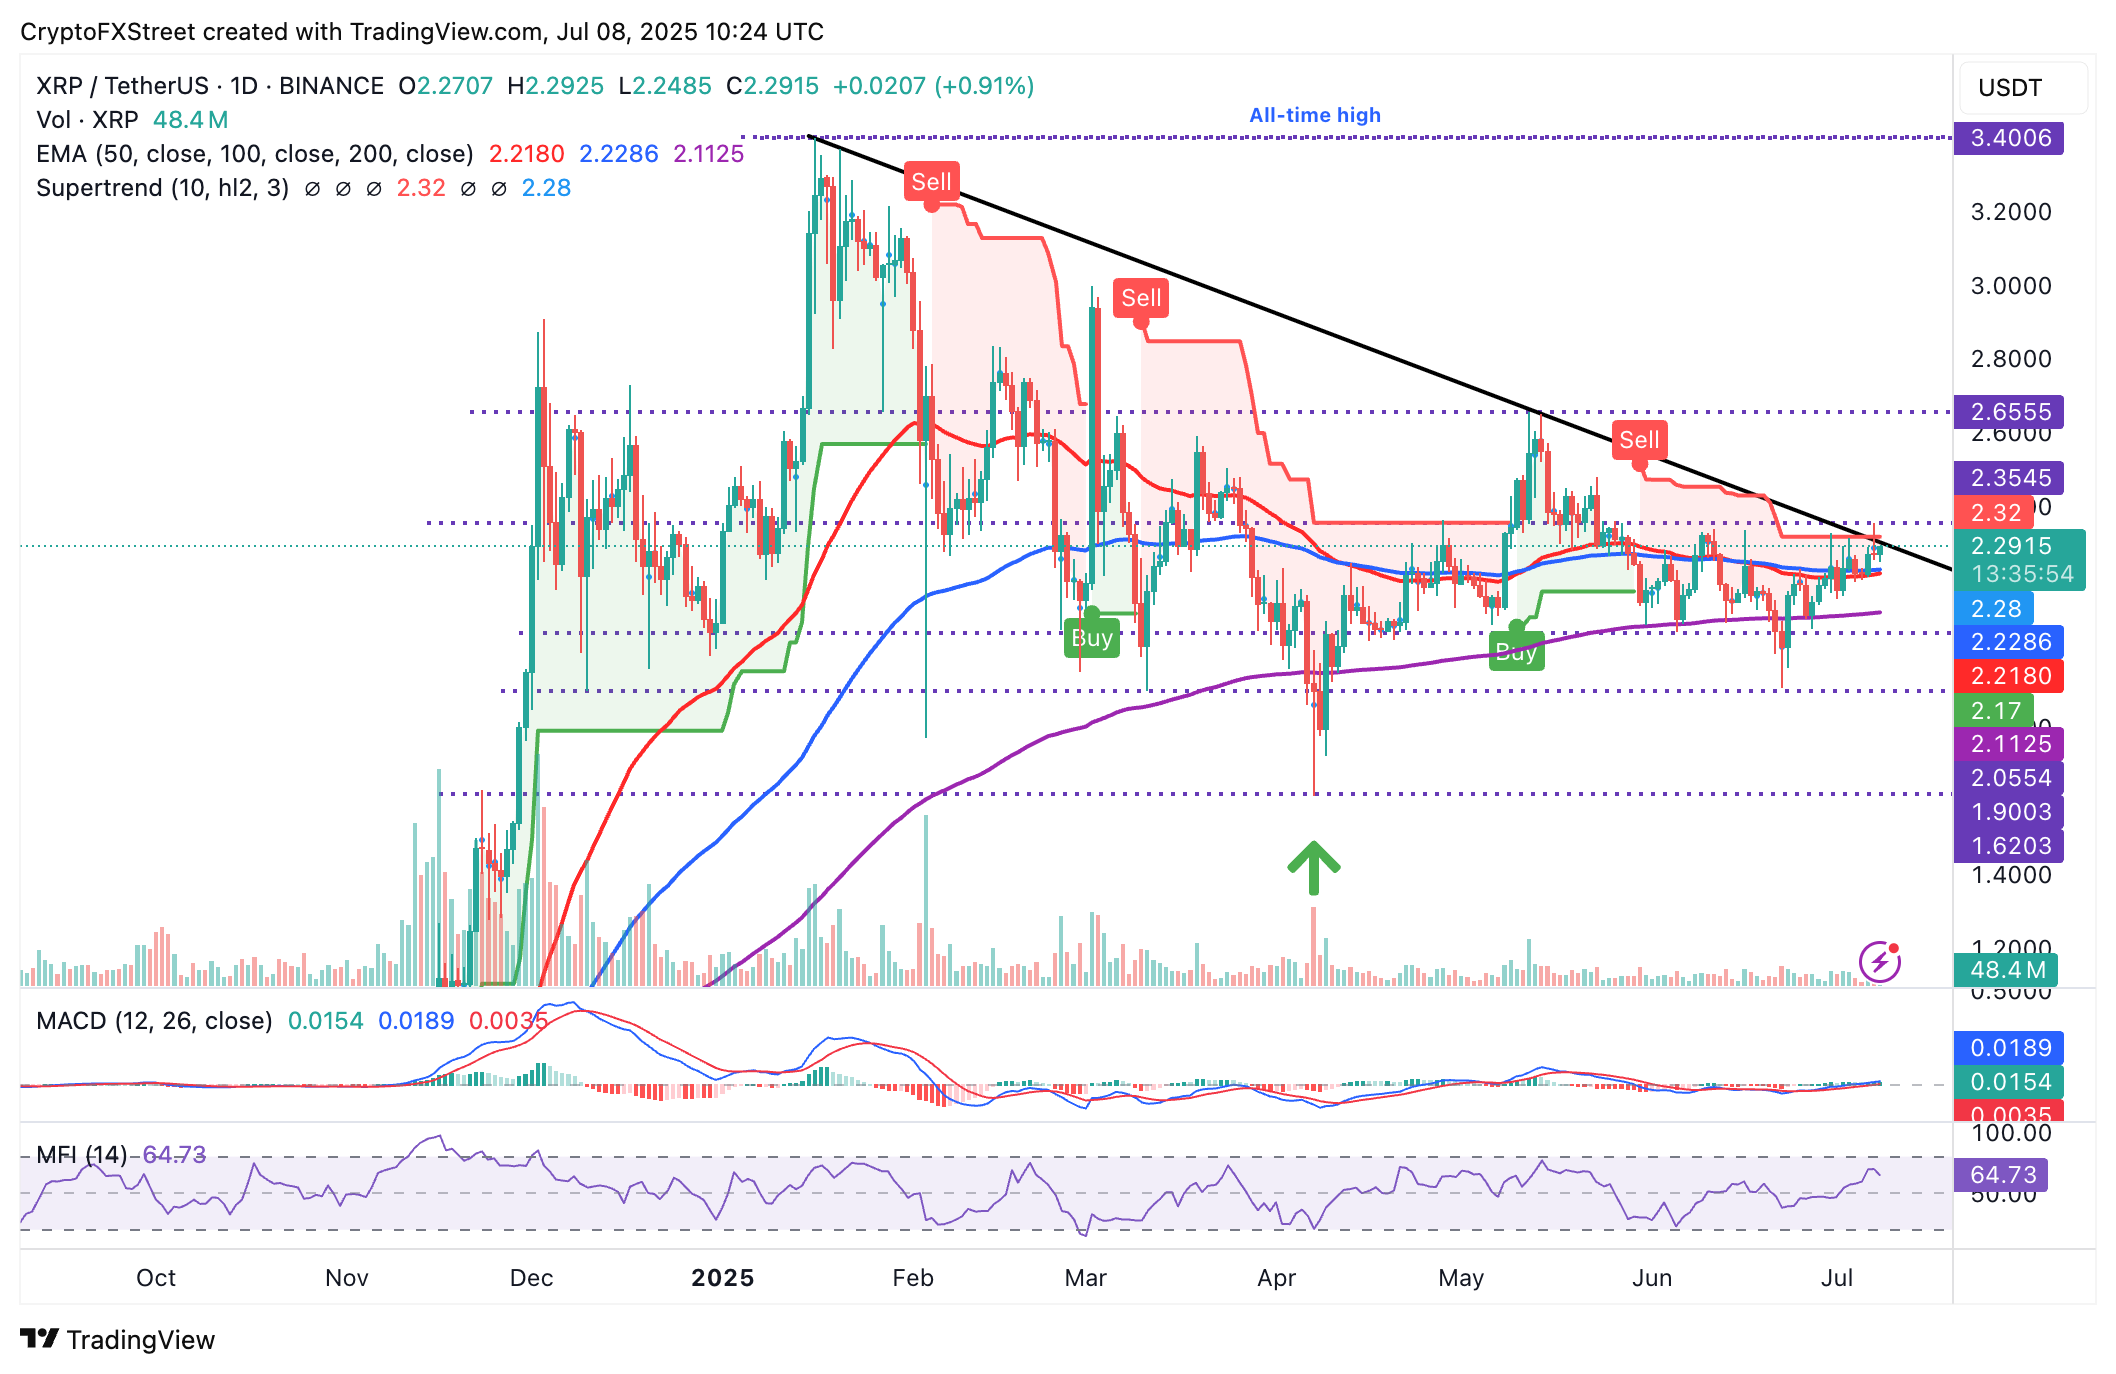
XRP/USDT daily chart
The descending trendline, which has been maintained since XRP reached its all-time high of $3.40 in January, is the biggest bottleneck that bulls are facing.
A break above this critical level could catalyze the uptrend as traders expand the bullish scope to $2.65, the highest peak in May, and the round-number target at $3.00.
Cryptocurrency prices FAQs
How do new token launches or listings affect cryptocurrency prices?
Token launches influence demand and adoption among market participants. Listings on crypto exchanges deepen the liquidity for an asset and add new participants to an asset’s network. This is typically bullish for a digital asset.
How do hacks affect cryptocurrency prices?
A hack is an event in which an attacker captures a large volume of the asset from a DeFi bridge or hot wallet of an exchange or any other crypto platform via exploits, bugs or other methods. The exploiter then transfers these tokens out of the exchange platforms to ultimately sell or swap the assets for other cryptocurrencies or stablecoins. Such events often involve an en masse panic triggering a sell-off in the affected assets.
How do macroeconomic releases and events affect cryptocurrency prices?
Macroeconomic events like the US Federal Reserve’s decision on interest rates influence crypto assets mainly through the direct impact they have on the US Dollar. An increase in interest rate typically negatively influences Bitcoin and altcoin prices, and vice versa. If the US Dollar index declines, risk assets and associated leverage for trading gets cheaper, in turn driving crypto prices higher.
How do major crypto upgrades like halvings, hard forks affect cryptocurrency prices?
Halvings are typically considered bullish events as they slash the block reward in half for miners, constricting the supply of the asset. At consistent demand if the supply reduces, the asset’s price climbs.
