Stellar (XLM) Primed for Explosive Rally: Triangle Breakout & PayPal Stablecoin Hype Fuel Bullish Momentum

Stellar's XLM is coiled like a spring—technical patterns hint at a major breakout as PayPal's stablecoin rumors electrify the market.
The Triangle Tightens
XLM's price compresses into a textbook symmetrical triangle—a 30% volatility squeeze that historically precedes explosive moves. Traders are betting the breakout direction is up.
PayPal Effect: More Than Just Hype?
Whispers of Stellar's blockchain integrating with PayPal's upcoming stablecoin sent XLM holders into a frenzy. Because nothing pumps a crypto like vague institutional interest—even if the details are murkier than a DeFi protocol's tokenomics.
The Trade Setup
A clean breakout above $0.35 confirms the pattern, targeting $0.55 initially. But watch the volume—no retail FOMO means this could be another fakeout in the making. After all, what's crypto without a few rug pulls disguised as 'technical breakthroughs'?
Double-digit gains in XLM Open Interest signal increased optimism
CoinGlass’ data shows that the XLM Open Interest (OI) has surged by 10% in the last 24 hours, reaching $181.73 million. An OI spike is associated with increased buying activity, driving inflows in XLM derivatives, which indicates heightened confidence among traders.
Alongside increased OI, the volume jumps by 10% to $214.68 million, while the long/short ratio of 0.99 suggests a marginal bearish tilt in the number of active positions.
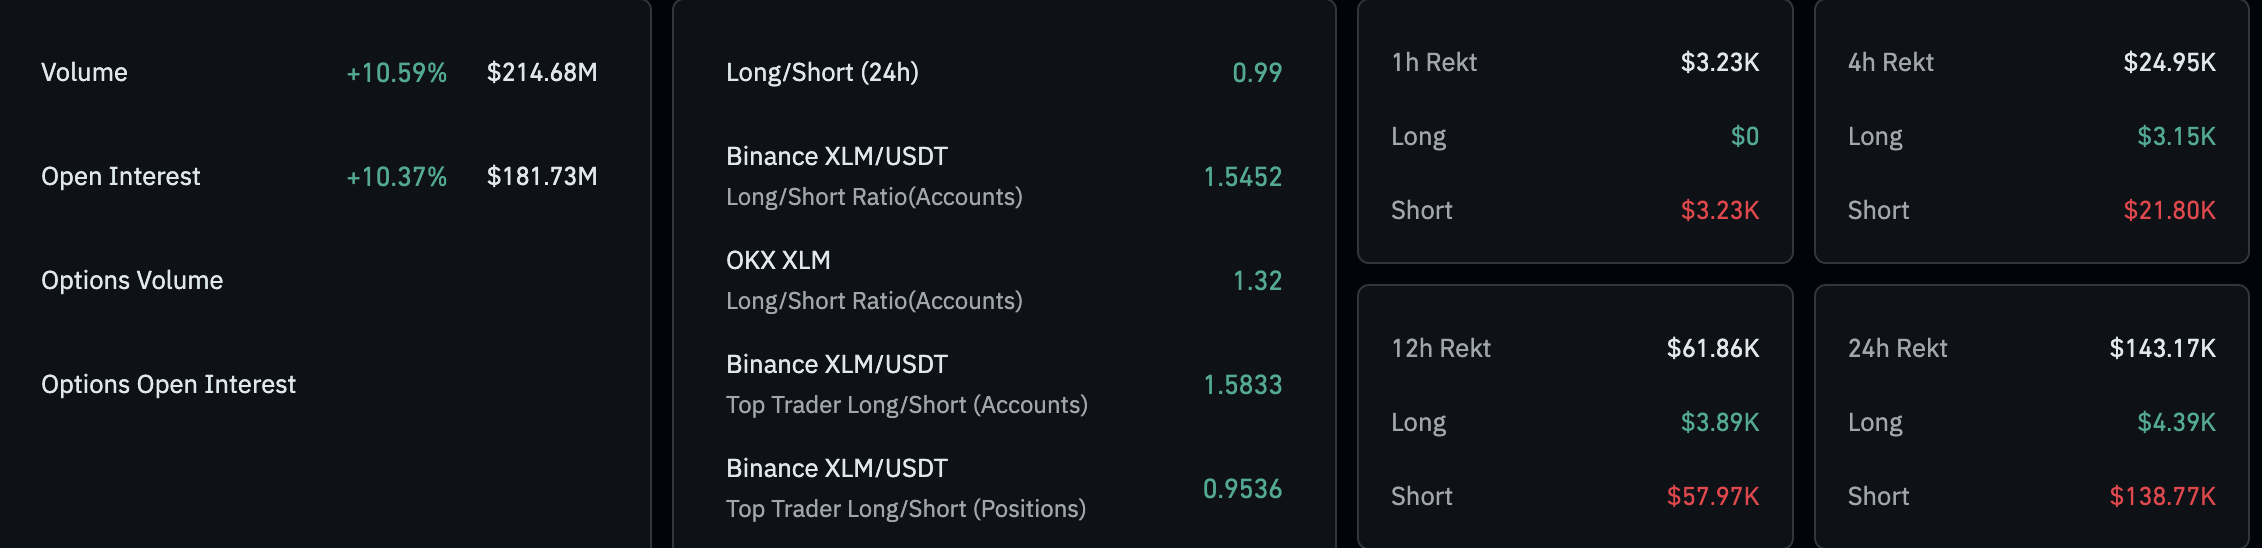
XLM derivatives. Source: Coinglass
XLM eyes a potential triangle breakout rally
XLM edges higher by nearly 1% at press time on Monday, extending the uptrend towards a critical resistance trendline formed by connecting the highs of December 3 and May 10. In combination with a $0.2190 support floor, marked by a green band on the chart shared below, XLM forms a descending triangle pattern.
A potential daily close above the trendline NEAR $0.2600 round figure could prolong the breakout rally towards the June high of $0.2851.
The Moving Average Convergence/Divergence (MACD) indicator displays successively increasing green histogram bars above the zero line, aligning with the bullish recovery. However, sidelined investors could await the MACD and signal lines crossing above the zero line, signaling a trend reversal.
Meanwhile, the Relative Strength Index (RSI) at 52 crosses above the halfway line, an early sign of a shift in trend momentum.
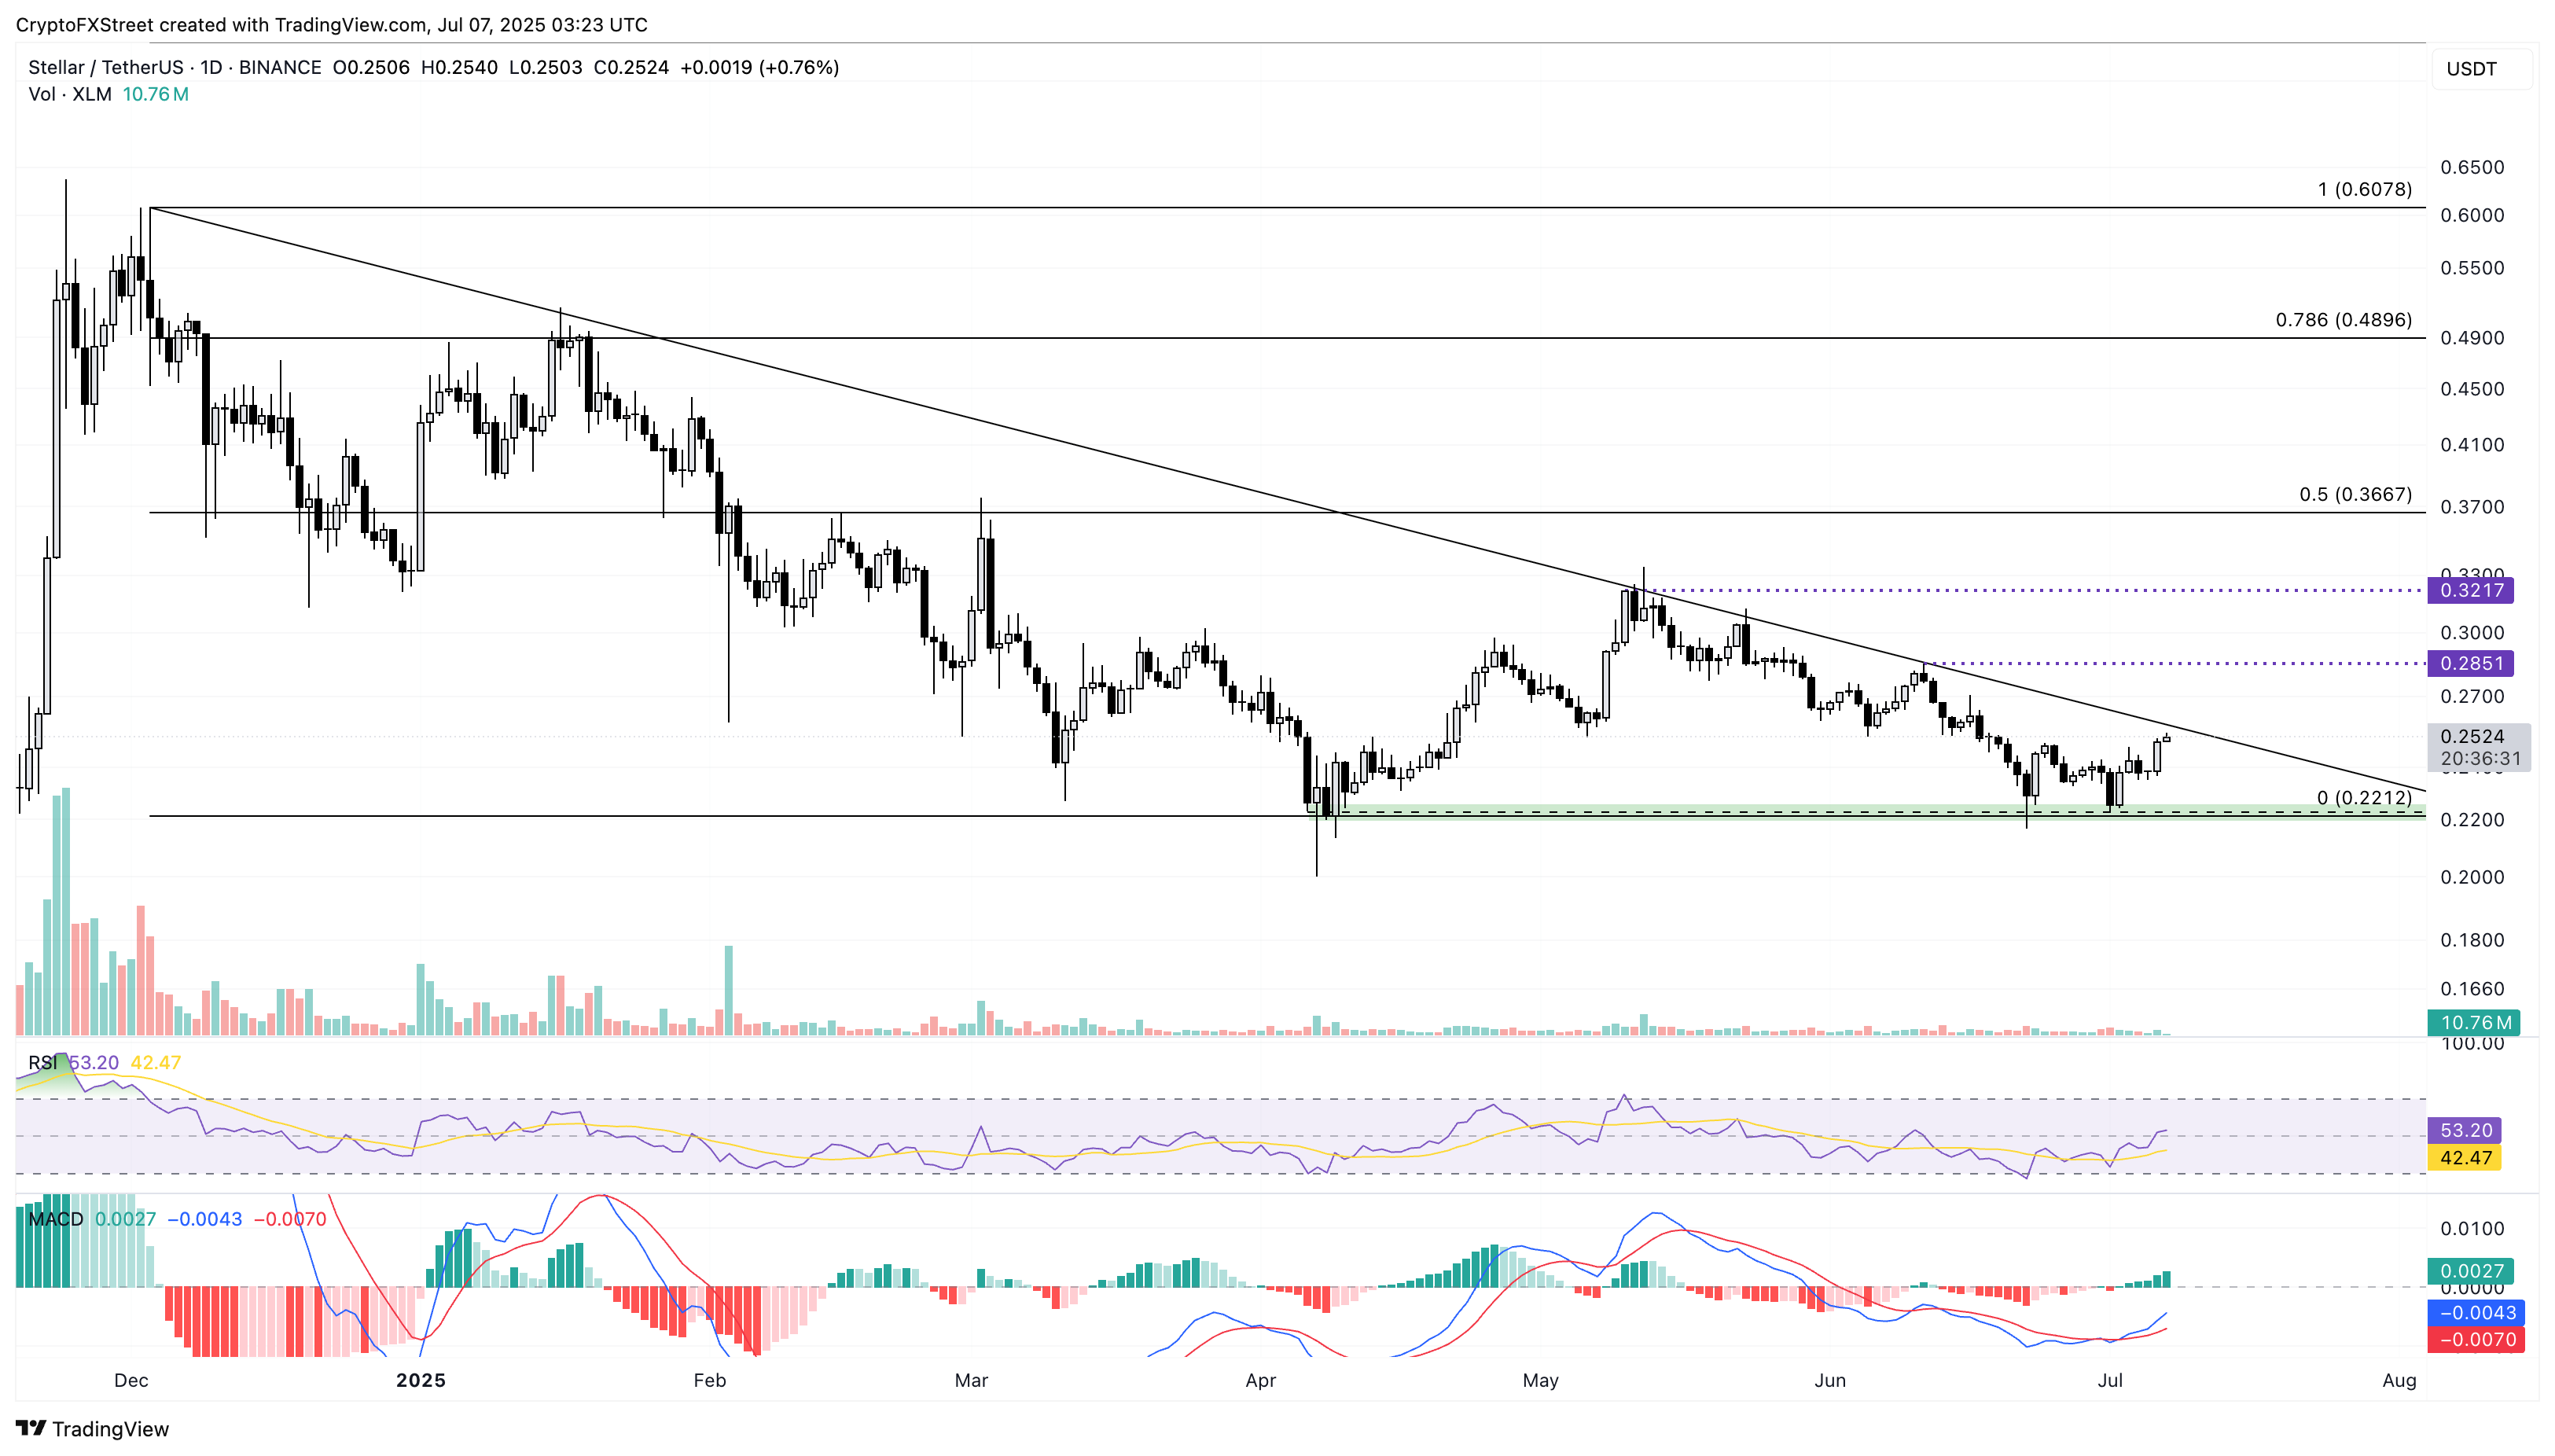
XLM/USDT daily price chart.
However, a reversal from the resistance trendline could cause XLM to decline toward the $0.2190 support floor, prolonging the oscillation within the triangle pattern.
