🚀 Bitcoin Nears ATH While Ethereum & Ripple Shatter Resistance: Top 3 Crypto Price Predictions for July 2025

Crypto markets are heating up as Bitcoin flirts with all-time highs and altcoins break free from key resistance levels. Here's where the big three might be headed next.
Bitcoin (BTC): The Bull Run Isn't Done Yet
The OG cryptocurrency keeps knocking on the door of its historic peak—institutional FOMO could be the final push needed to blast through.
Ethereum (ETH): Breaking Out of the Shadow
ETH finally cracked a critical resistance level that's been capping gains. Smart money's betting this is just the warm-up before DeFi season kicks in.
Ripple (XRP): The Courtroom Warrior's Revenge Rally
After years of legal purgatory, XRP's technical breakout suggests traders are pricing in more than just regulatory relief—maybe even a little schadenfreude against the SEC.
As always in crypto land: past performance guarantees absolutely nothing, but those resistance breaks sure do look pretty on the charts. (Bankers still waiting for 'the blockchain, not Bitcoin' epiphany may want to check those 2021 portfolios again.)
Will BTC refresh its record highs?
Bitcoin price broke and closed above the upper boundary of a consolidation zone at $108,355 on Wednesday, rallying 3.64% by Thursday. At the time of writing on Friday, it hovers at around $109,000.
If BTC continues its upward momentum, it could extend the rally toward the May 22 all-time high at $111,980.
The Relative Strength Index (RSI) on the daily chart reads 58 after rebounding from its neutral level of 50 on Tuesday, indicating bullish momentum is gaining traction. The Moving Average Convergence Divergence (MACD) on the daily chart displayed a bullish crossover last week. It also shows rising green histogram bars above its neutral level, suggesting bullish momentum and indicating an upward trend.
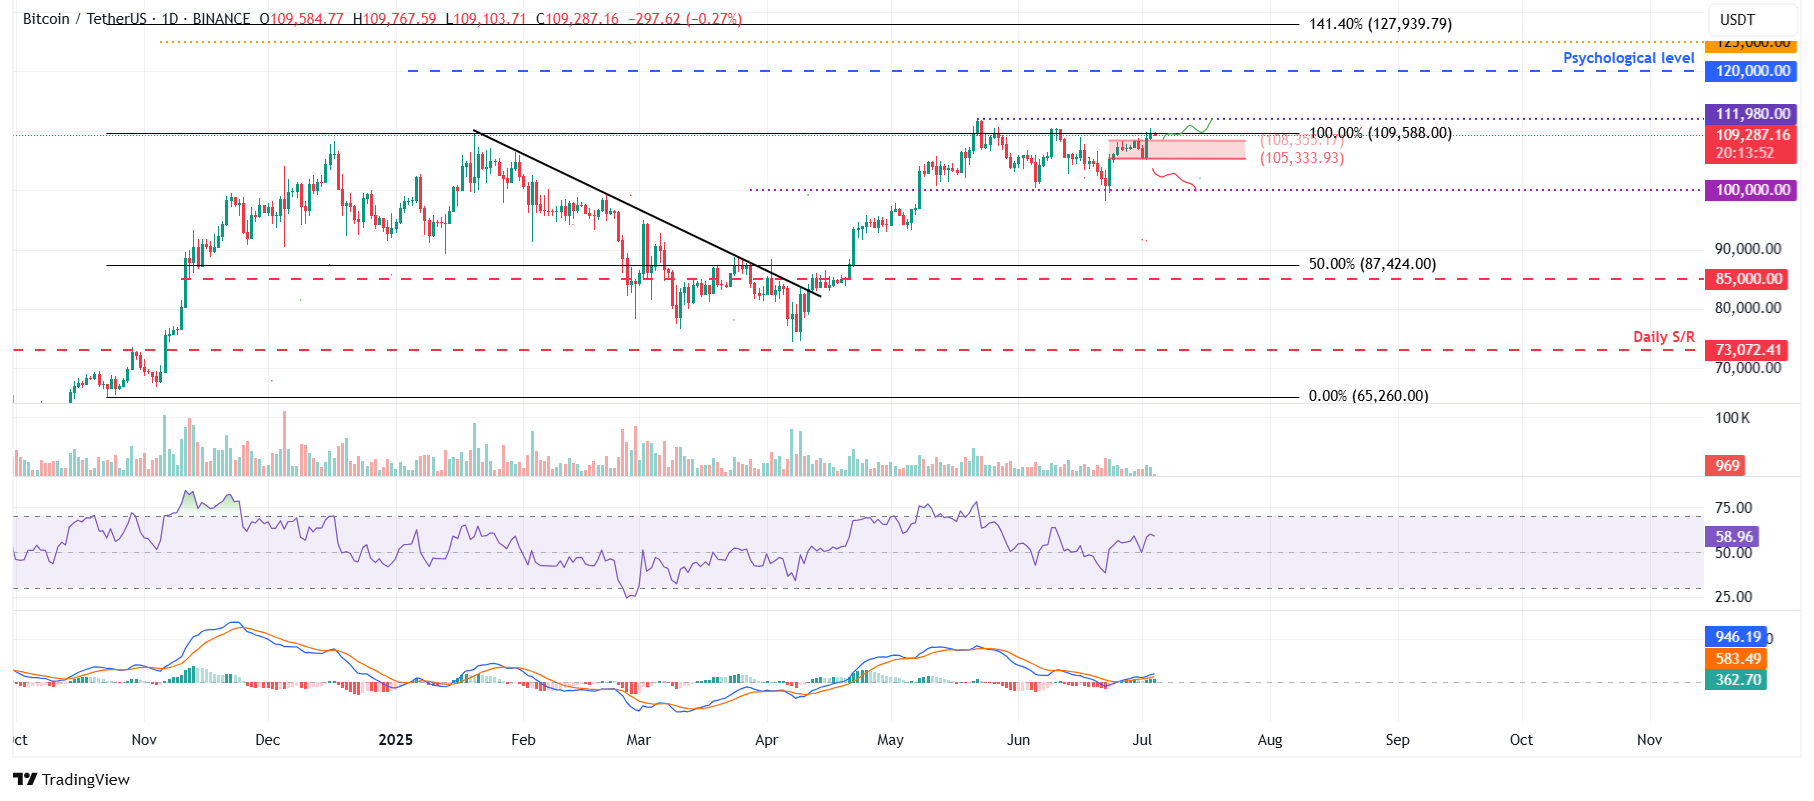
BTC/USDT daily chart
However, if BTC faces a correction and closes below its support at $108,355, it could extend the decline to retest the lower boundary of the consolidation zone at $105,333.
Ethereum bulls are aiming for levels above $2,700
Ethereum price ROSE nearly 7% on Wednesday after it rested its 50-day EMA at $2,445 and closed above the daily resistance at $2,461. It continued its upward trend and gained slightly the next day. At the time of writing on Friday, it hovers at around $2,500.
If ETH continues its upward trend, it could extend the rally toward its next daily resistance level at $2,724.
The RSI on the daily chart reads 56, above its neutral level of 50, indicating that bullish momentum is gaining traction. The MACD indicator on the daily chart displayed a bullish crossover on Wednesday. It also shows rising green histogram bars above its neutral level, suggesting bullish momentum and indicating an upward trend.
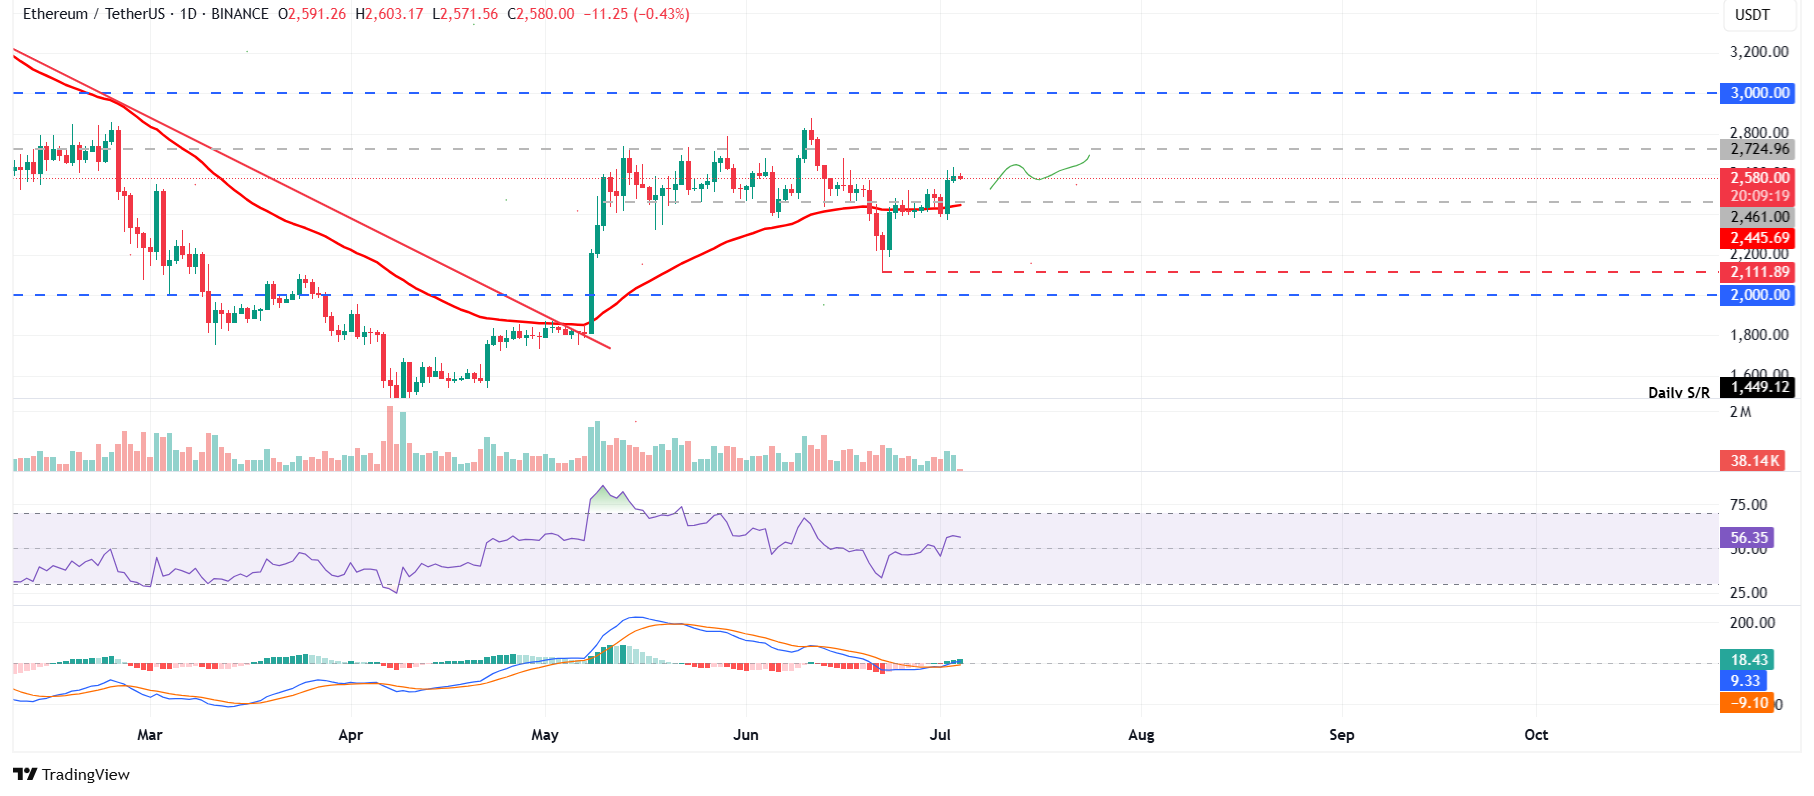
ETH/USDT daily chart
On the other hand, if ETH faces a correction, it could extend the decline to retest its daily support at $2,461.
XRP is set for an upleg as it closes above its key resistance
XRP price broke above the descending trendline (drawn by connecting multiple highs since mid-May) on Monday and found support around it on Wednesday. On Thursday, it closed above its daily resistance at $2.23. At the time of writing on Friday, it hovers at around $2.24.
If XRP continues its upward momentum, it could extend the rally toward its May 23 high of $2.47.
The RSI on the daily chart reads 54, above its neutral level of 50, indicating that bullish momentum is gaining traction. The MACD indicator on the daily chart displayed a bullish crossover last week. It also shows rising green histogram bars above its neutral level, suggesting bullish momentum and indicating an upward trend.
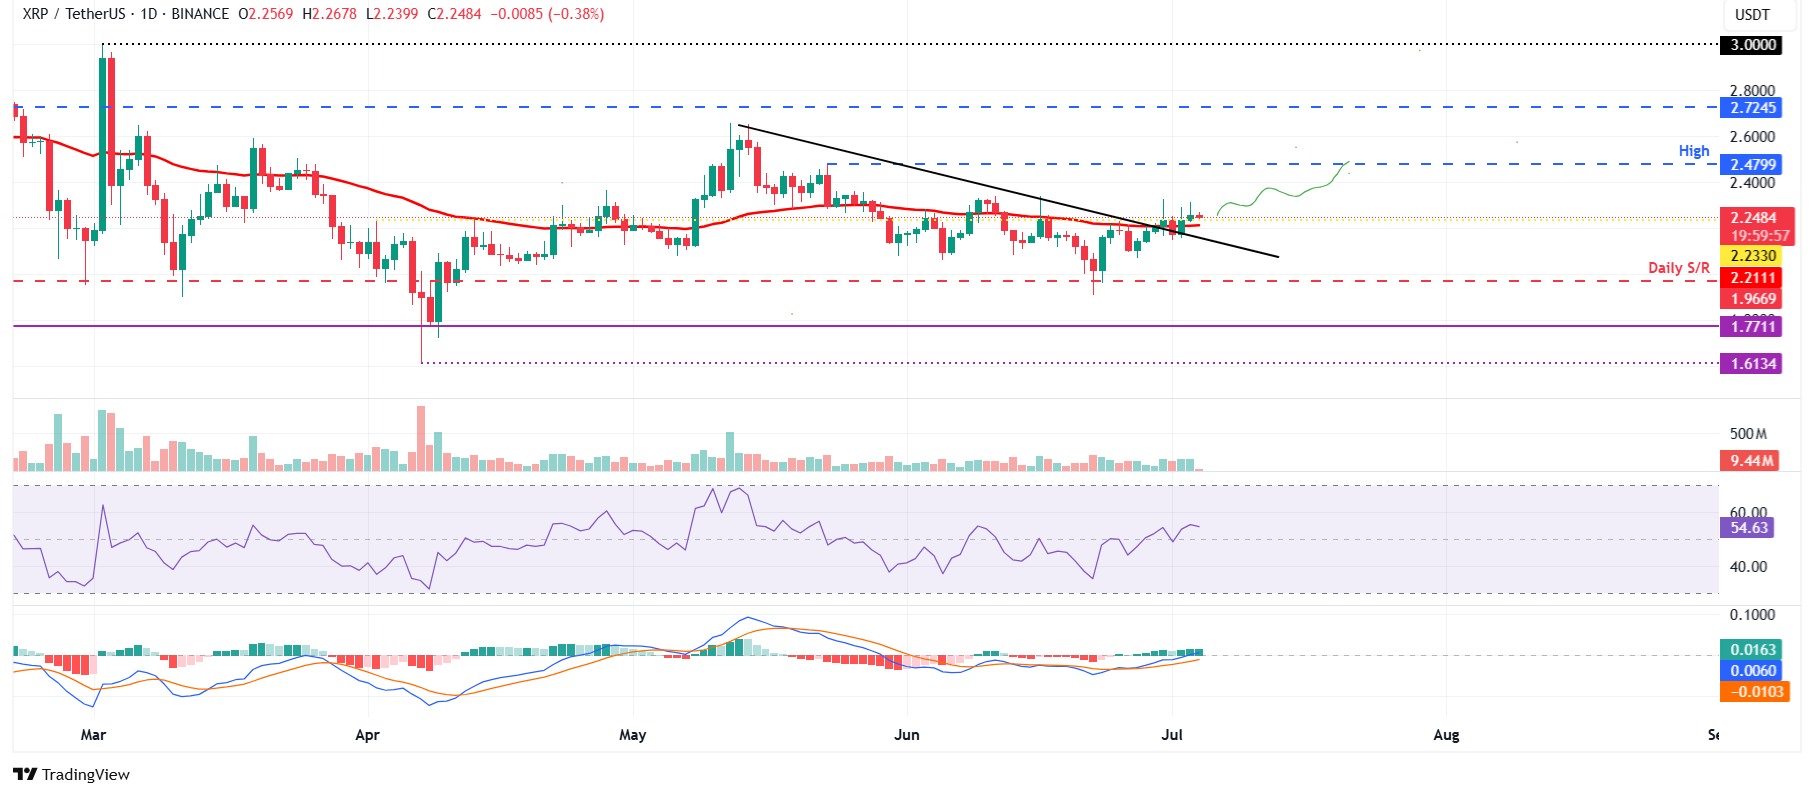
XRP/USDT daily chart
Conversely, if XRP falls and closes below its 50-day EMA at $2.21, it could extend the correction to retest its daily support at $1.96.
Bitcoin, altcoins, stablecoins FAQs
What is Bitcoin?
Bitcoin is the largest cryptocurrency by market capitalization, a virtual currency designed to serve as money. This form of payment cannot be controlled by any one person, group, or entity, which eliminates the need for third-party participation during financial transactions.
What are altcoins?
Altcoins are any cryptocurrency apart from Bitcoin, but some also regard Ethereum as a non-altcoin because it is from these two cryptocurrencies that forking happens. If this is true, then Litecoin is the first altcoin, forked from the Bitcoin protocol and, therefore, an “improved” version of it.
What are stablecoins?
Stablecoins are cryptocurrencies designed to have a stable price, with their value backed by a reserve of the asset it represents. To achieve this, the value of any one stablecoin is pegged to a commodity or financial instrument, such as the US Dollar (USD), with its supply regulated by an algorithm or demand. The main goal of stablecoins is to provide an on/off-ramp for investors willing to trade and invest in cryptocurrencies. Stablecoins also allow investors to store value since cryptocurrencies, in general, are subject to volatility.
What is Bitcoin Dominance?
Bitcoin dominance is the ratio of Bitcoin's market capitalization to the total market capitalization of all cryptocurrencies combined. It provides a clear picture of Bitcoin’s interest among investors. A high BTC dominance typically happens before and during a bull run, in which investors resort to investing in relatively stable and high market capitalization cryptocurrency like Bitcoin. A drop in BTC dominance usually means that investors are moving their capital and/or profits to altcoins in a quest for higher returns, which usually triggers an explosion of altcoin rallies.
