Solana Price Surge: SOL Shatters Resistance as ETF Hype Ignites Bullish Frenzy

Solana rockets past key technical levels—just as Wall Street starts flirting with crypto again.
ETF whispers fuel the fire
Suddenly every institutional investor 'always believed' in blockchain scalability. SOL's 30% weekly gain conveniently coincides with BlackRock's latest custody filings—how serendipitous.
Technicals scream momentum
The breakout above $150 wasn't subtle. Trading volumes hit 3-month highs while shorts got liquidated at rates not seen since last cycle's meme-stock mania.
Regulators still hate your gains
SEC chair's latest 'investor protection' speech contained the phrase 'speculative fever' exactly four times. Meanwhile, congressmen quietly reshuffle their SOL bags.
Price discovery mode activated
With staking yields holding at 6.2% and DeFi TVL doubling since May, this rally's got legs. Unless of course the 'institutional adoption' narrative collapses faster than a Celsius withdrawal request.
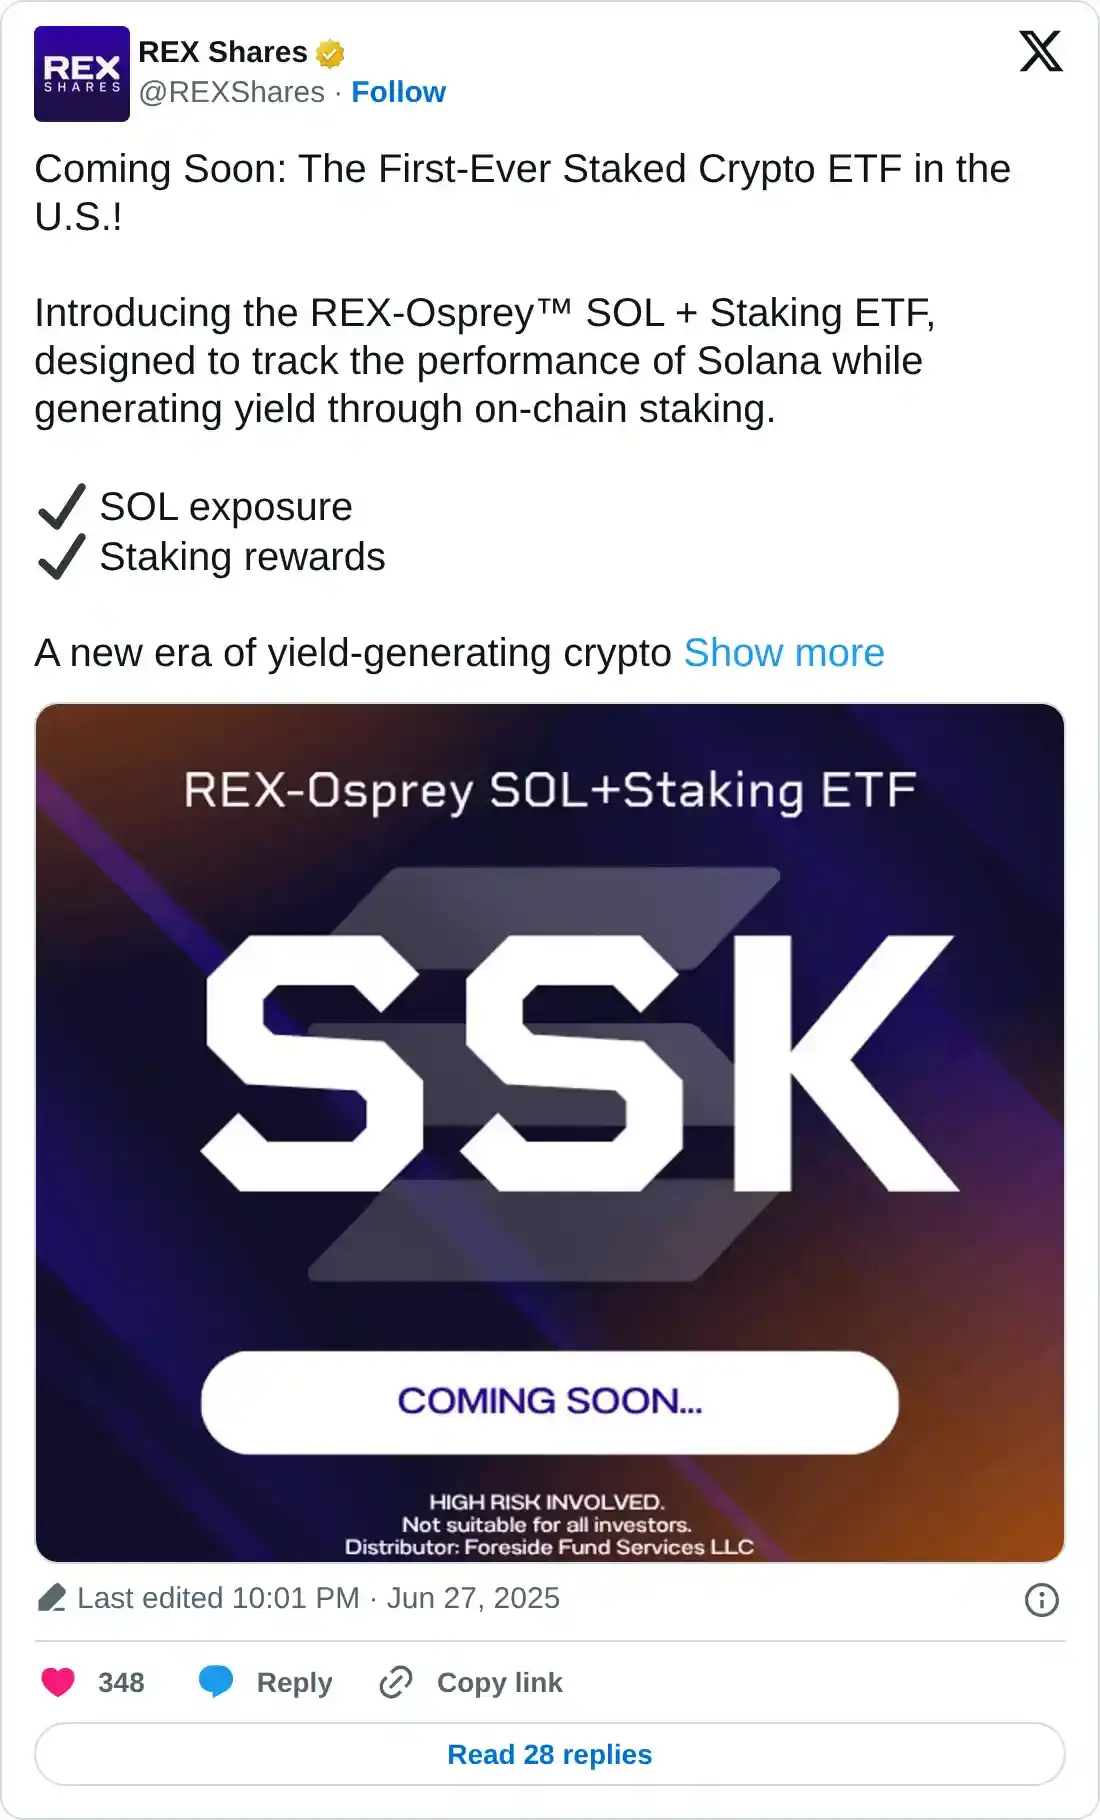
Is Solana ETF coming soon?
REX Shares posted on its X account on Saturday that its REX-Osprey SOL and staking ETF is designed to track the performance of Solana while generating yield through onchain staking and will be launched soon.
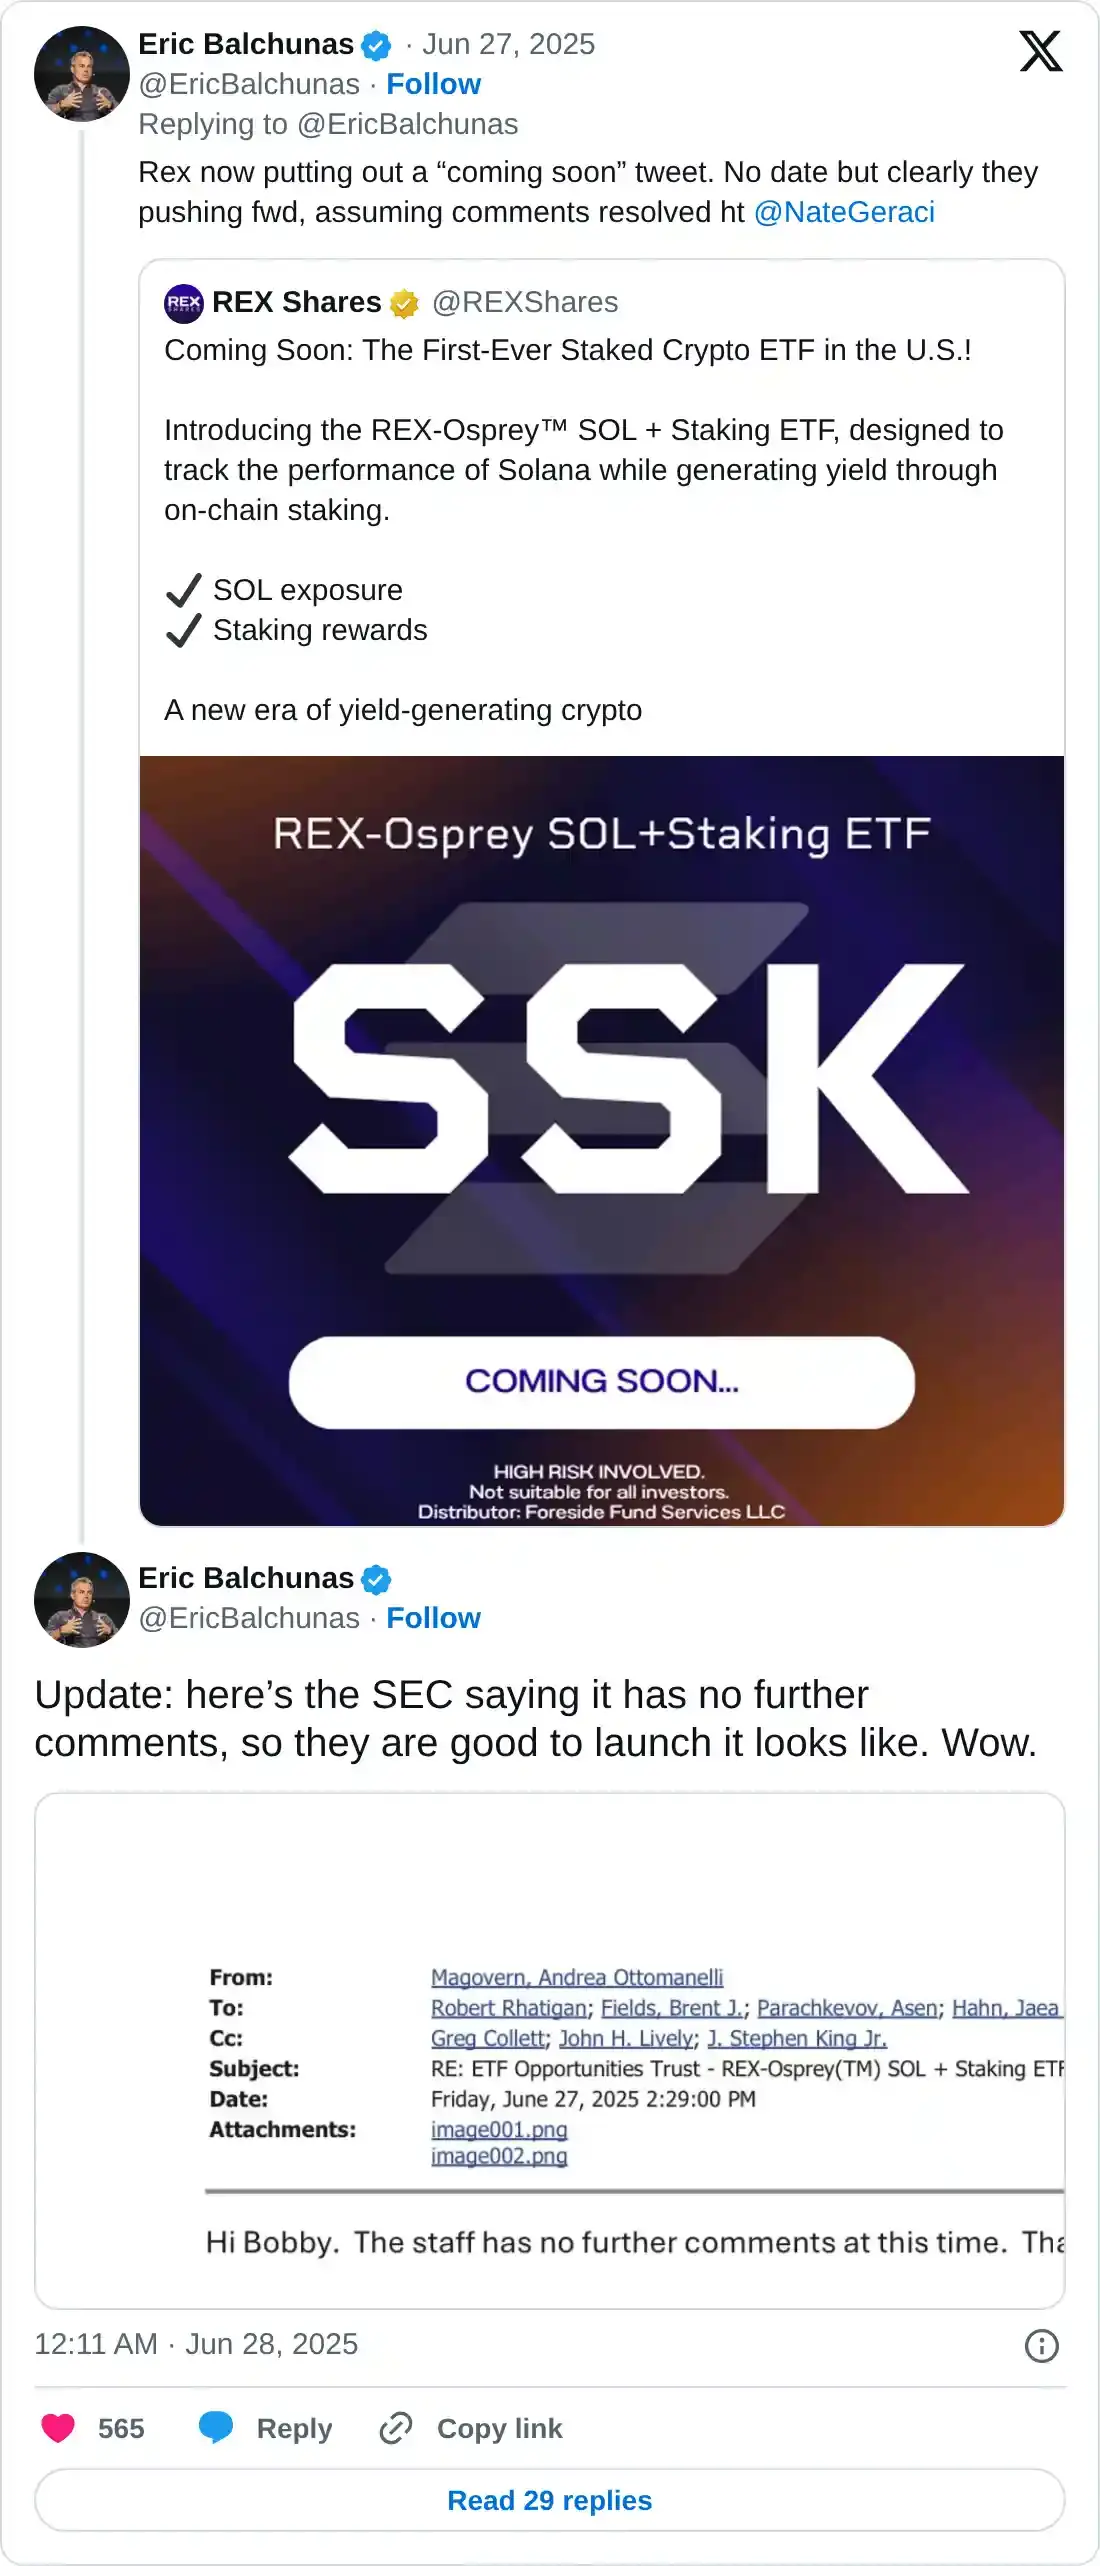
Eric Balchunas, Senior ETF Analyst for Bloomberg, also posted on X on the same day that the
Rex has just filed a letter with the US SEC, asking if comments have been resolved for their ‘40 Act Solana Staking ETF.
Balchunas posted: “They’re no doubt trying to get it to mkt ahead of the spot ones.”
He also cited an email screenshot to confirm that REX Shares has addressed the SEC’s comments.
“So they are good to launch, it looks like. Wow,” Balchunas added.
Solana Price Forecast: SOL breakout of the descending trendline
Solana price broke out and closed above the descending trendline (drawn by connecting multiple highs since May 24) on Saturday and rallied to close above its 50-day Exponential Moving Average (EMA) at $151.48 the next day. At the time of writing on Monday, it hovers around the 50-day EMA level at $151.48.
If SOL continues its upward trend, it could extend the rally toward its daily resistance level at $160. A successful close above this level could extend additional gains to retest its next daily resistance at $184.13.
The Relative Strength Index (RSI) on the daily chart reads 52, above its neutral level of 50, indicating that bullish momentum is gaining traction. The Moving Average Convergence Divergence (MACD) on the daily chart also displayed a bullish crossover on Saturday, providing a buy signal and indicating an upward trend.
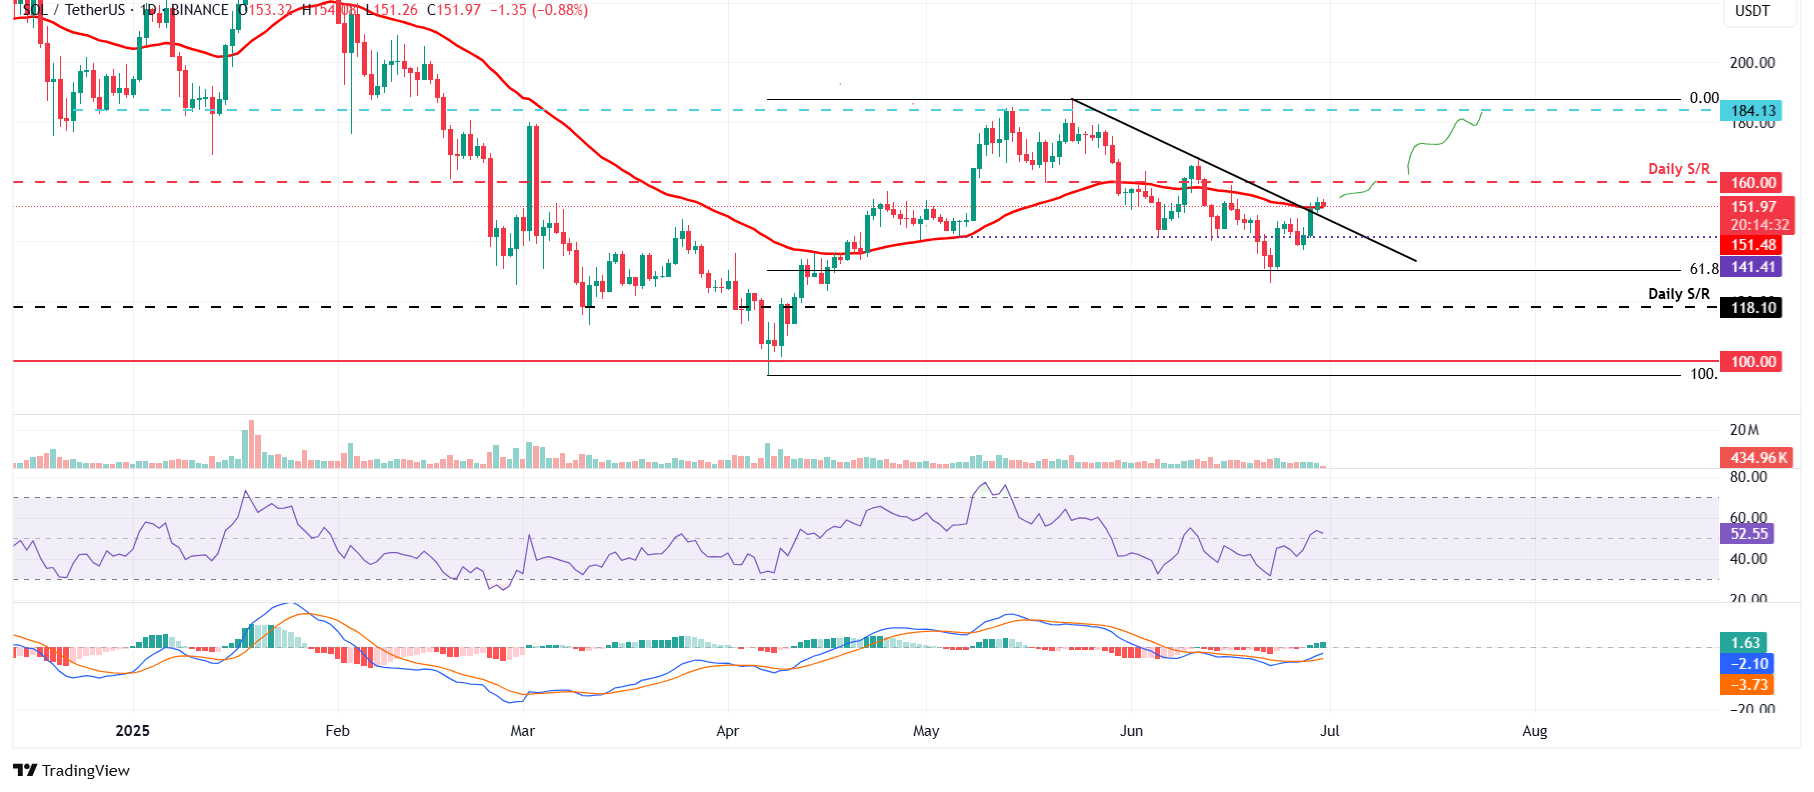
SOL/USDT daily chart
However, if SOL faces a correction, it could extend the decline toward its next support level at $141.41.
