Aave Price Prediction: AAVE Skyrockets 10% This Week – On-Chain Frenzy & Bullish Bets Fuel Rally

Aave’s native token AAVE is flexing its muscles this week, ripping past a 10% gain as on-chain activity and trader optimism hit fever pitch. Here’s why DeFi’s lending heavyweight is stealing the spotlight.
On-Chain Metrics Ignite
Blockchain data doesn’t lie—AAVE’s network activity is exploding. Surging transaction volumes and wallet growth suggest institutional players might be quietly stacking positions (or maybe just degens levering up).
Bullish Bets Pile On
Futures markets scream confidence, with open interest punching upward. Traders are clearly betting this rally has legs—though after last year’s ‘DeFi winter,’ maybe they’ve just forgotten what risk feels like.
Price Prediction: Can AAVE Sustain the Momentum?
Technical setups hint at more upside if key resistance breaks. But let’s be real—in crypto, ‘fundamentals’ are just astrology for finance bros. One whale dump could send this party crashing faster than a LUNA validator.
AAVE on-chain metrics hint at further gains
Token Terminal data shows that Aave’s active monthly loans as of June have reached a record high of $16.37 billion. The competitive landscape chart below shows that Aave stands at the top, surpassing other lending platforms, such as Morpho (MORPHO) and Spark (SPK), with a market share of 62.6%. This suggests that Aave is currently the dominant player in the decentralized lending sector, indicating its widespread adoption and trust among users.
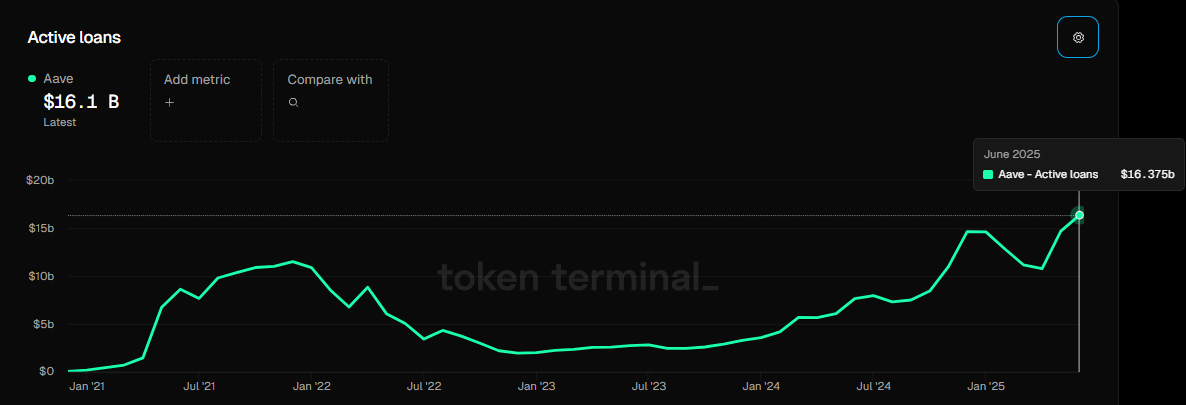
Aave active loans monthly chart. Source: Token Terminal
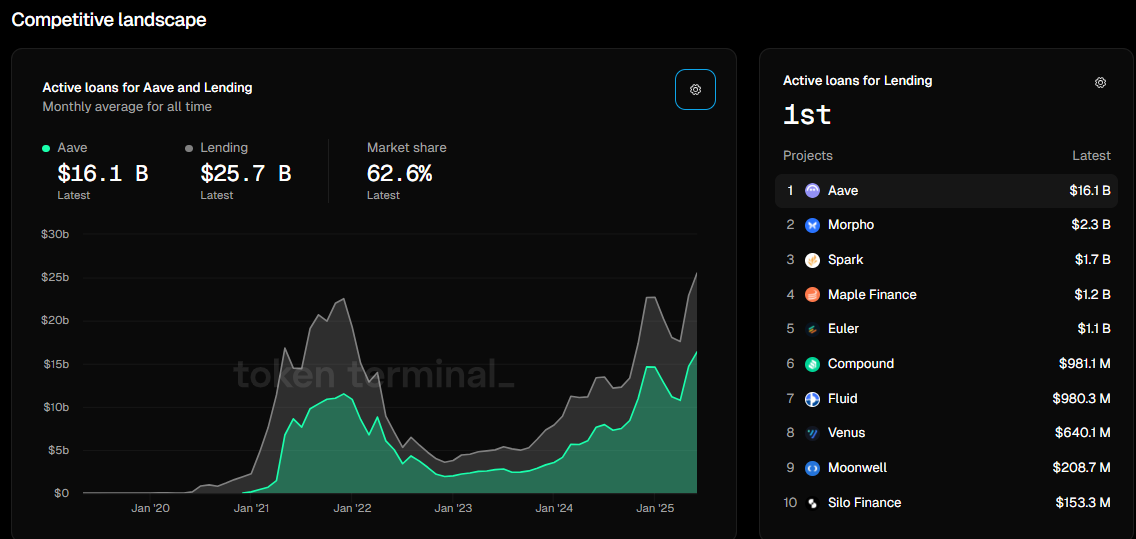
Competitive landscape chart. Source: Token Terminal
Another data supporting AAVE’s bullish outlook is the rising protocol fees and revenue. DeFiLama data shows that AAVE’s cumulative fees and revenue reached a record high of $1.37 billion and $ 223.44 million respectively, on June 21.
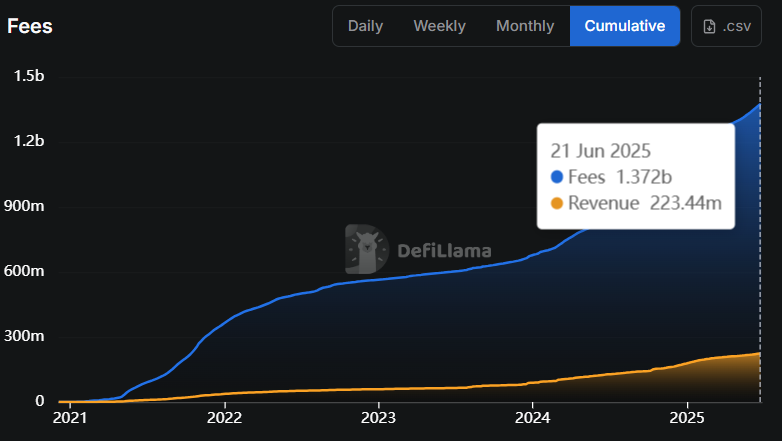
AAVE cumulative fees and revenue chart. Source: DefiLlama
Apart from the positive on-chain metrics, Aave’s derivative data also suggests a potential price rally. Coinglass’s long-to-short ratio for AAVE reads 1.07, the highest level over a month. The ratio above one suggests that more traders are betting on AAVE’s price to rally.
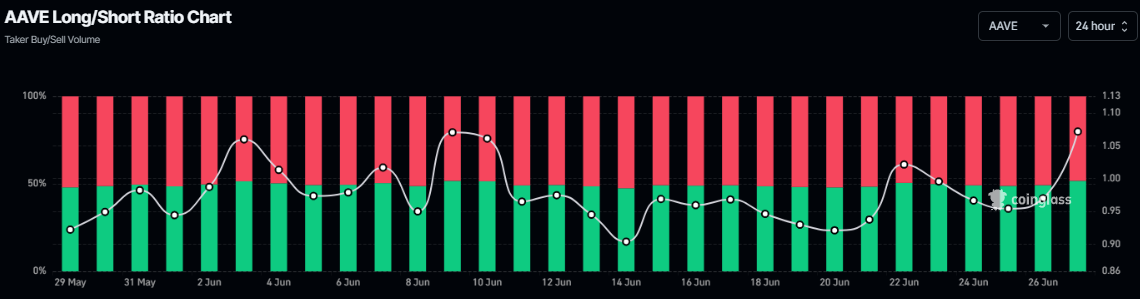
AAVE long-to-short ratio chart. Source: Coinglass
AAVE Price Prediction: Rebound from key support
Aave’s price retested and found support around its key level at $219.69 on Monday and rallied by nearly 16% until the next day. This level aligns with the 200-day Exponential Moving Average (EMA), the 50% Fibonacci retracement level (derived from the April low of $114.05 to the June high of $325.40), and the ascending trendline formed by connecting multiple lows since early April, representing a key support zone. At the time of writing on Friday, it trades above $260.
If AAVE continues its upward trend, it could extend the rally toward its next daily resistance at $282.52. A successful close above this level WOULD extend the gains to retest its June 11 high at $325.41.
The Relative Strength Index (RSI) on the daily chart hovers around its neutral level of 50, indicating a lack of momentum and indecision among traders. For the bullish momentum to be sustained, the RSI should continue to MOVE above its neutral level.
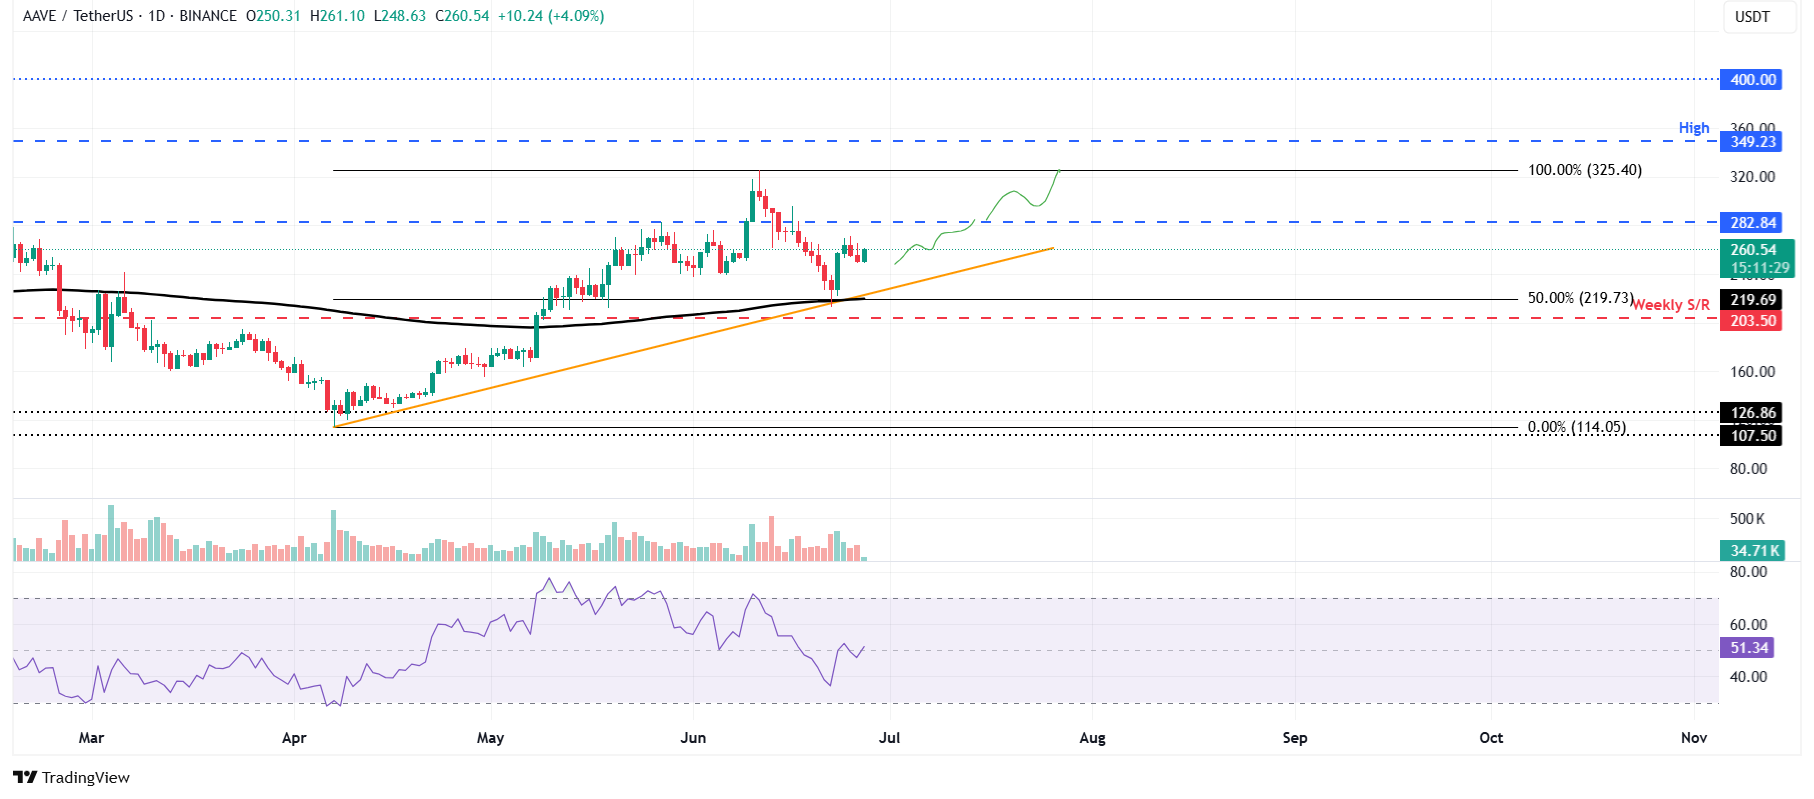
AAVE/USDT daily chart
However, if AAVE faces a correction, it could extend the decline to retest its key support level at $219.69, its 200-day EMA.
