Altcoin Bloodbath: Pi Network, SPX6900, and Celestia Crash 10%+ as Crypto Market Tanks

Crypto winter bites back—hard. Today’s altcoin massacre saw Pi Network, SPX6900, and Celestia plunge double-digits as the broader market capitulated. No safe havens here, just a sea of red.
### The casualties pile up
Pi Network, the mobile-mining darling, got crushed under selling pressure. SPX6900—the meme coin that somehow outlived its 15 minutes of fame—melted faster than a degenerate’s margin account. And modular blockchain Celestia? Its tokenomics couldn’t escape gravity.
### Why this hurts more
These weren’t obscure shitcoins. All three projects had legitimate followings—proof that in crypto, ‘fundamentals’ just means ‘better narrative before the dump.’ Traders now face the oldest lesson: when BTC sneezes, altcoins get pneumonia.
Silver lining? At least the losses are tax-deductible—if you kept records between margarita-fuelled trades.
Pi Network risks losing weekly gains
Pi Network edges lower by 2% at press time on Friday, extending the 9% drop from the previous day. Pi risks losing the 28% gains made earlier this week as it reverses from the $0.66 resistance level.
A steeper correction could test the weekly low at $0.49, risking the psychological support level of $0.50.
The momentum indicators lose their bullish tilt: The Moving Average Convergence/Divergence (MACD) indicator inches closer to its signal lines as the green histogram bar declines in strength.
The Relative Strength Index (RSI) reverses to 43, diving below the halfway line, indicating a decrease in bullish momentum.
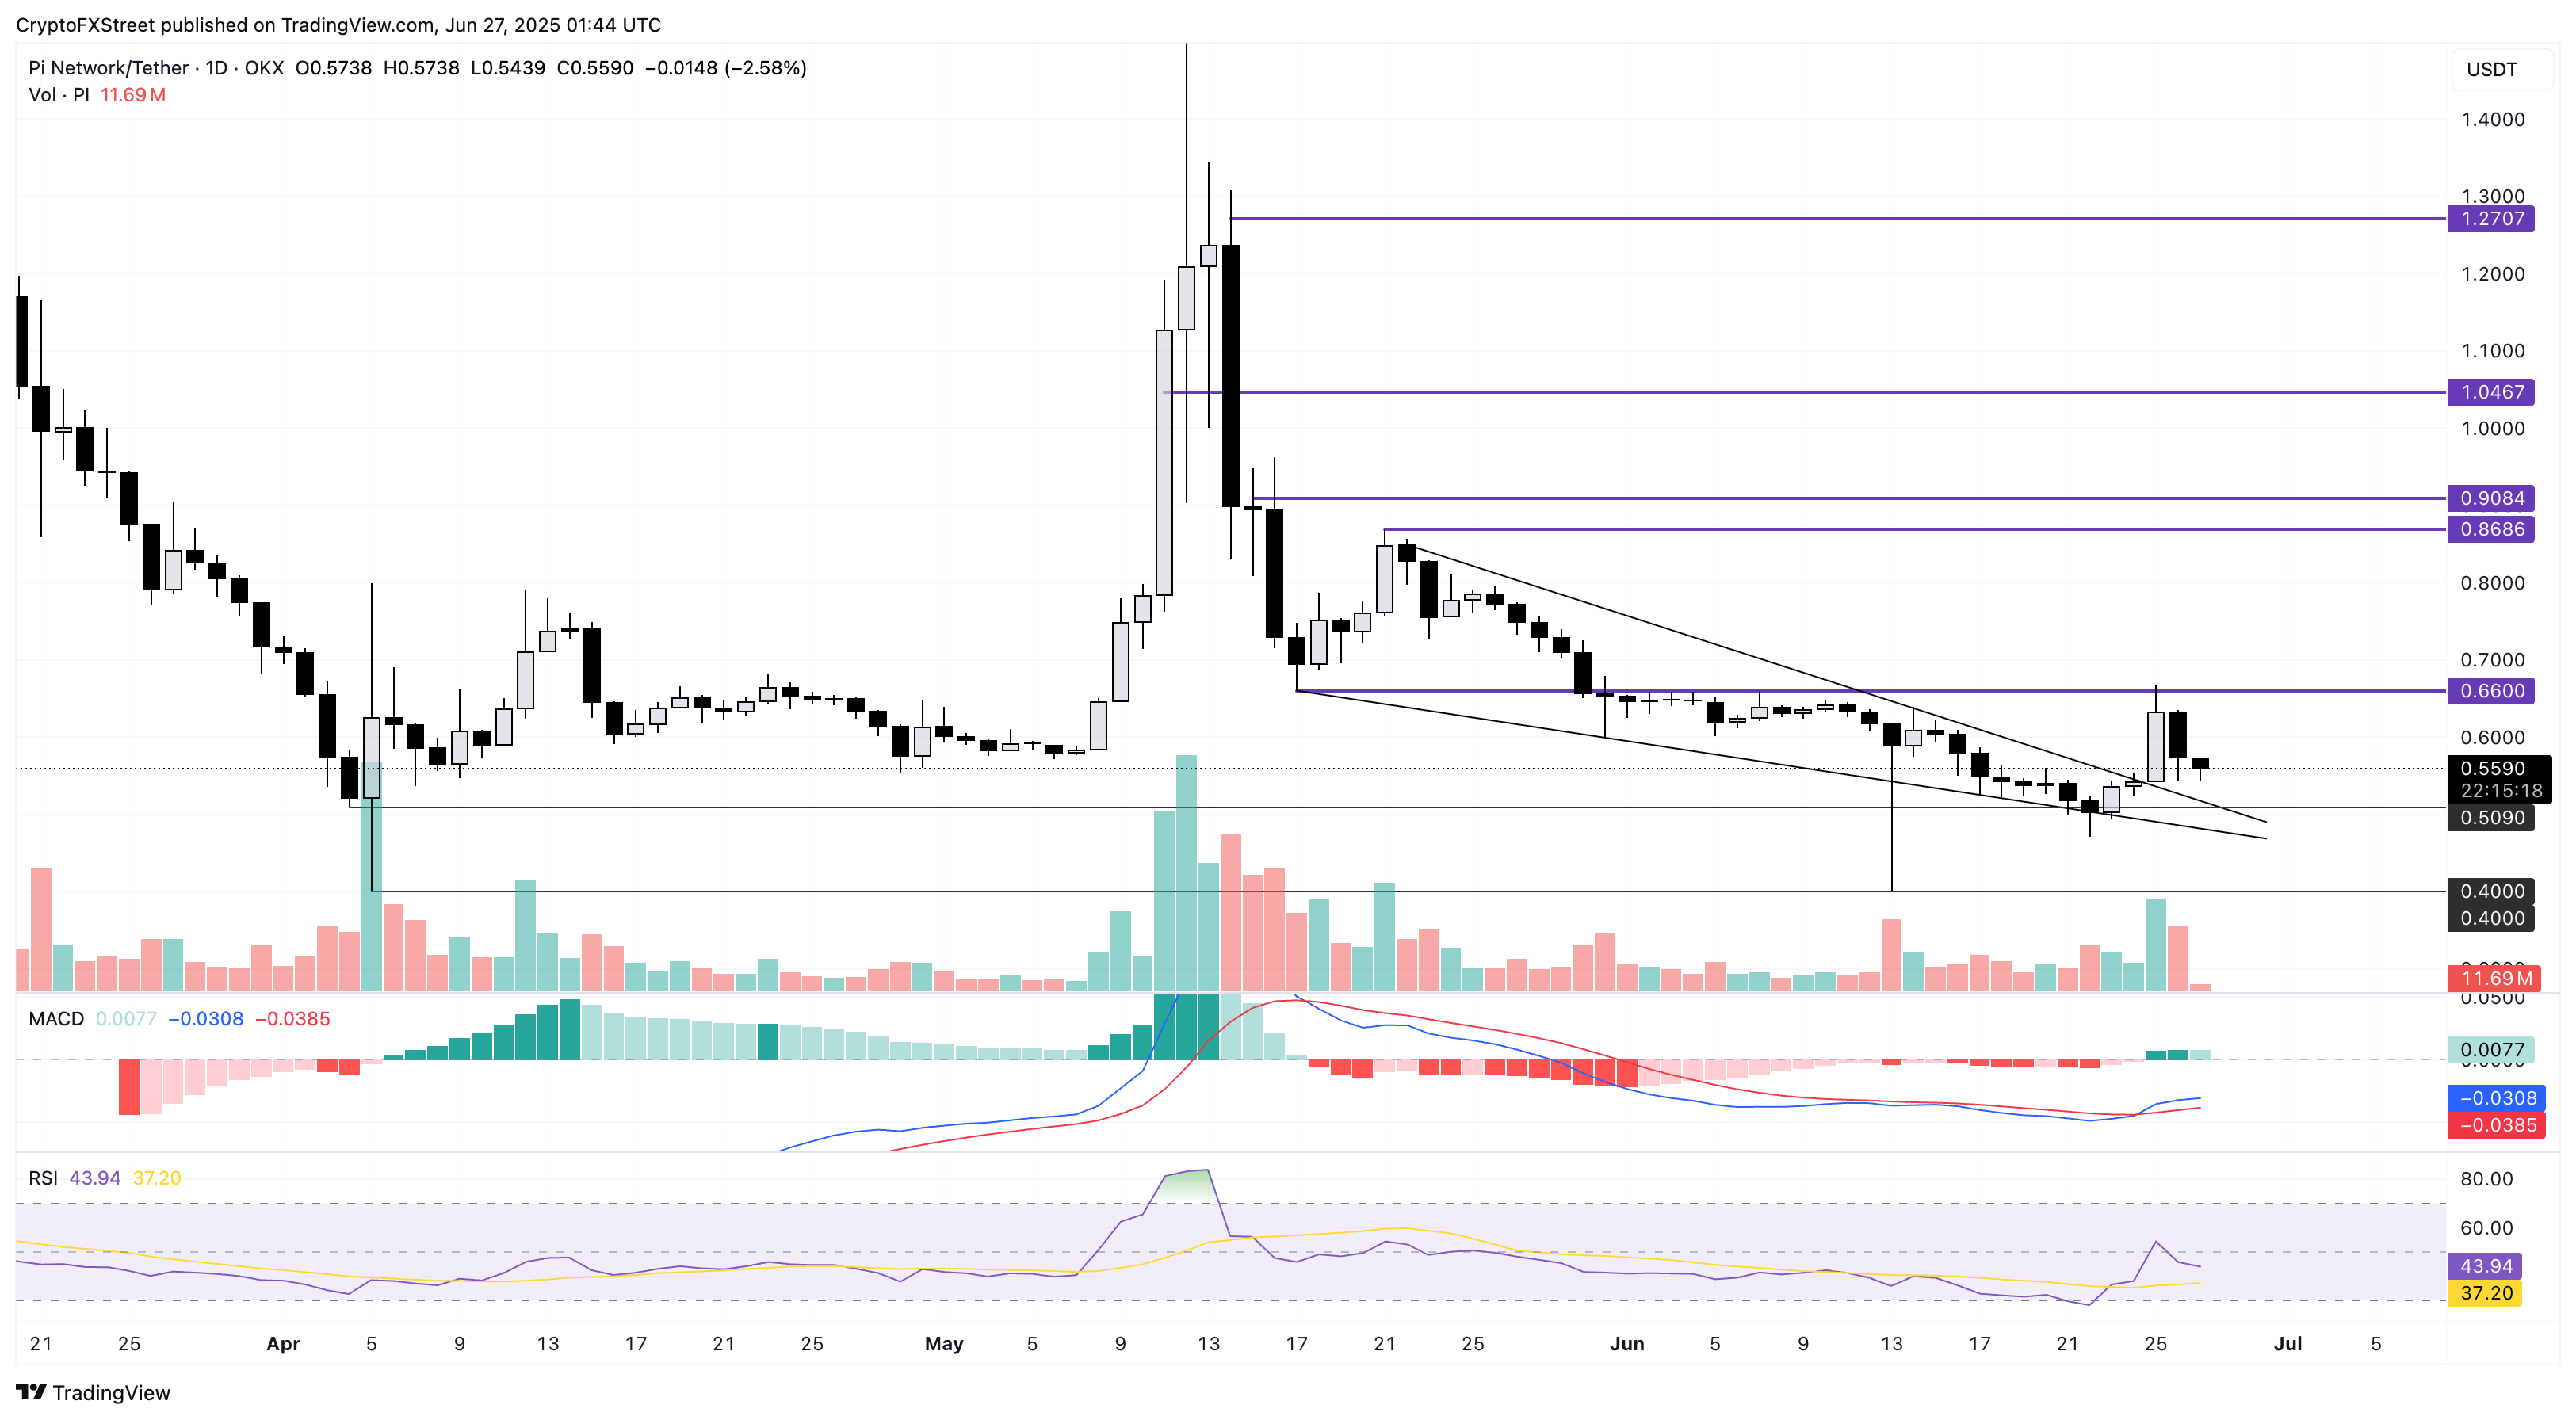
PI/USDT daily price chart.
However, with a potential announcement of Generative AI features on Saturday, a closing above $0.66 could extend the uptrend to the $0.86 level marked by the May 21 high.
SPX6900 meme coin could break under $1
The SPX6900 meme coin loses ground as bullish momentum fades, resulting in a 12% drop over two days. At the time of writing, SPX extends the pullback by 0.50% on Friday.
The declining trend targets the 50% Fibonacci retracement level at $1.02, which is drawn between the year-to-date high and low, spanning from $1.80 to $0.25. A clean drop below the 50% level could test the monthly low at $0.91.
The MACD indicator displays both the MACD and signal lines declining towards the zero line as red histogram bars rise from the same line, indicating a supply surge. Still, the RSI is fluctuating NEAR the halfway line, suggesting uncertainty in trend momentum.
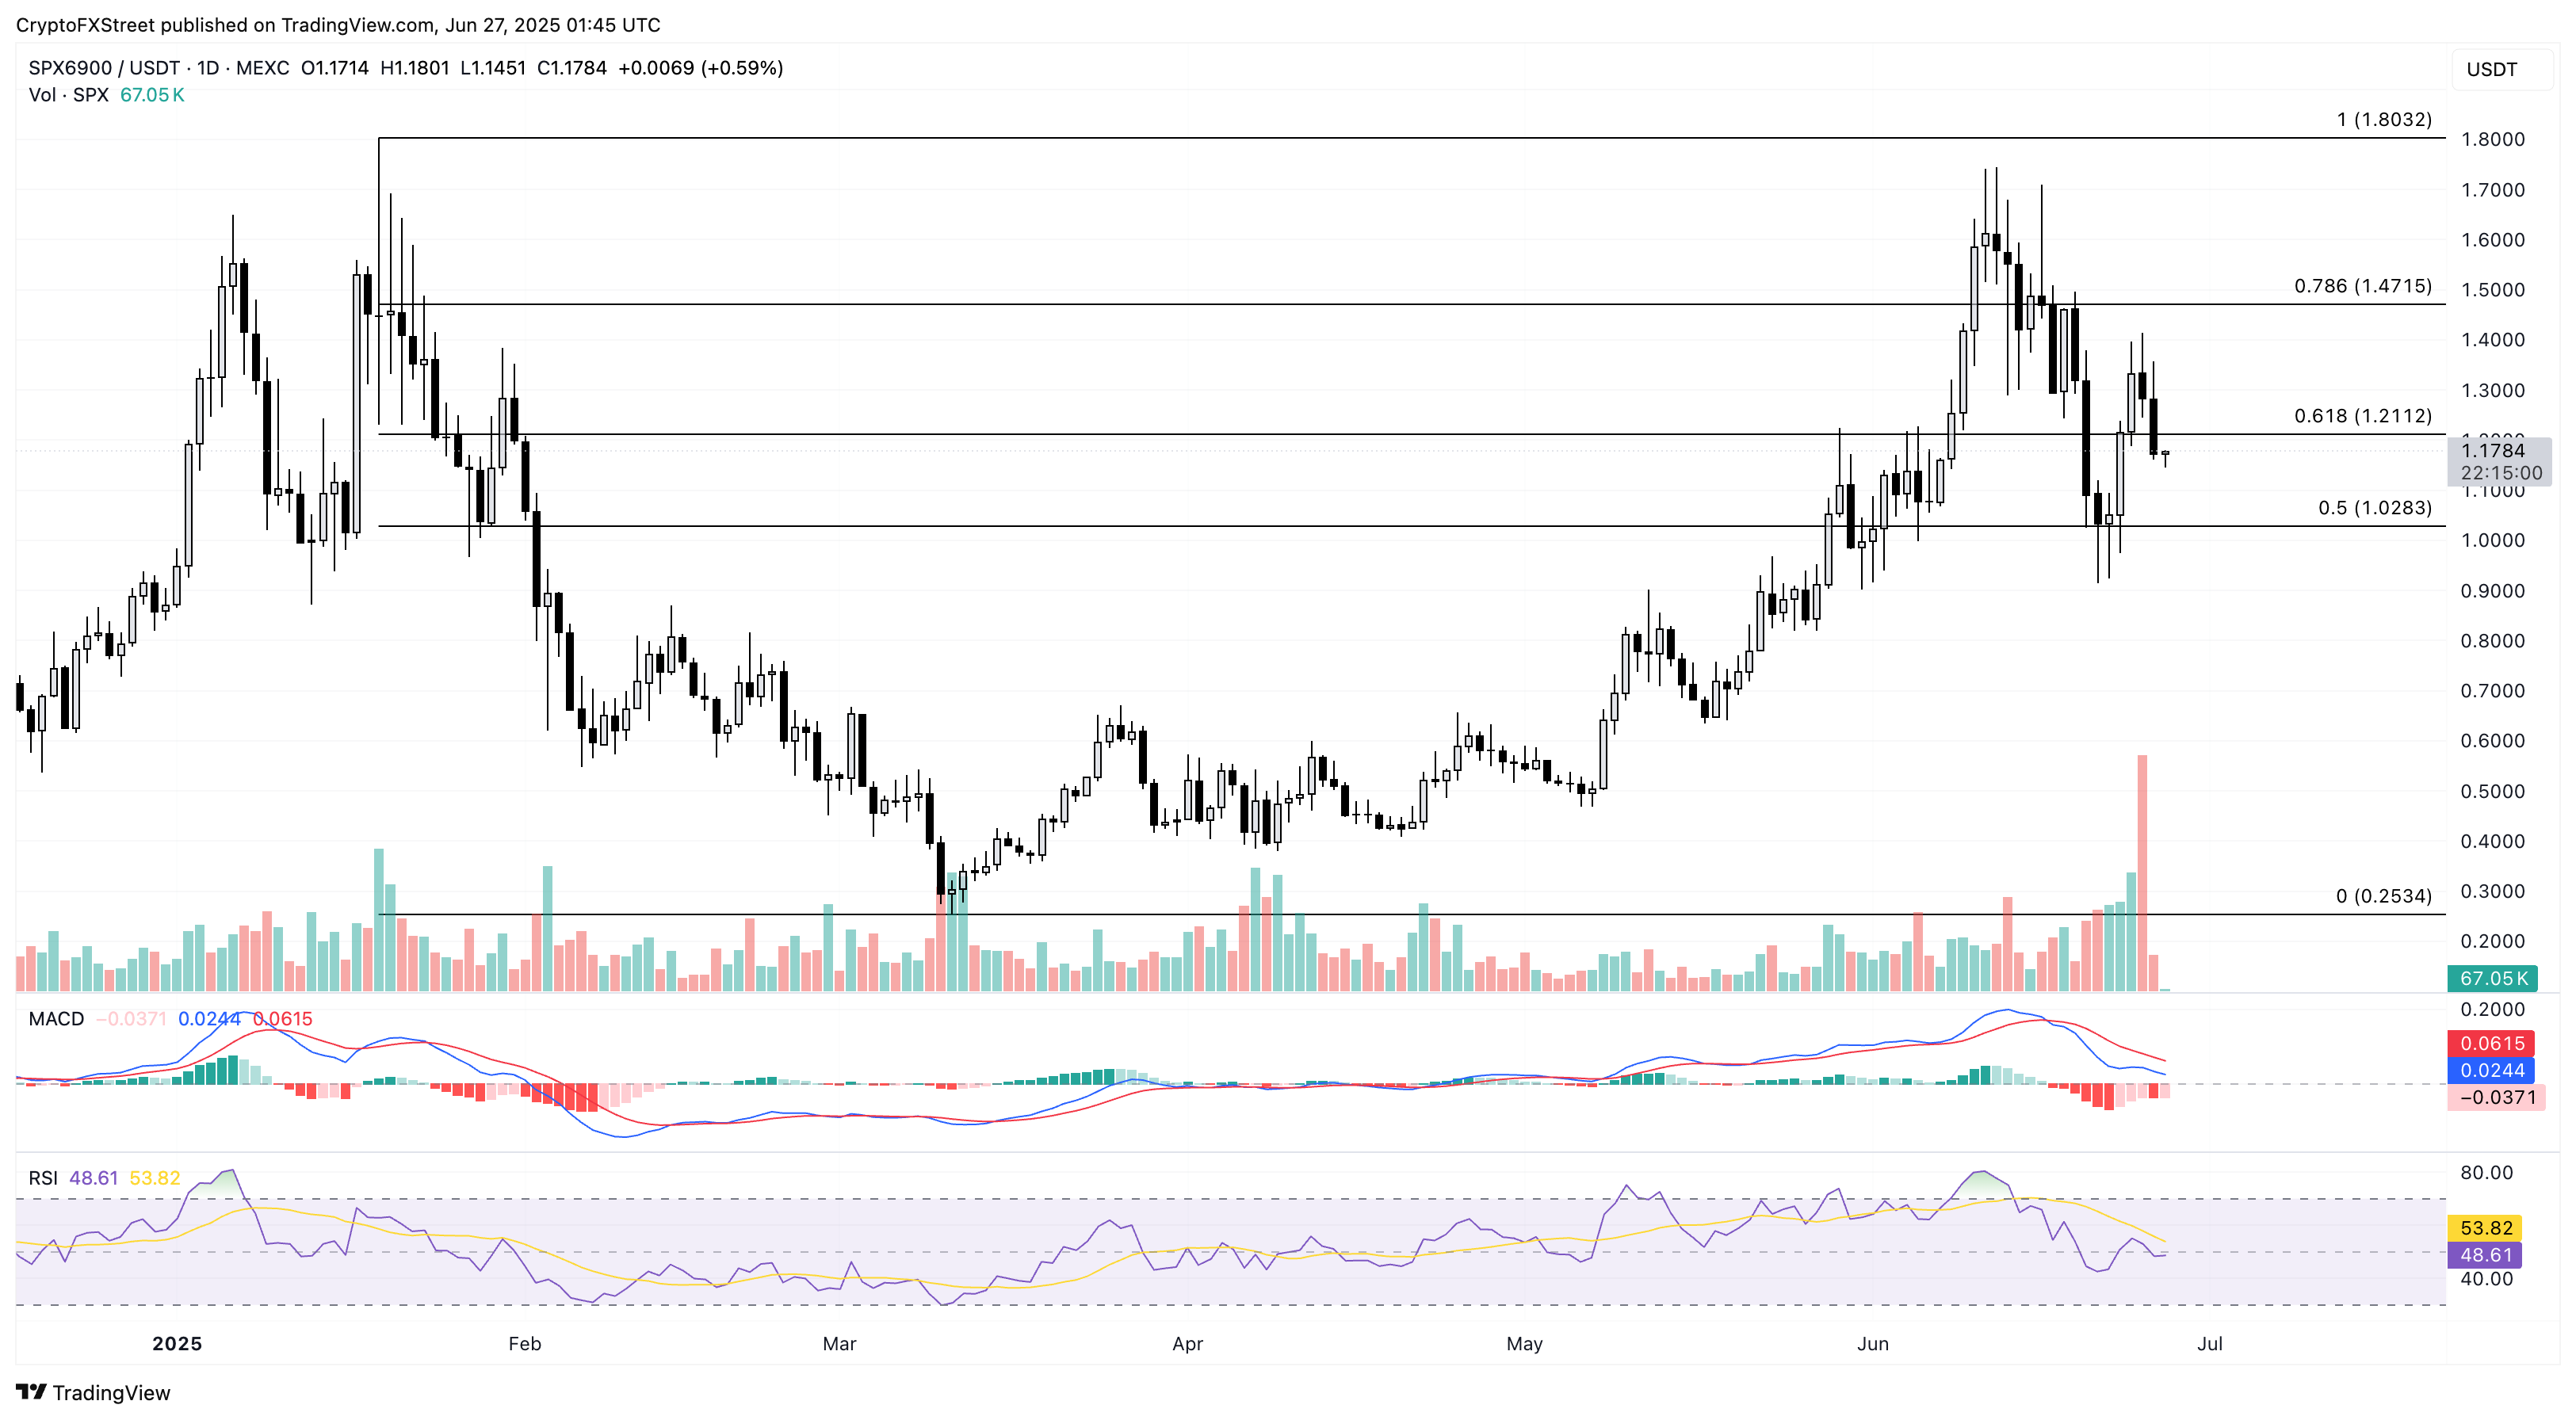
SPX/USDT daily price chart.
If SPX reclaims the 61.8% Fibonacci level at $1.21, an uptrend to $1.47 marked by the 78.6% level could be possible.
Celestia fails to break out of the falling channel
Celestia edges higher marginally at press time on Friday after the two days of intense selling, erasing the weekly gains. TIA reversed from a falling channel’s resistance trendline, formed by connecting the dots on May 14, June 11 and June 25.
The support trendline is connected by the lows on May 17, May 31 and June 22. Celestia’s declining trend targets the monthly low of $1.31, while a potential closing below this could test the support trendline close to the $1.00 round figure.
The MACD indicator fails to signal a clear buy call, as the MACD and signal lines merge and risk reverting to a declining trend. The RSI at 33 floats above the oversold boundary line, suggesting a bearish inclination.
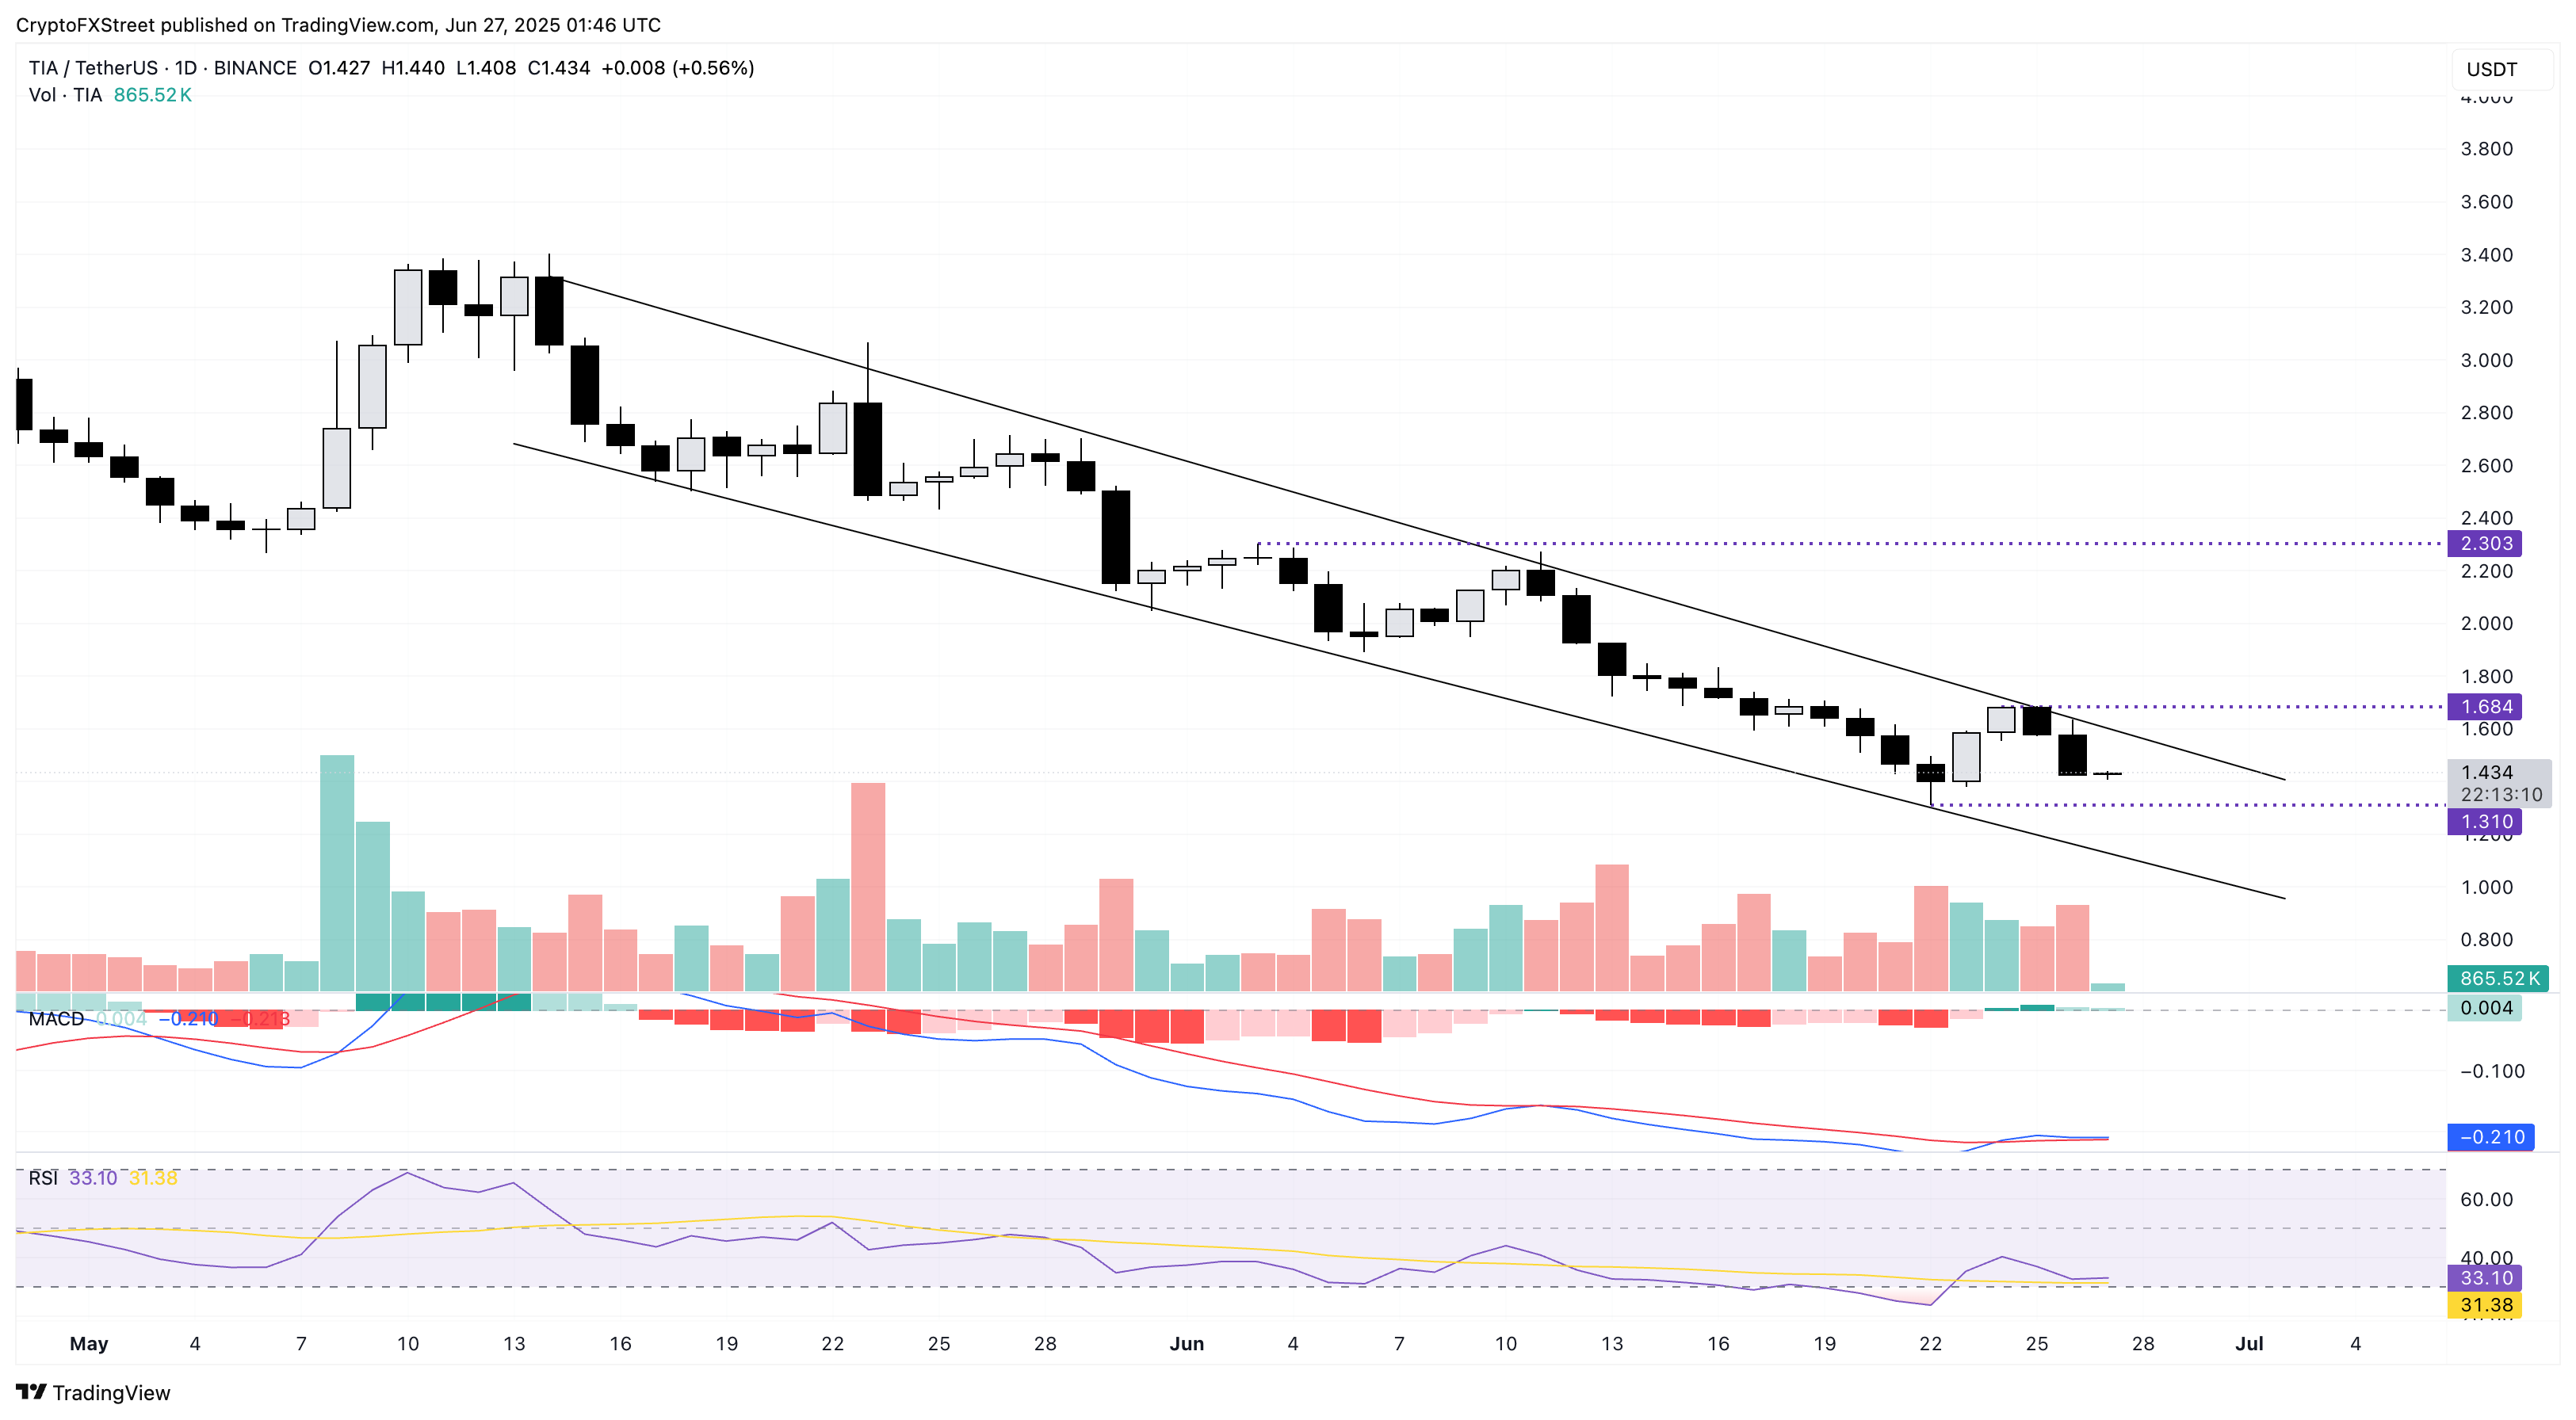
TIA/USDT daily price chart.
However, a potential close above the $1.68 weekly high will break the overhead trendline, which could extend the trend towards the $2.30 monthly high.
