🚀 Bitcoin Smashes $107K, Fueling DeFi Frenzy: PENDLE, AERO, UNI Lead the Charge

Bitcoin''s blistering rally past $107,000 has sent shockwaves through DeFi—and the usual suspects are capitalizing. PENDLE, AERO, and UNI are surging as traders pile into leveraged bets, proving once again that crypto markets move faster than a Wall Street analyst downgrading a stock after 10 green candles.
DeFi''s High-Flyers Take Off
While Bitcoin soaks up headlines, DeFi tokens are quietly (or not so quietly) printing gains. PENDLE''s yield-engineering playbook, AERO''s speculative vapor, and UNI''s perpetual ''v3 upgrade hype'' are drawing bloodthirsty capital—because nothing says ''rational market'' like triple-digit APYs and memecoins dressed as infrastructure.
The Cynical Take
Let''s be real: half these projects will be ghost towns by 2026. But today? Today we ride the liquidity wave—until the next ''black swan'' sends everyone scrambling for USDT like it''s 2020 all over again.
Bitcoin resilient at $107,000 eyes bullish reversal
Bitcoin marked a 24-hour high of $108,952 on Monday before falling to $106,000. With a minor recovery during the day, BTC holds above $107,000, while a long shadow candle in the 4-hour chart highlights a crucial support at $106,143.
The price action indicates a bullish failure to surpass the $108,779 resistance, resulting in a bearish engulfing candle formed by a 1.71% decline. A potential closing above this key resistance could propel Bitcoin towards its all-time high of $111,980.
The Relative Strength Index (RSI) at 55 drops to almost halfway level, suggesting a minor decline in bullish momentum.
Further up, the Moving Average Convergence/Divergence (MACD) indicator warns of a cross below its signal line as green histogram bars decline. This suggests a potential bearish turnaround for Bitcoin.
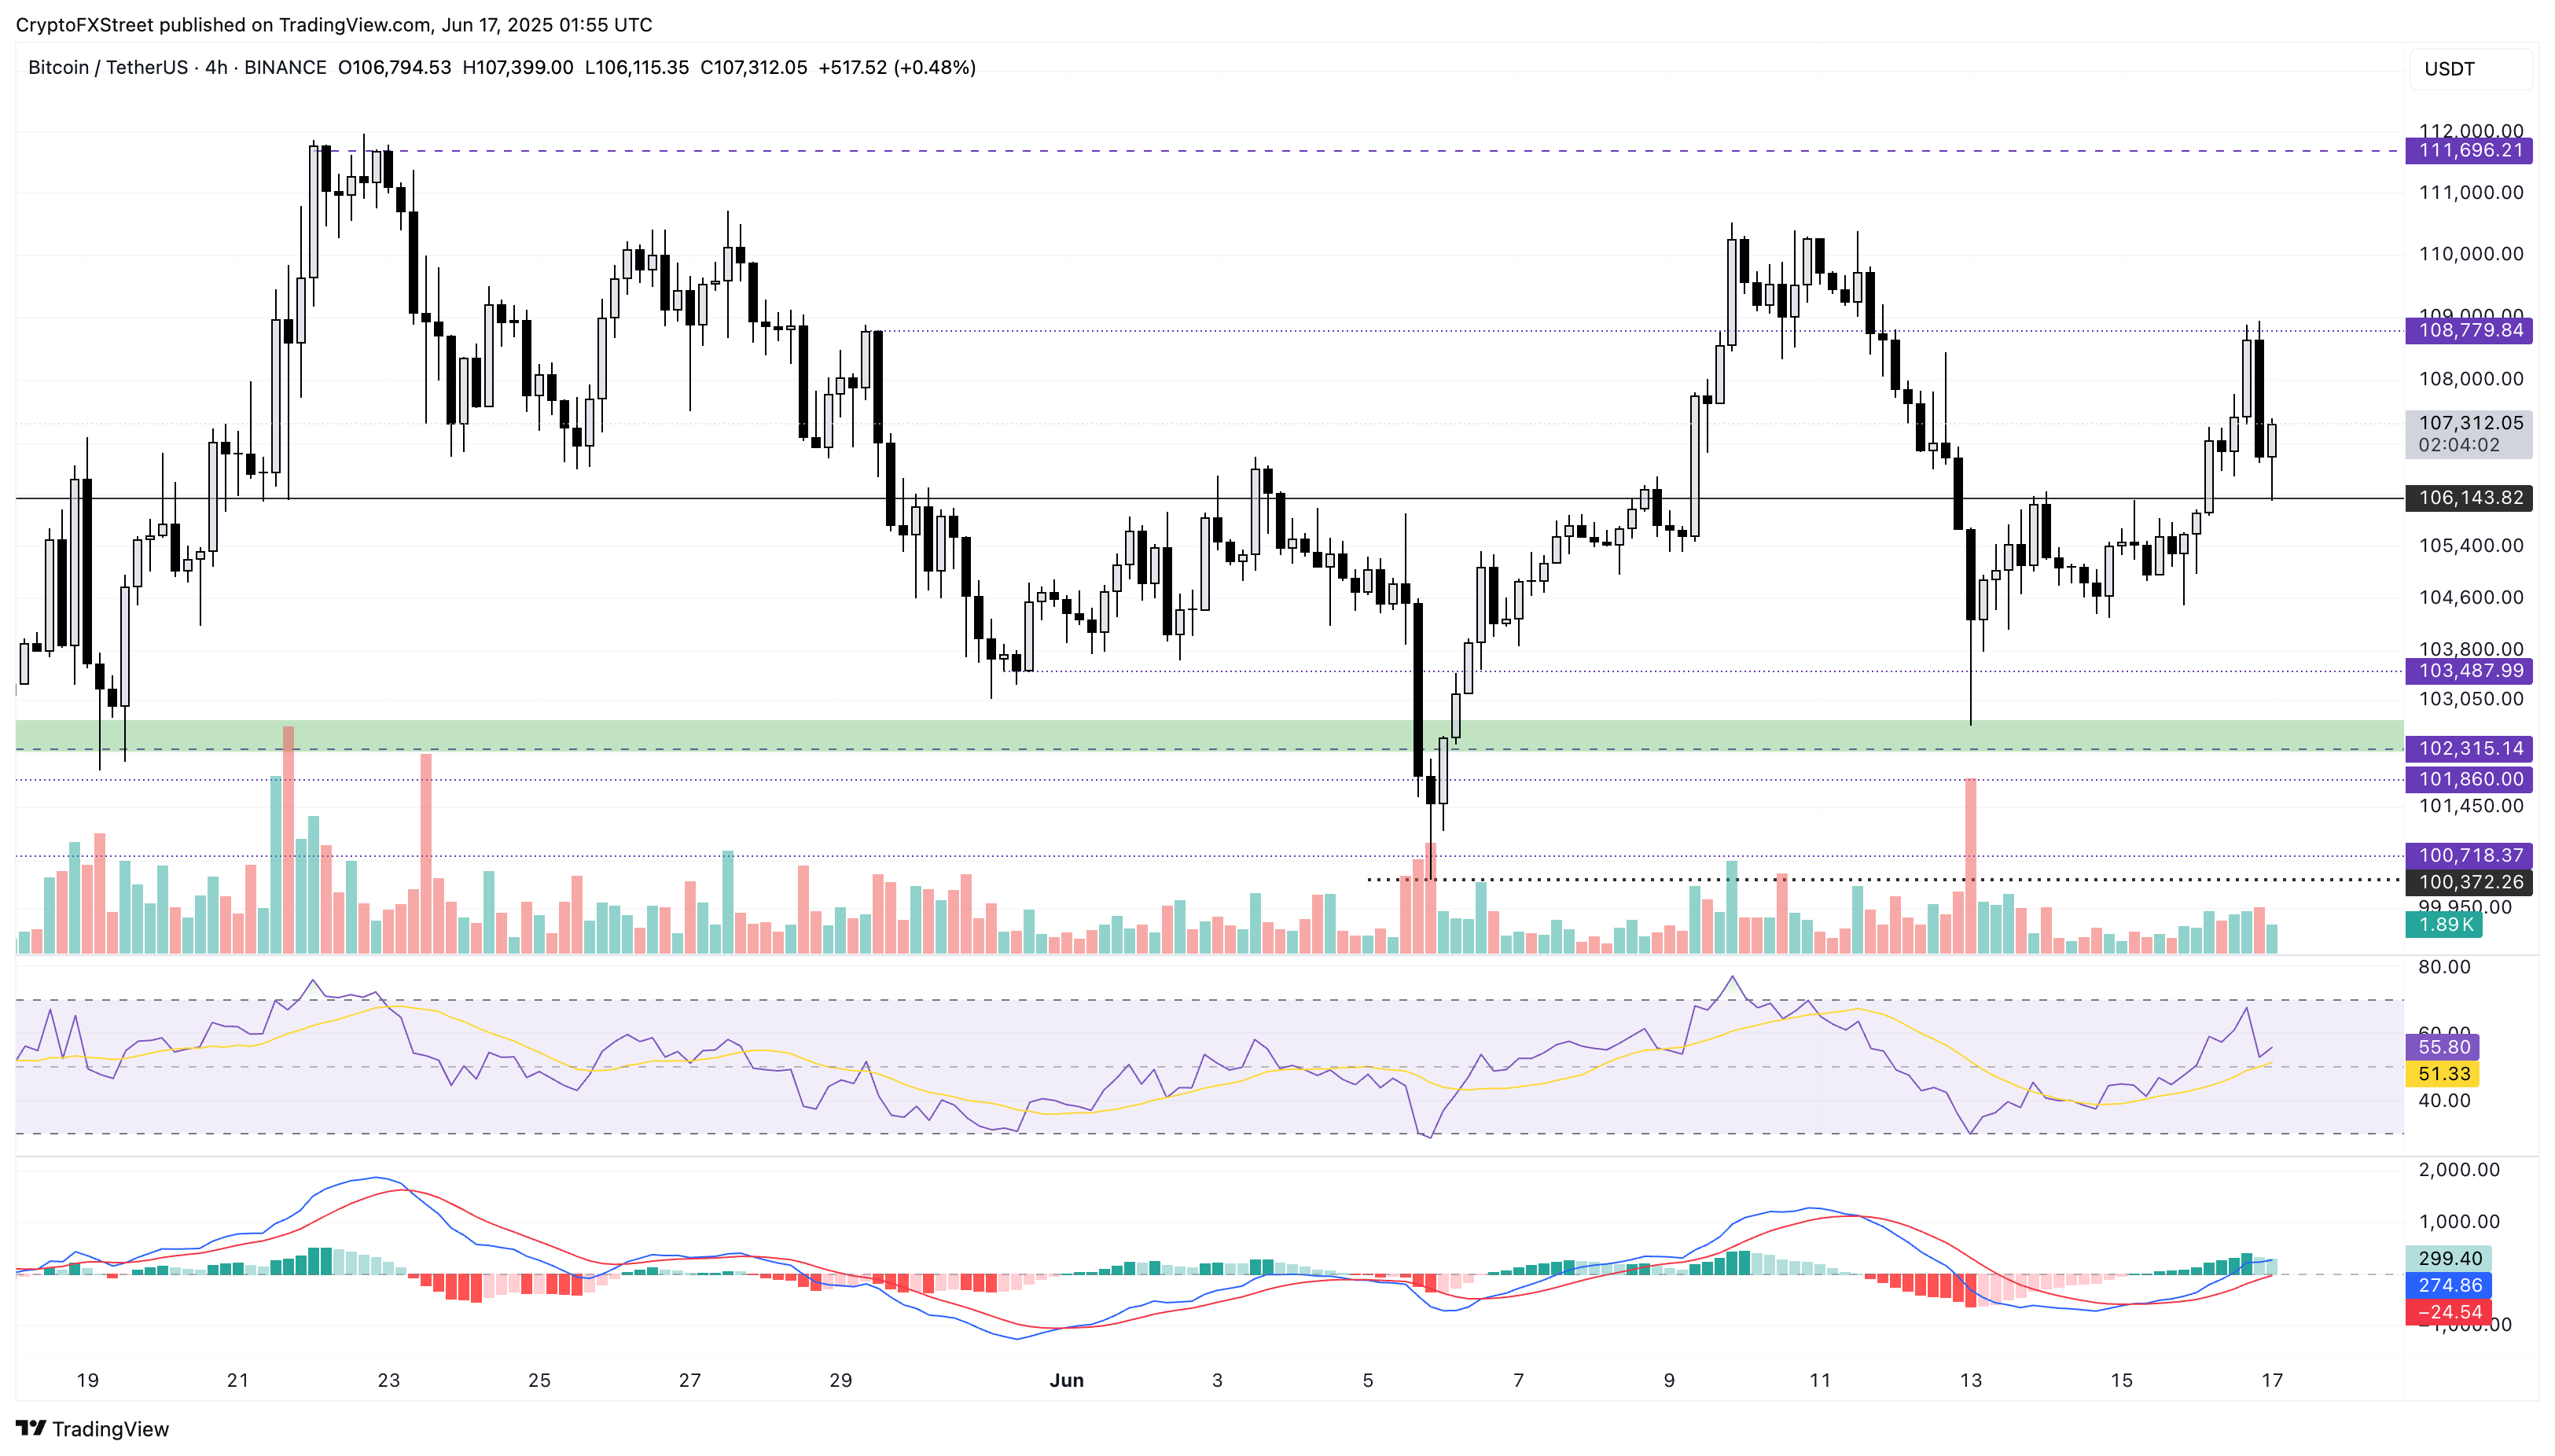
BTC/USDT 4-hour chart.
If bulls fail to hold the ground at $106,143, a closing below this could extend the decline towards $103,487 support marked on May 31.
Pendle''s recovery rally eyes further gains
Pendle marked its first bullish daily candle in six days with a 10% surge on Monday. Taking off from the $3.598 support floor, PENDLE hits the crucial resistance at $4.132 marked on the 4-hour chart (shared below).
Due to excessive overhead supply, Pendle takes a breather with two consecutive bearish candles, each with long tails, representing strong demand absorbing the supply.
A closing above $4.132 could propel PENDLE to the $4.346 level, last tested as support on June 10.
The RSI indicator in the 4-hour chart nears the overbought boundary as buying pressure grows. However, investors must stay cautious as pullback risk rises amid overbought conditions.
The MACD indicator enters the positive territory while its signal line follows the uptrend, suggesting an increase in bullish momentum.
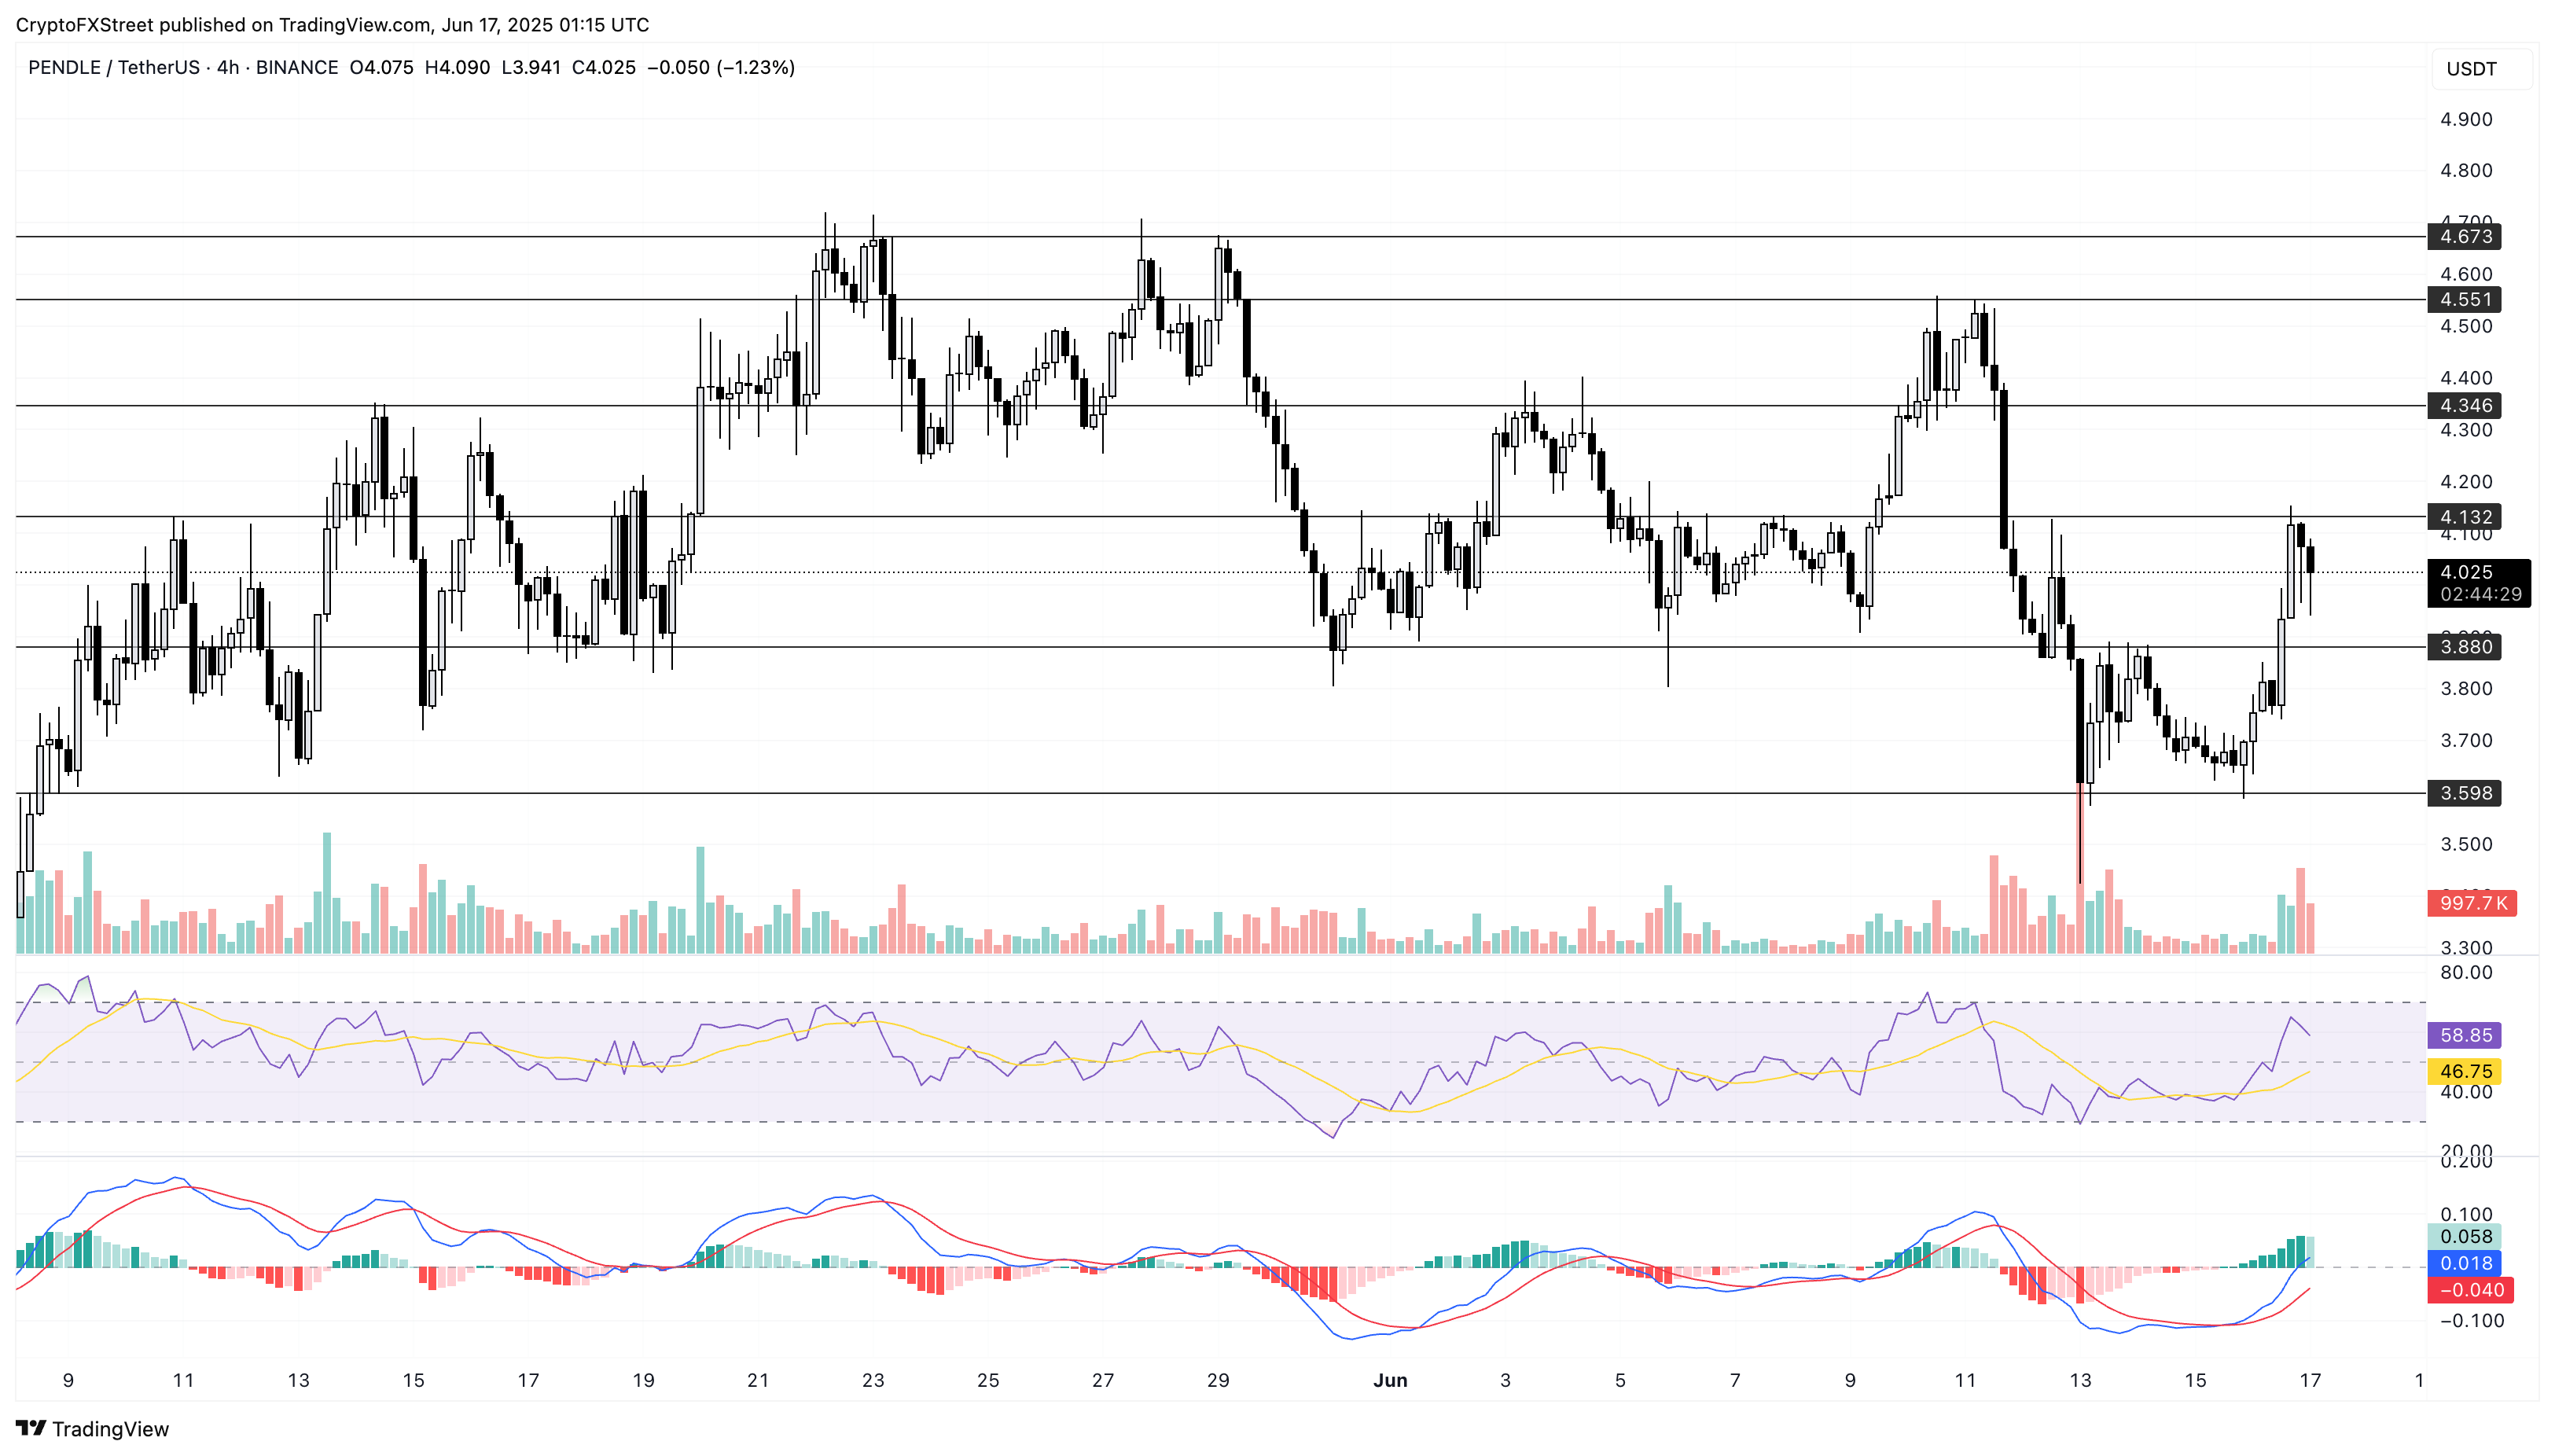
PENDLE/USDT 4-hour chart.
If Pendle falls below $3.880, it could retest the $3.598 support floor.
AERO eyes 50% retracement level to reclaim $1
Aerodrome Finance is up by over 50% at press time so far in June after a 5.45% surge on Monday. To extend the uptrend, AERO aims to surpass the 50% Fibonacci level at $0.829, retraced between December’s high at $2.334 and the year-to-date low at $0.282.
Forming a rounding bottom reversal after a channel breakout in the daily chart (shared below), AERO targets the $1 mark, aligning with the 61.8% Fibonacci level. As investors with an entry point below the 50% Fibonacci level increase buying pressure, the 61.8% level, aligning with a psychological mark, could provide an exit point.
Further up, the volume surge supports the recent recovery, increasing the breakout chances. While the RSI is NEAR the overbought boundary, the MACD indicator is trending higher with its signal line. Thus, the momentum indicator suggests a surge in bullish momentum.
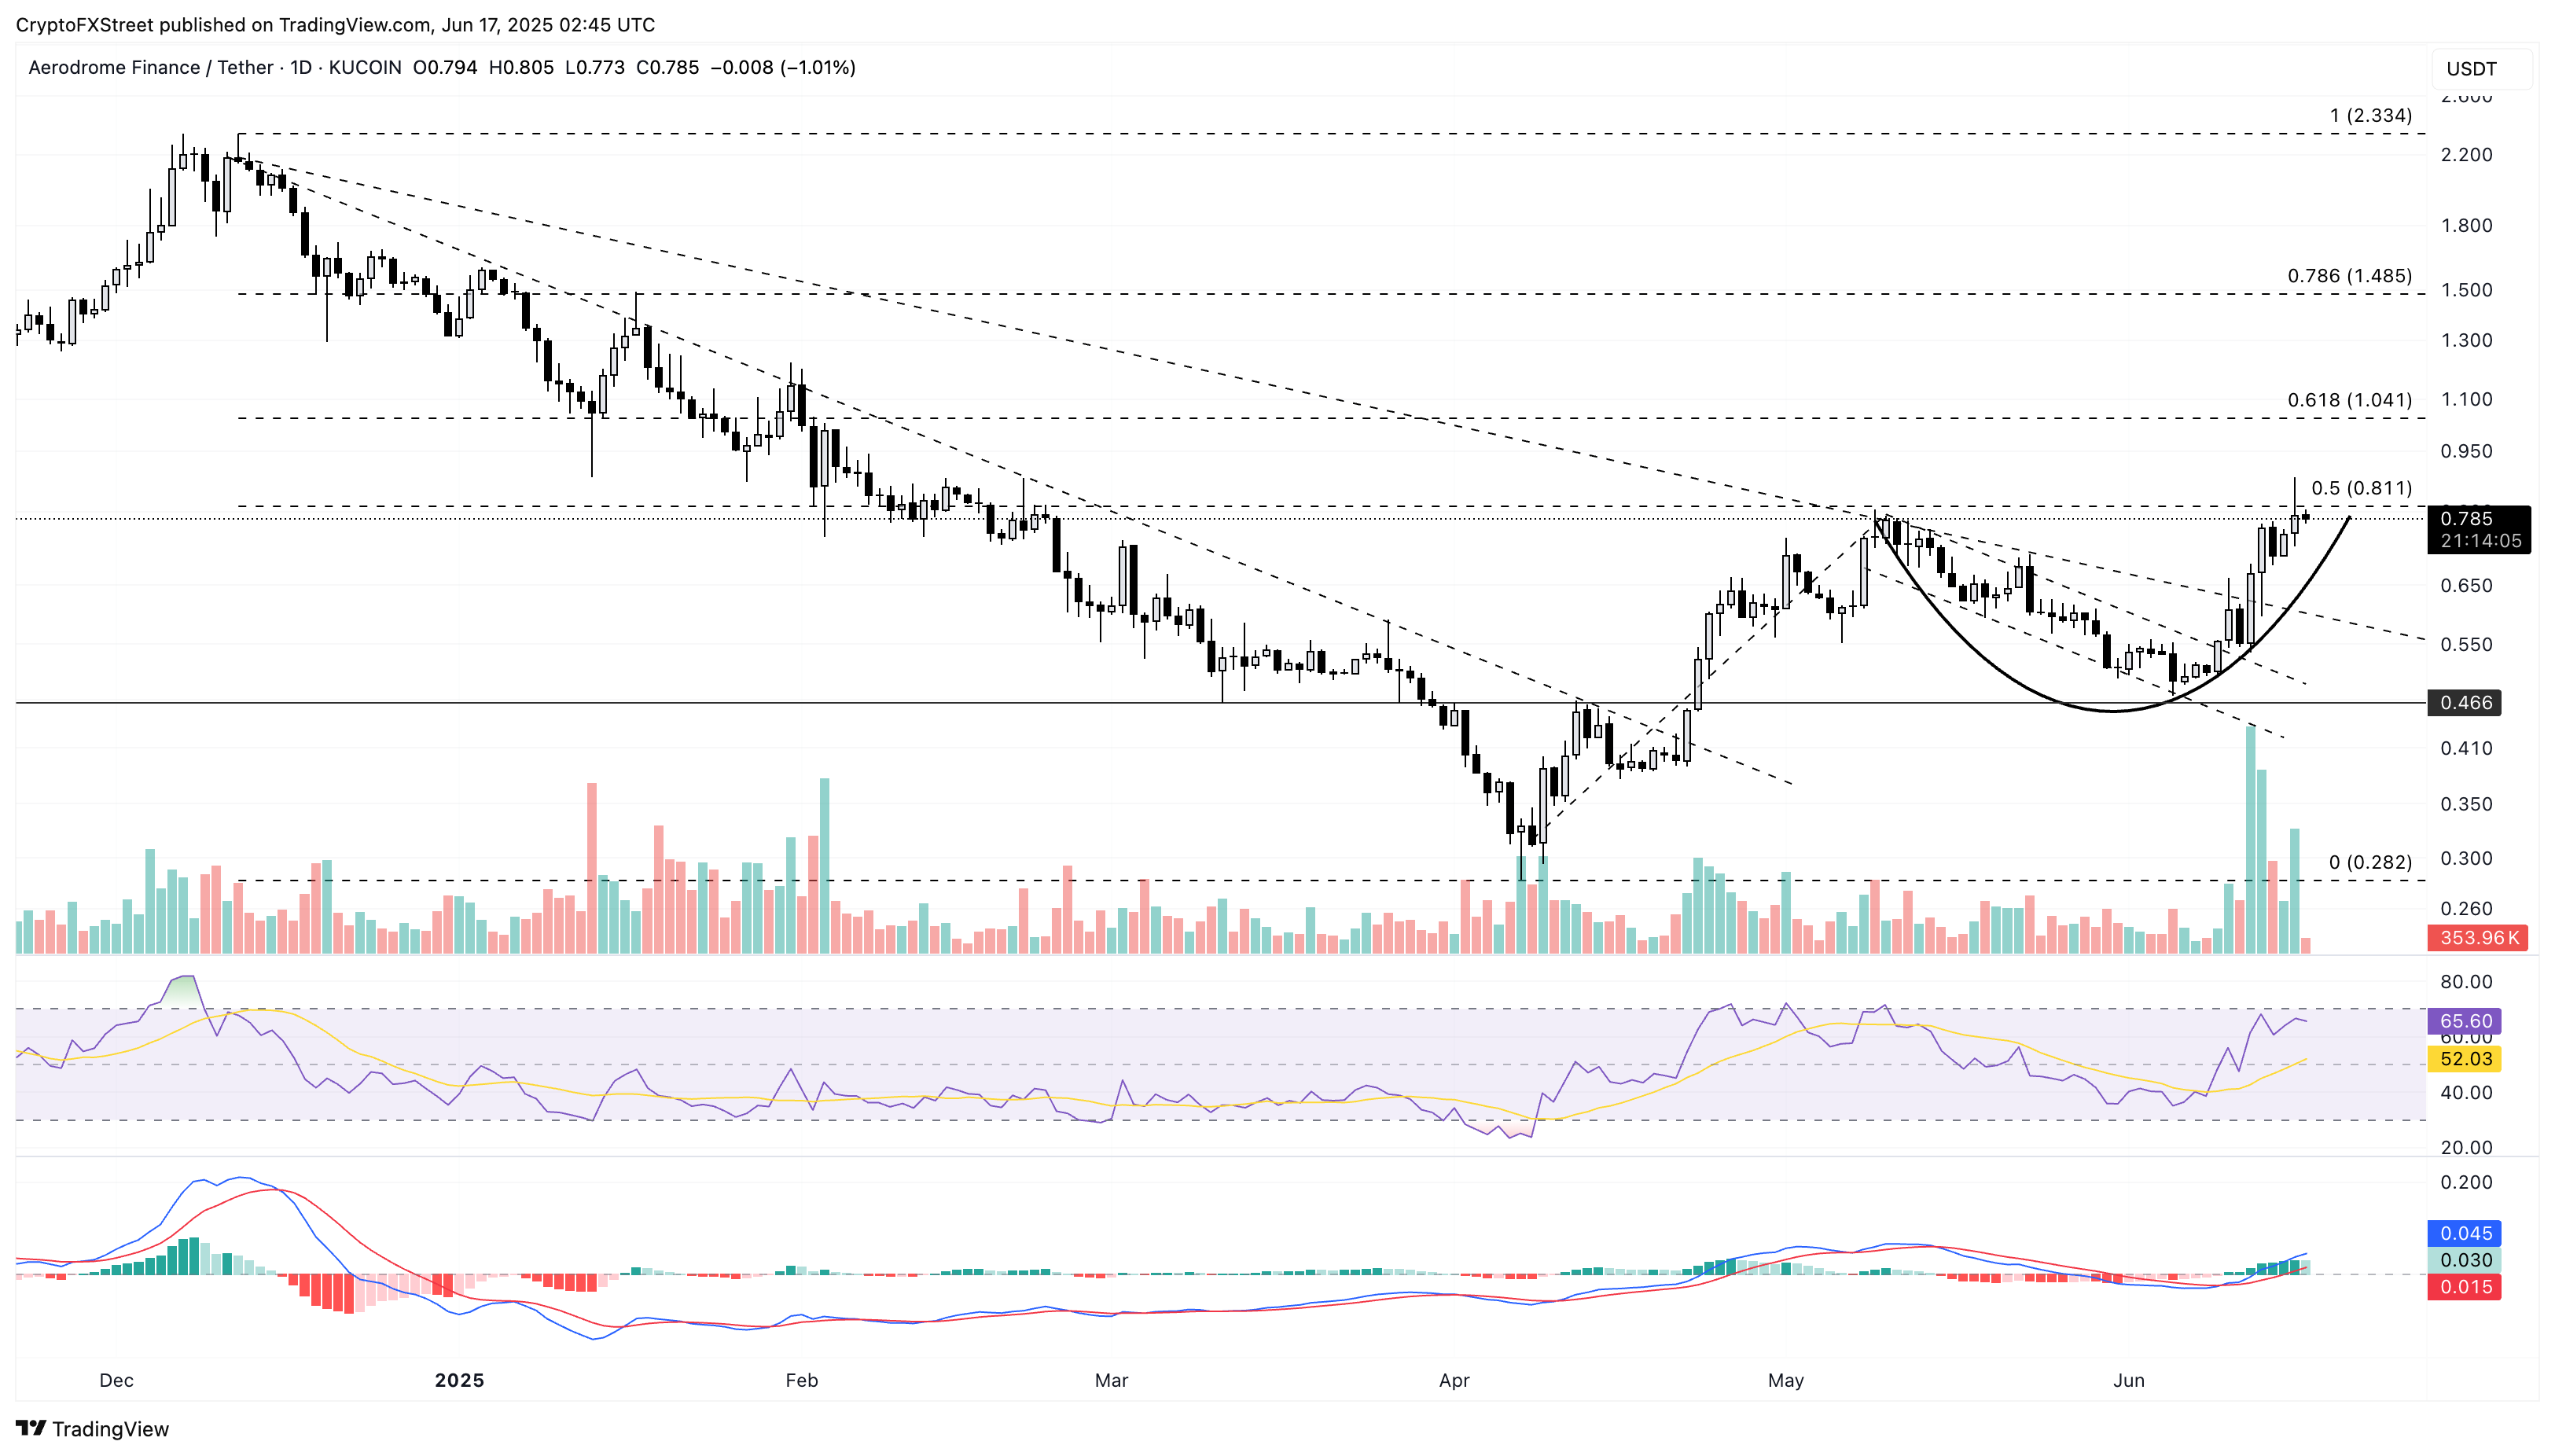
AERO/USDT daily chart.
If AERO fails to cross above the 50% Fibonacci level at $0.829, it could test Monday’s low at $0.726.
Uniswap''s bullish reversal gains momentum
Uniswap extends its gain by over 4% at press time on Tuesday after a 3.70% jump the previous day. With a bullish start to the week, the reversal in UNI from the $7.000 key level gains momentum.
The DeFi token creeps above the $7.697 resistance, which last marked a peak formation on May 29. A closing above this level could propel Uniswap to $8.747, a crucial level formed on February 7.
The RSI line at 59 takes an early reversal before reaching the halfway line, reflecting the underlying bullish resilience. Further up, the MACD indicator and its signal line bearish crossover decline as a green histogram surfaces, suggesting a resurgence in buying pressure.
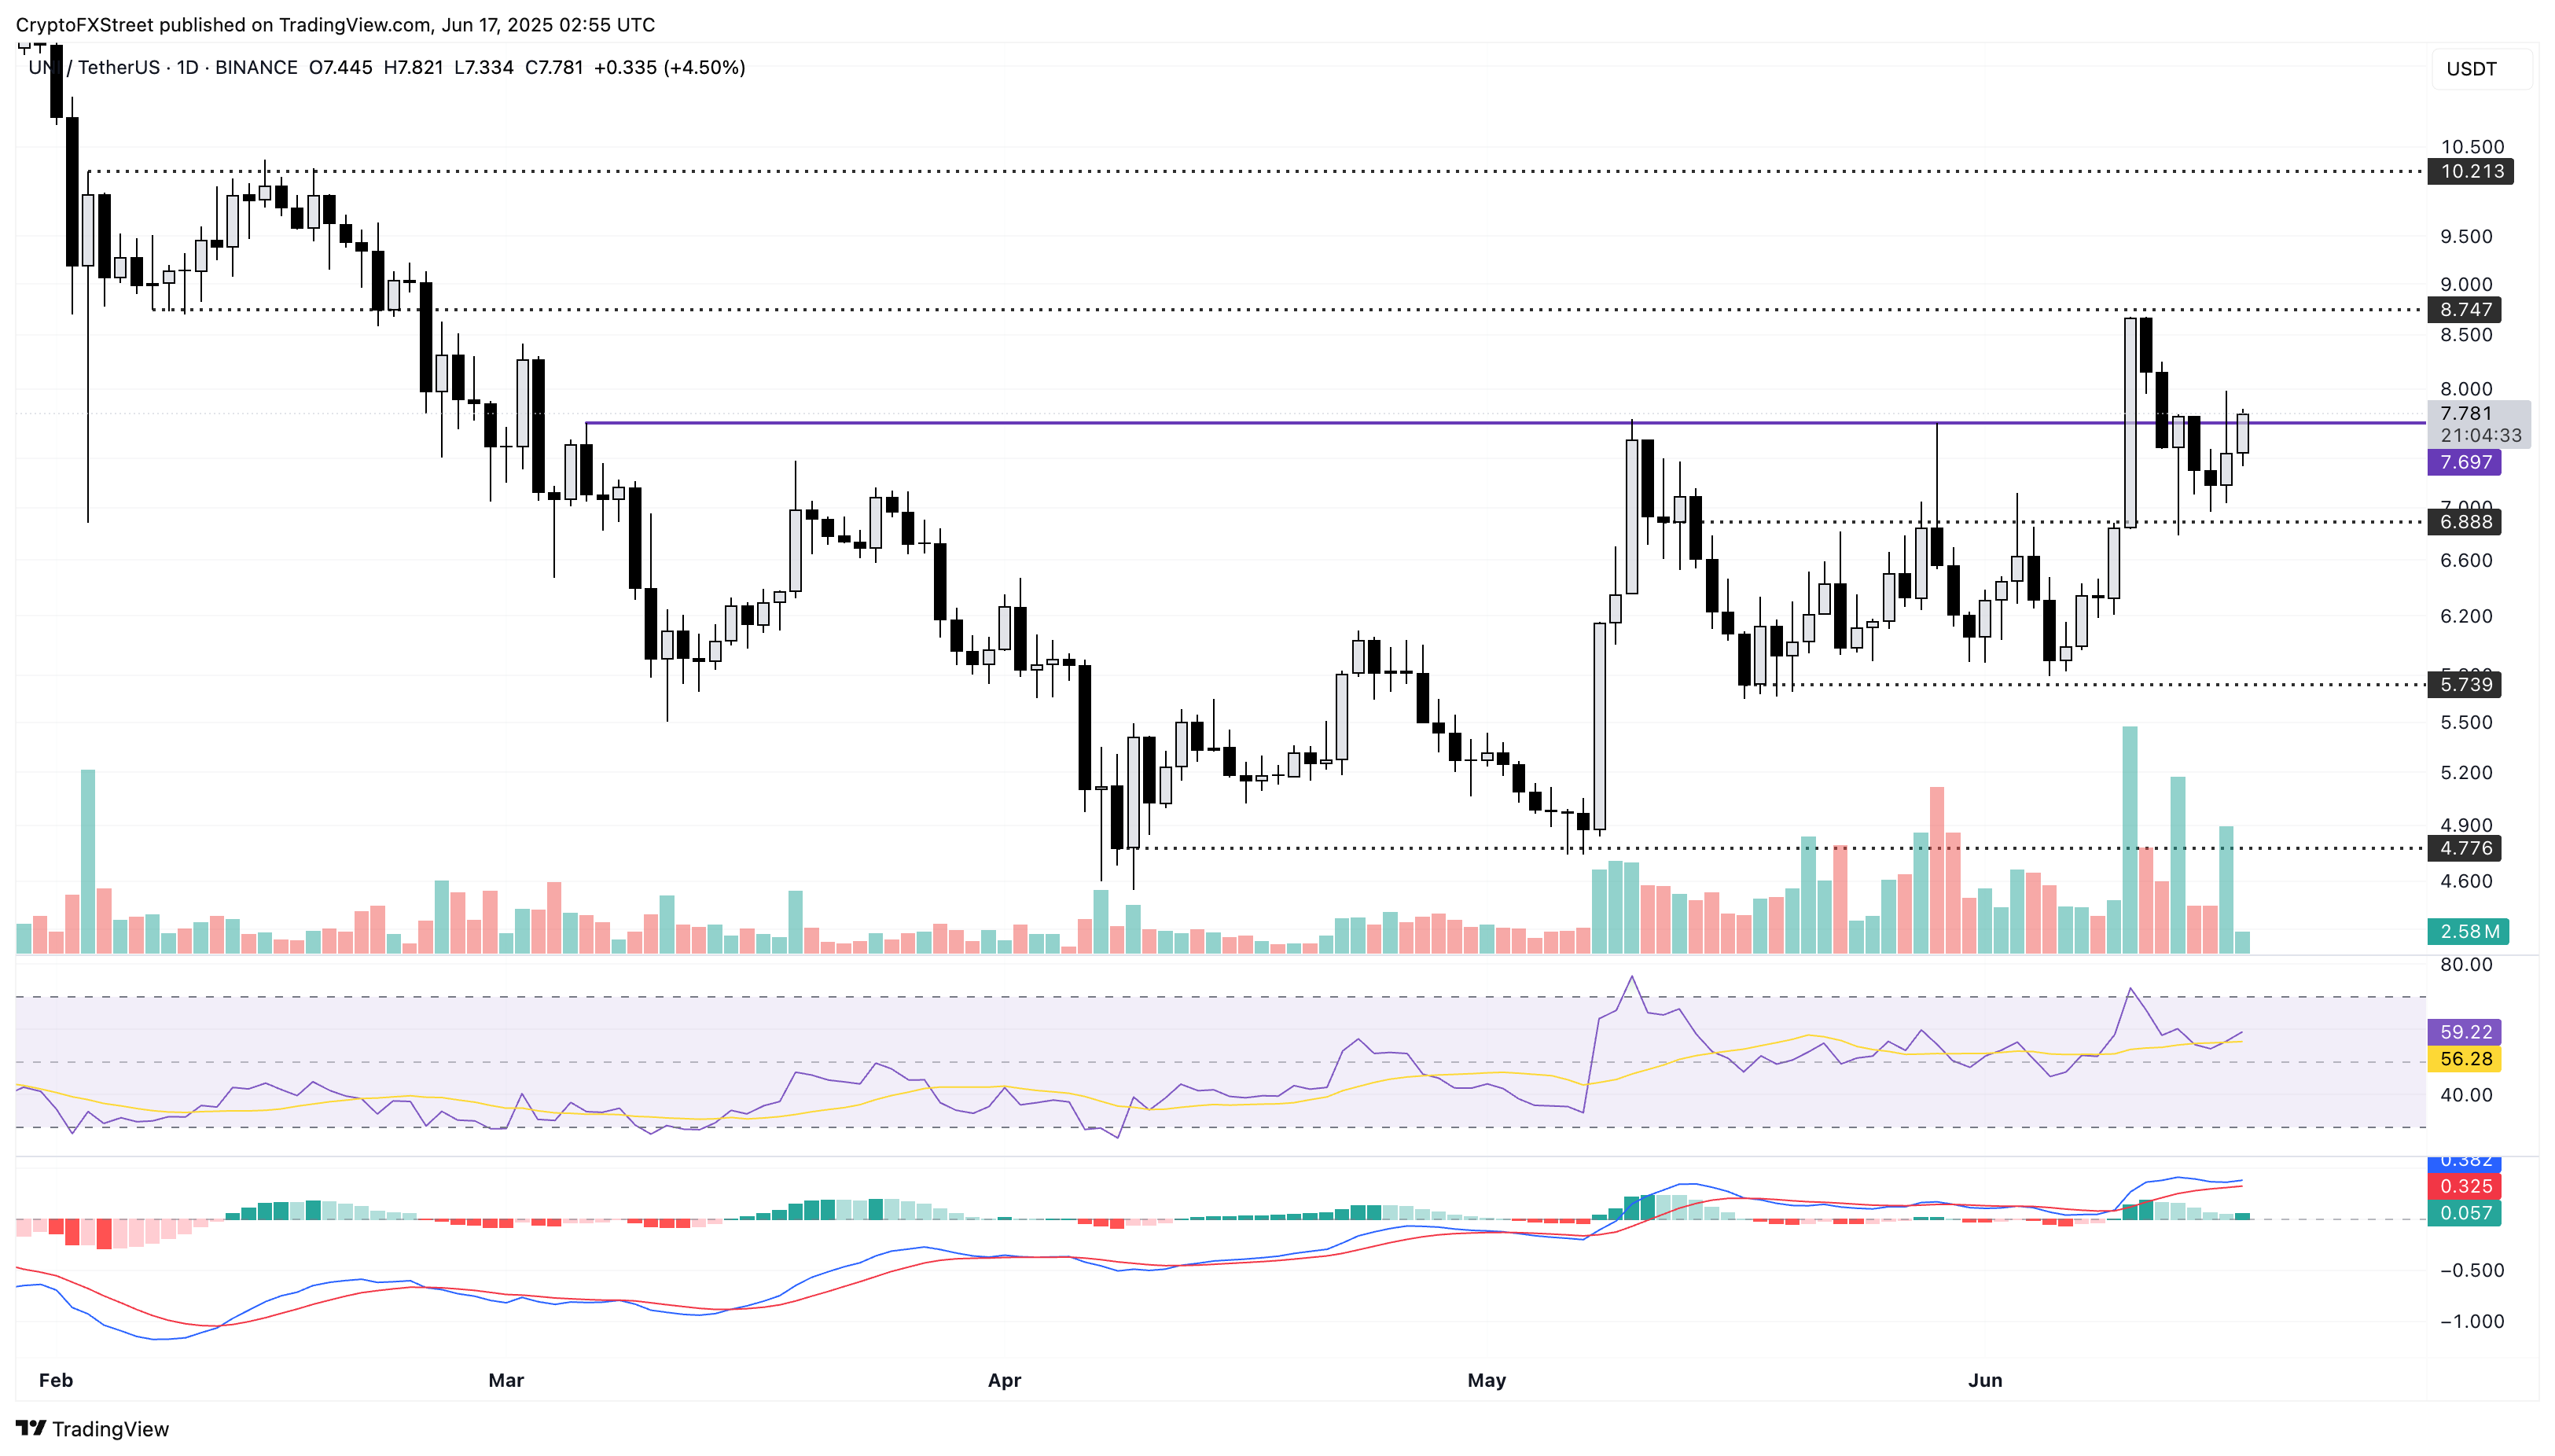
UNI/USDT daily chart.
However, a failure to close above $7.697 could fuel a consolidation with the lower boundary at the $6.888 level, characterized by multiple peaks in May.
