Crypto Alert: Bitcoin, Ethereum, XRP Face Downside Risk as Profit-Taking and Thin Volumes Loom

Market jitters hit crypto as majors flirt with pullbacks.
Bitcoin, Ethereum, and XRP wobble under profit-taking pressure—just as trading volumes taper off. Is this a temporary dip or the start of a deeper correction?
Soft volumes spell trouble.
Thin liquidity amplifies price swings, and right now, the order books look lean. Traders are cashing out gains while sidelined capital waits for clearer signals. Classic crypto volatility at work.
Wall Street’s usual ‘buy the dip’ brigade? Distracted by shiny AI stocks—because why bet on decentralized money when you can chase hype cycles?
Watch those support levels. If they crack, things could get messy fast.
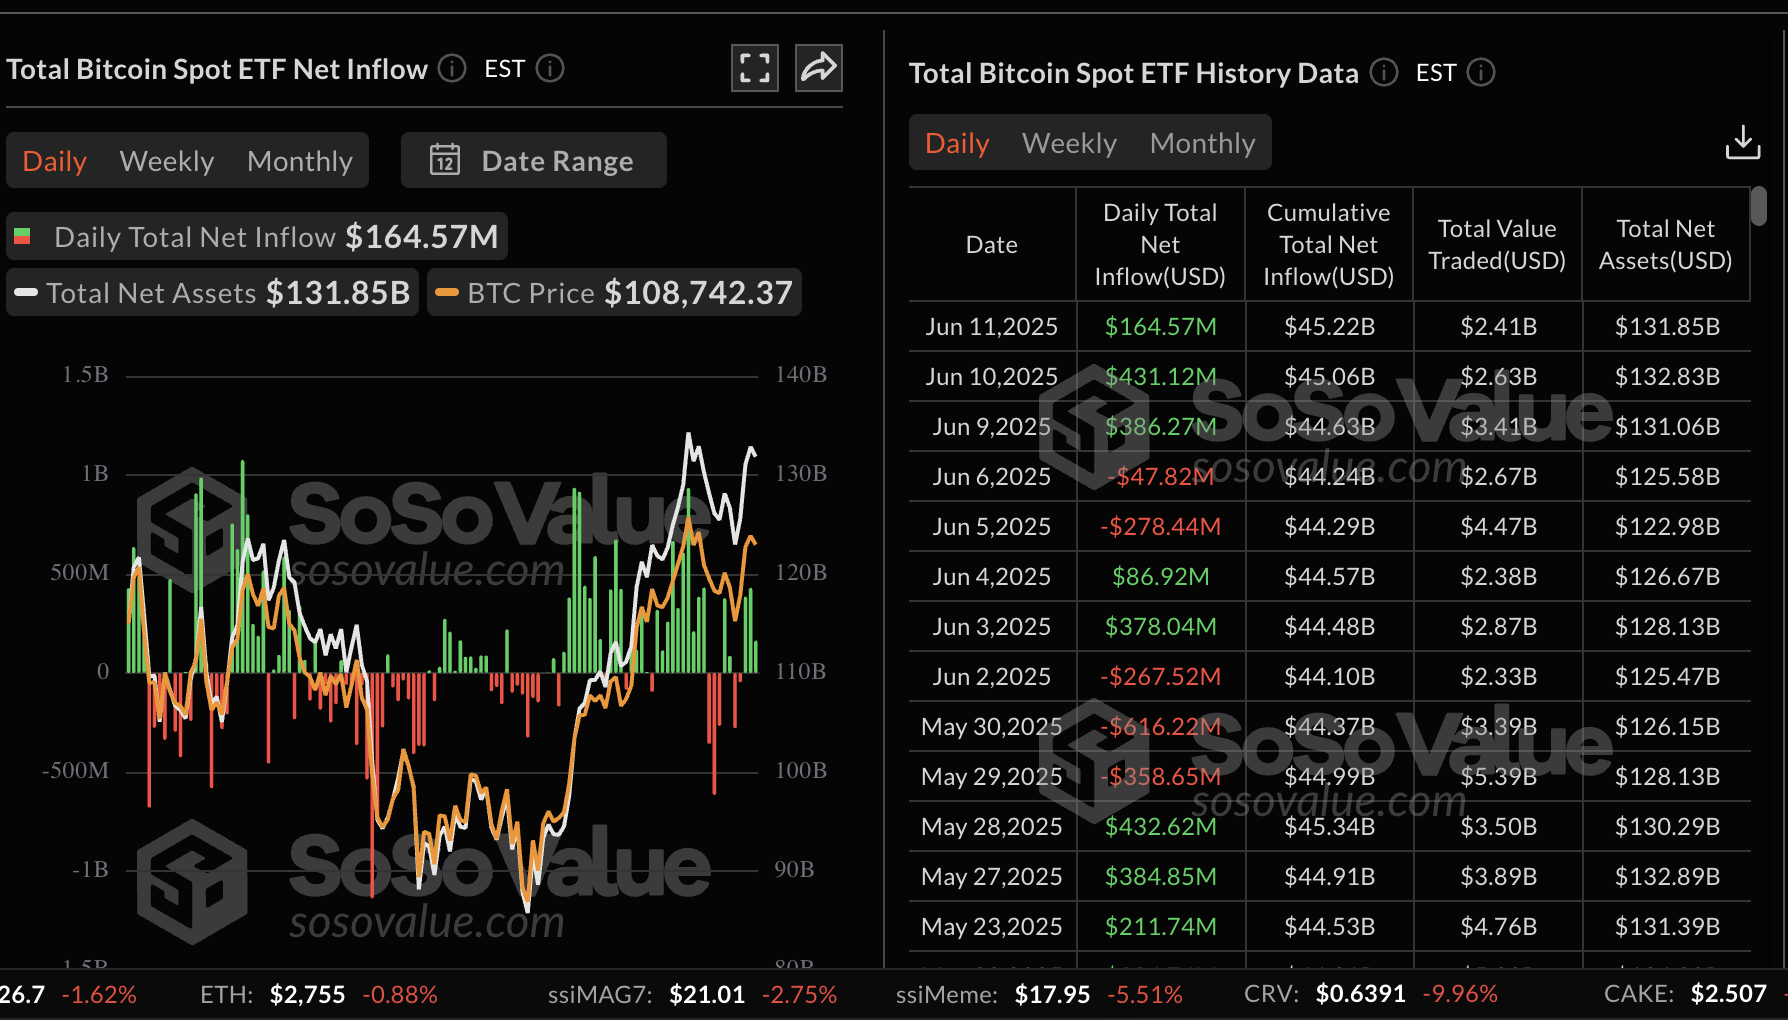
Bitcoin spot ETFs stats | Source: SoSoValue
Institutional interest in Ethereum has steadied since mid-May, with ETH spot ETFs posting 17 consecutive days of inflows. On Wednesday, inflows into the regulated products, allowing investors to seek exposure via stock exchanges without owning the digital token, surged to $240 million, surpassing the $125 million recorded on Tuesday. The persistent increase in ETF inflows suggests that investors see immense potential in the Ethereum price.
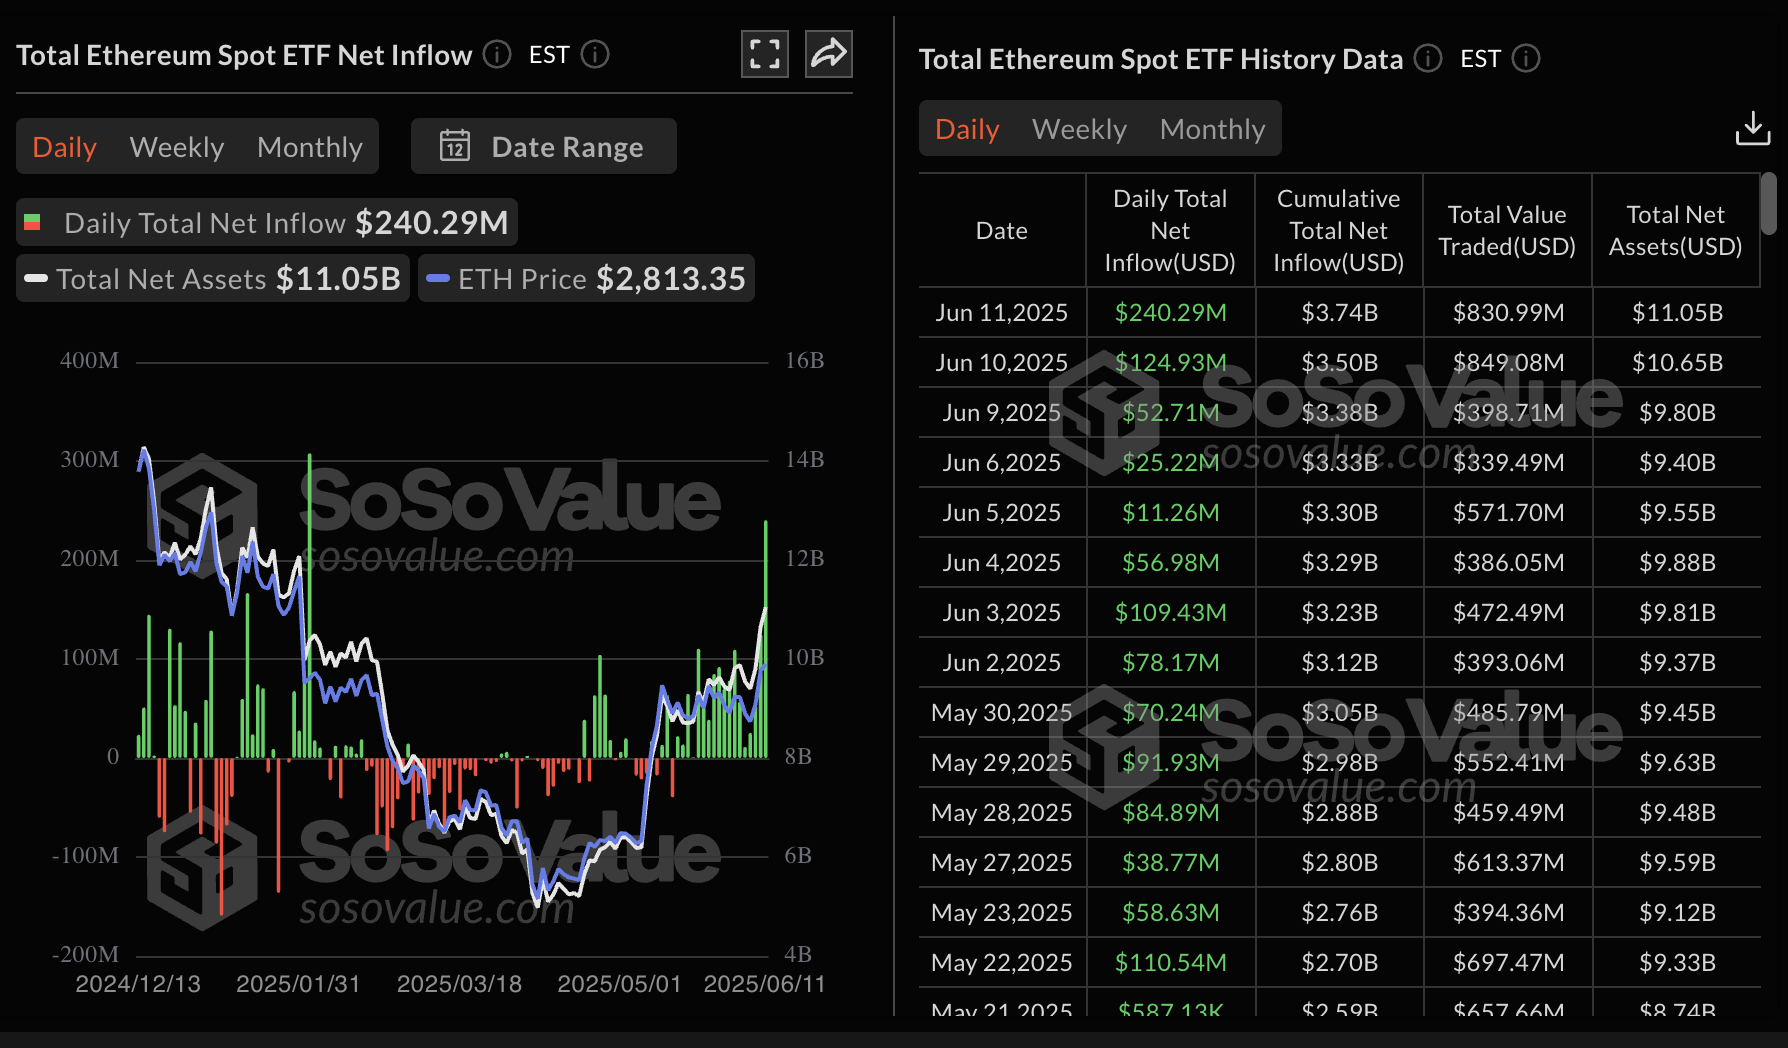
Ethereum spot ETFs stats | Source: SoSoValue
Chart of the day: Bitcoin uptrend in jeopardy amid muted funding rates
Bitcoin hovered NEAR all-time highs of $111,980 earlier this week, but market sentiment remained alarmingly cautious, possibly due to uncertainty in the macroeconomic environment.
“Funding rates and leverage indicators across platforms point to sustained defensiveness, with Binance’s BTC/USDT perpetuals averaging negative daily funding on Friday and Sunday,” a K33 Research analyst said in the report. “Over the past week, average funding rates sat at just 1.3% annualized, levels only seen near local bottoms over the last 2.5 years,” the analysts added.
At the same time, the Bitcoin futures contracts’ Open Interest (OI) has remained relatively subdued over the last few weeks, or since BTC hit all-time highs. CoinGlass data, as shown in the chart below, indicates that the OI is near $74 billion, down from approximately $80 billion as of May 23.
OI refers to the number of outstanding futures and options contracts that have yet to be settled or closed. A low or declining OI indicates that interest among traders is decreasing, and if coupled with softer trading volumes, it could hinder the price from edging higher.
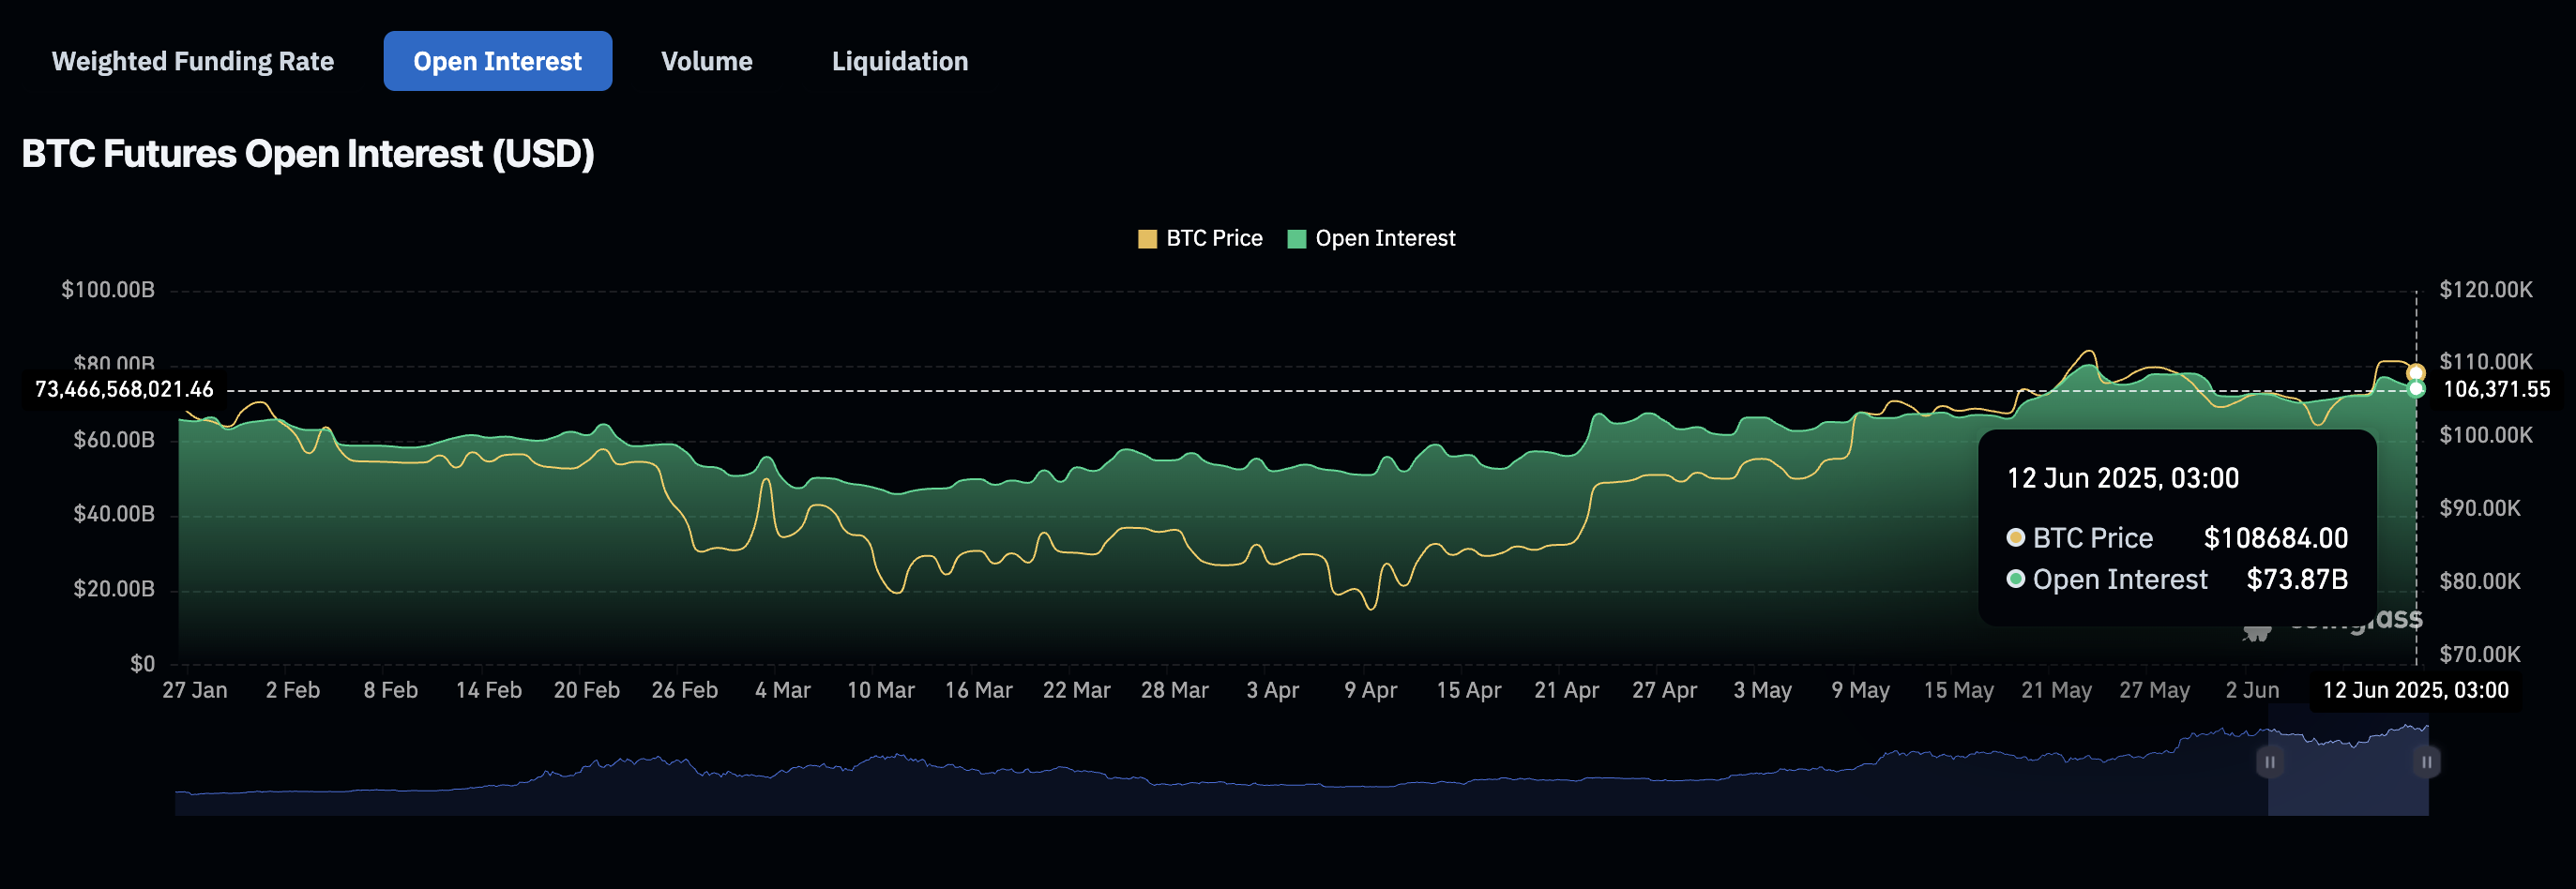
Bitcoin futures OI | Source: CoinGlass
The path of least resistance is gradually shifting downward, especially with the Relative Strength Index (RSI) falling to the 50 midline from its recent peak of 64 on the daily chart. Traders WOULD look for a confirmation of a sell signal from the Moving Average Convergence Divergence (MACD) indicator to ascertain the bearish momentum. This signal manifests when the blue MACD line crosses below the red signal line.
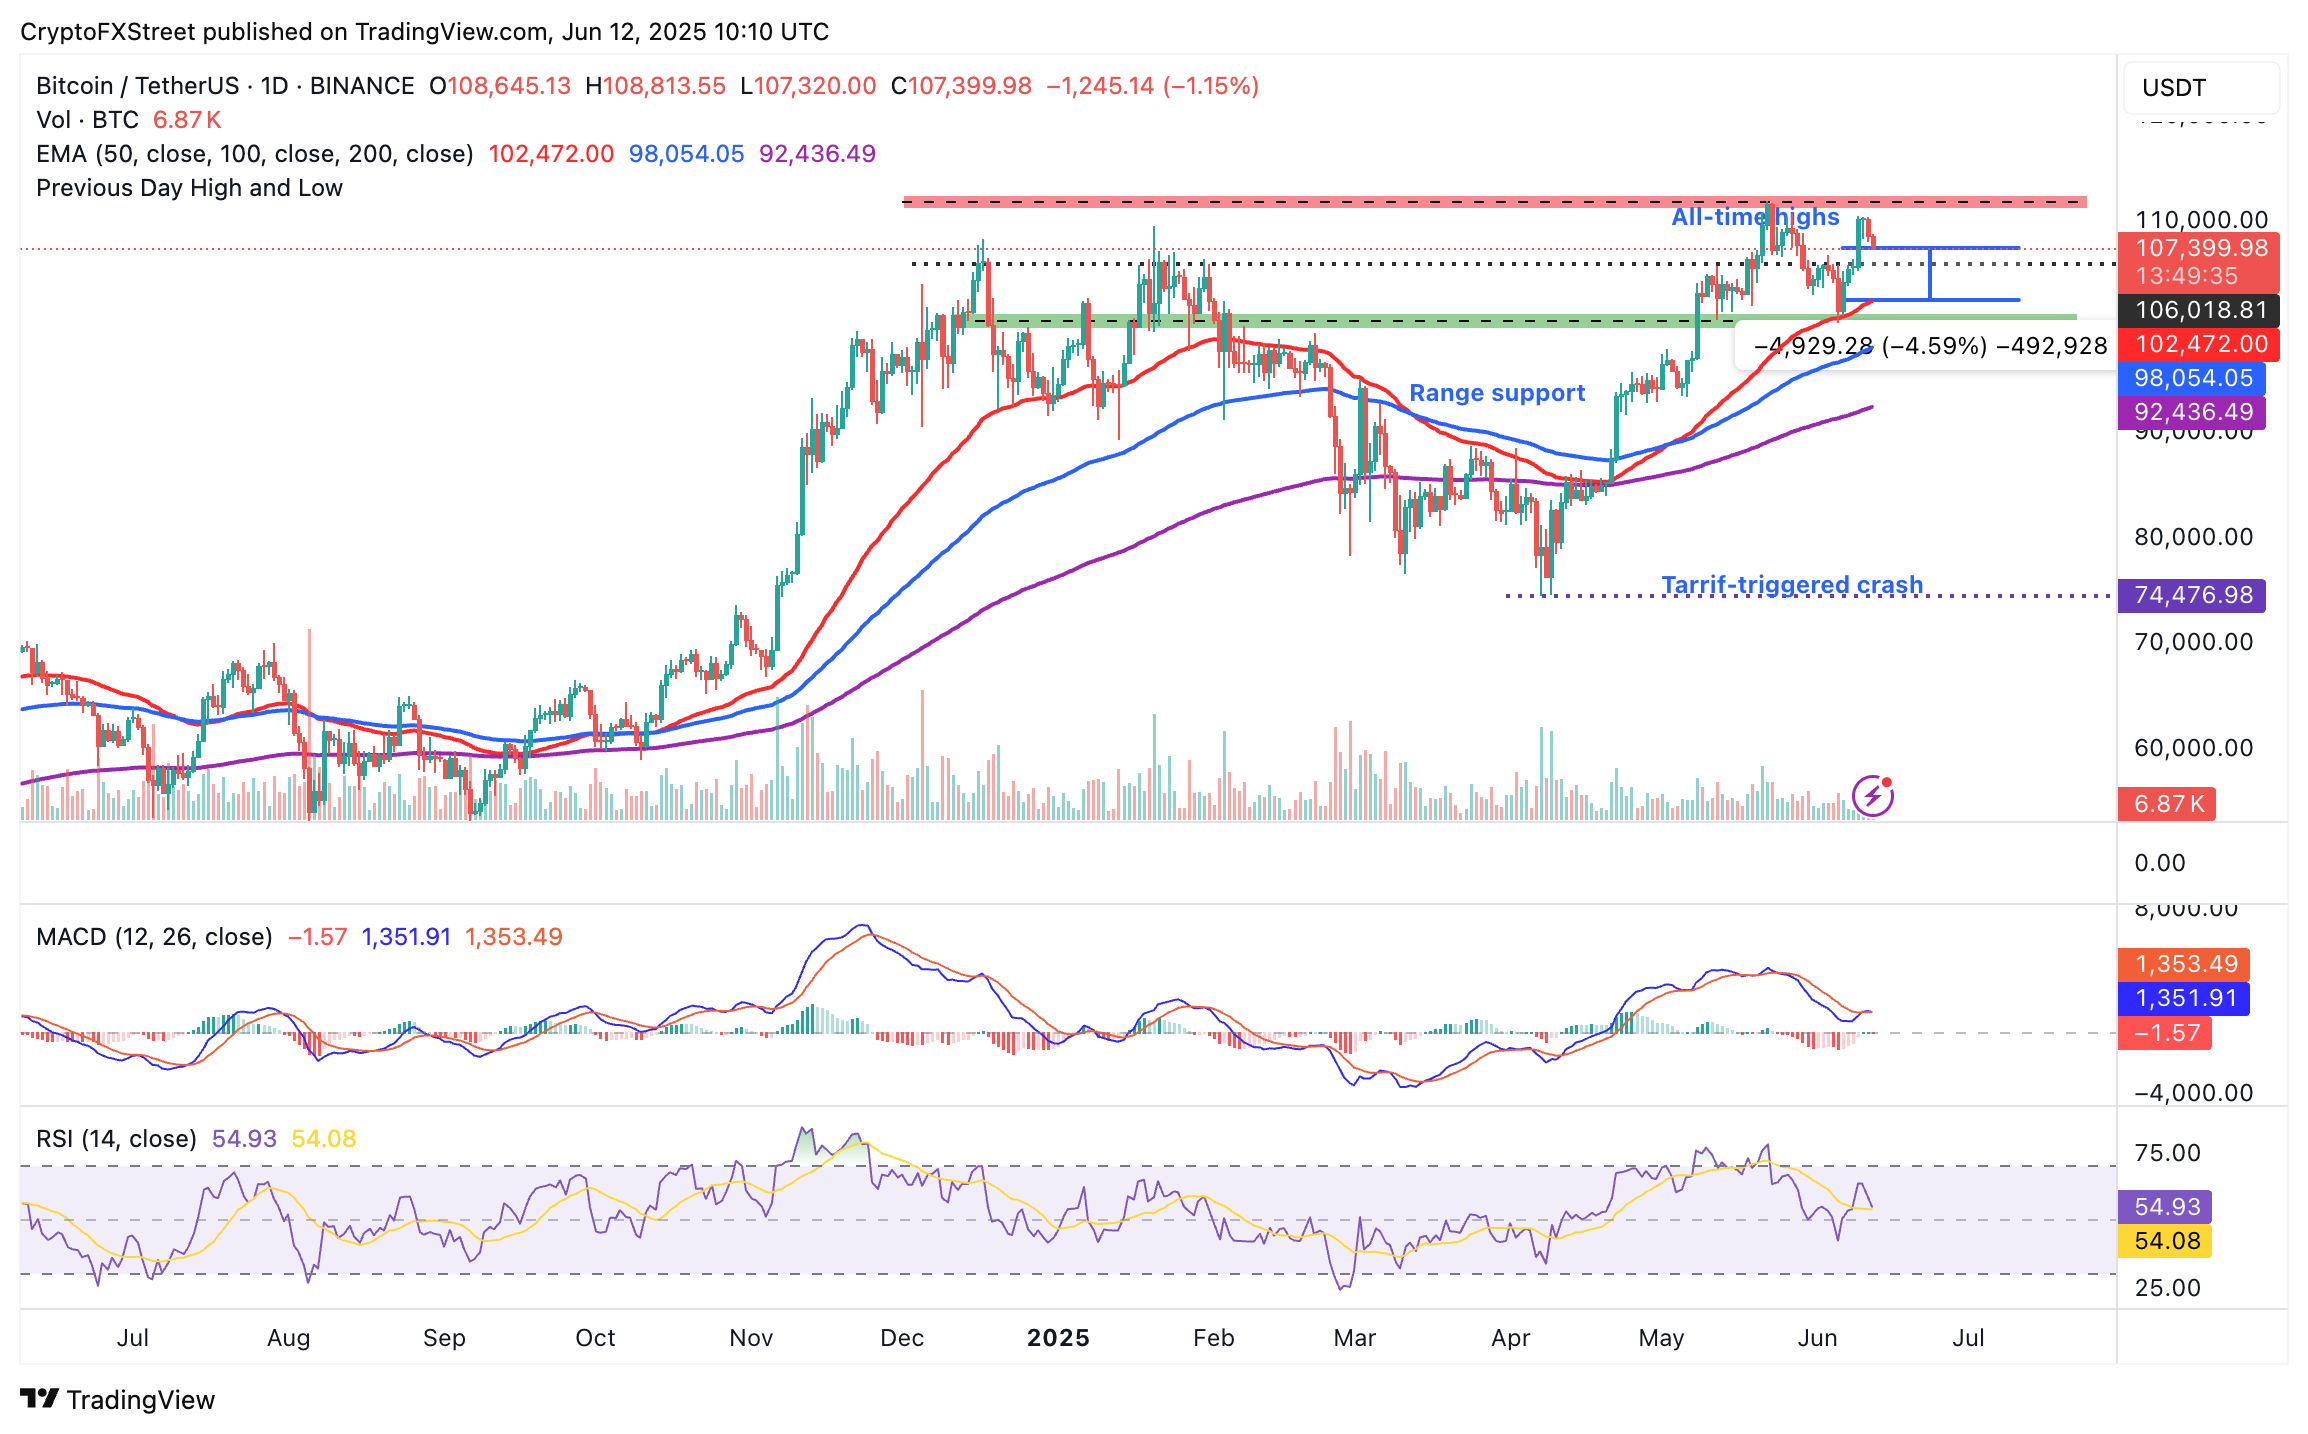
BTC/USDT daily chart
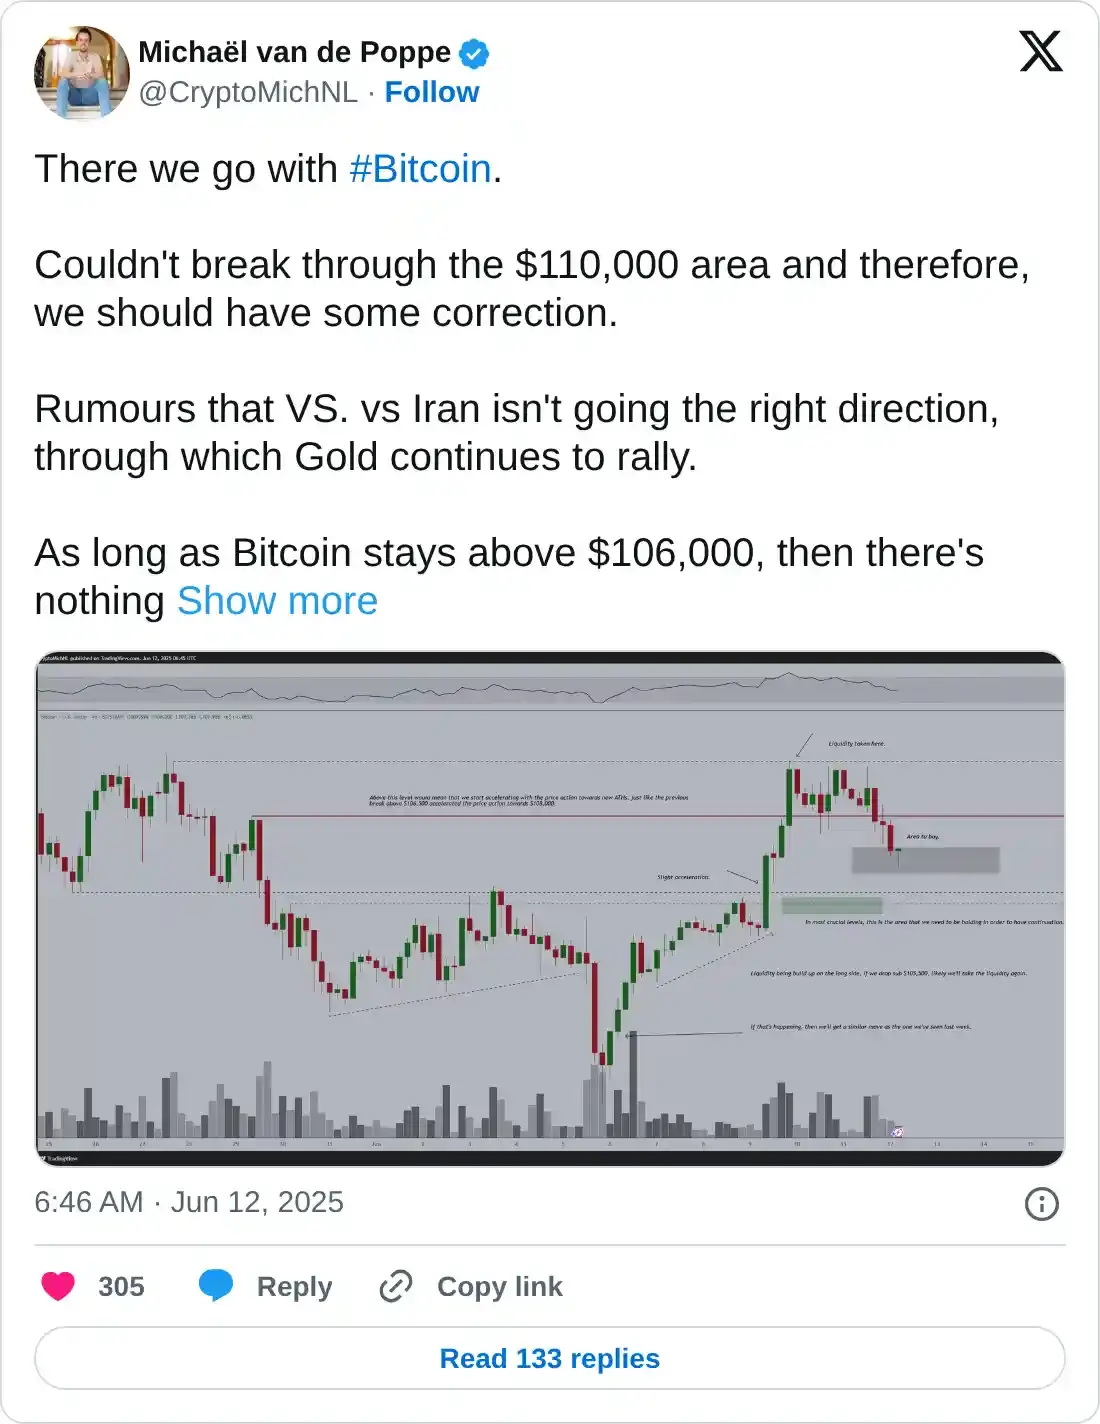
Crypto investor and analyst Michaël van de Poppe said via an X post that since Bitcoin’s price failed to gain strength above $110,000, a correction is expected. He added that as long as BTC holds above the $106,000 support level, investors don’t need to worry.
Still, it would be prudent to cautiously prepare for a sweep through the next key support at the 50-day Exponential Moving Average (EMA) at $102,472, which is 4.6% below the current price level.
Altcoins update: Ethereum and XRP offer bearish signals
The largest smart contacts token by market capitalization, Ethereum, trades at $2,747 at the time of writing, down nearly 1% on the day and 4.6% from its recent high of $2,881 reached on Wednesday.
Based on the MACD indicator, the pullback could continue, especially if traders follow the sell signal confirmed on Thursday to reduce exposure to ETH. Although the RSI holds sideways at 56, it has retreated from overbought levels, signaling that bulls may give up.
Key levels of interest to traders include the 4-hour 50-period EMA at approximately $2,646, the 100-period EMA at $2,597, and the 200-period EMA at $2,488, which are poised to act as support levels if the decline accelerates.
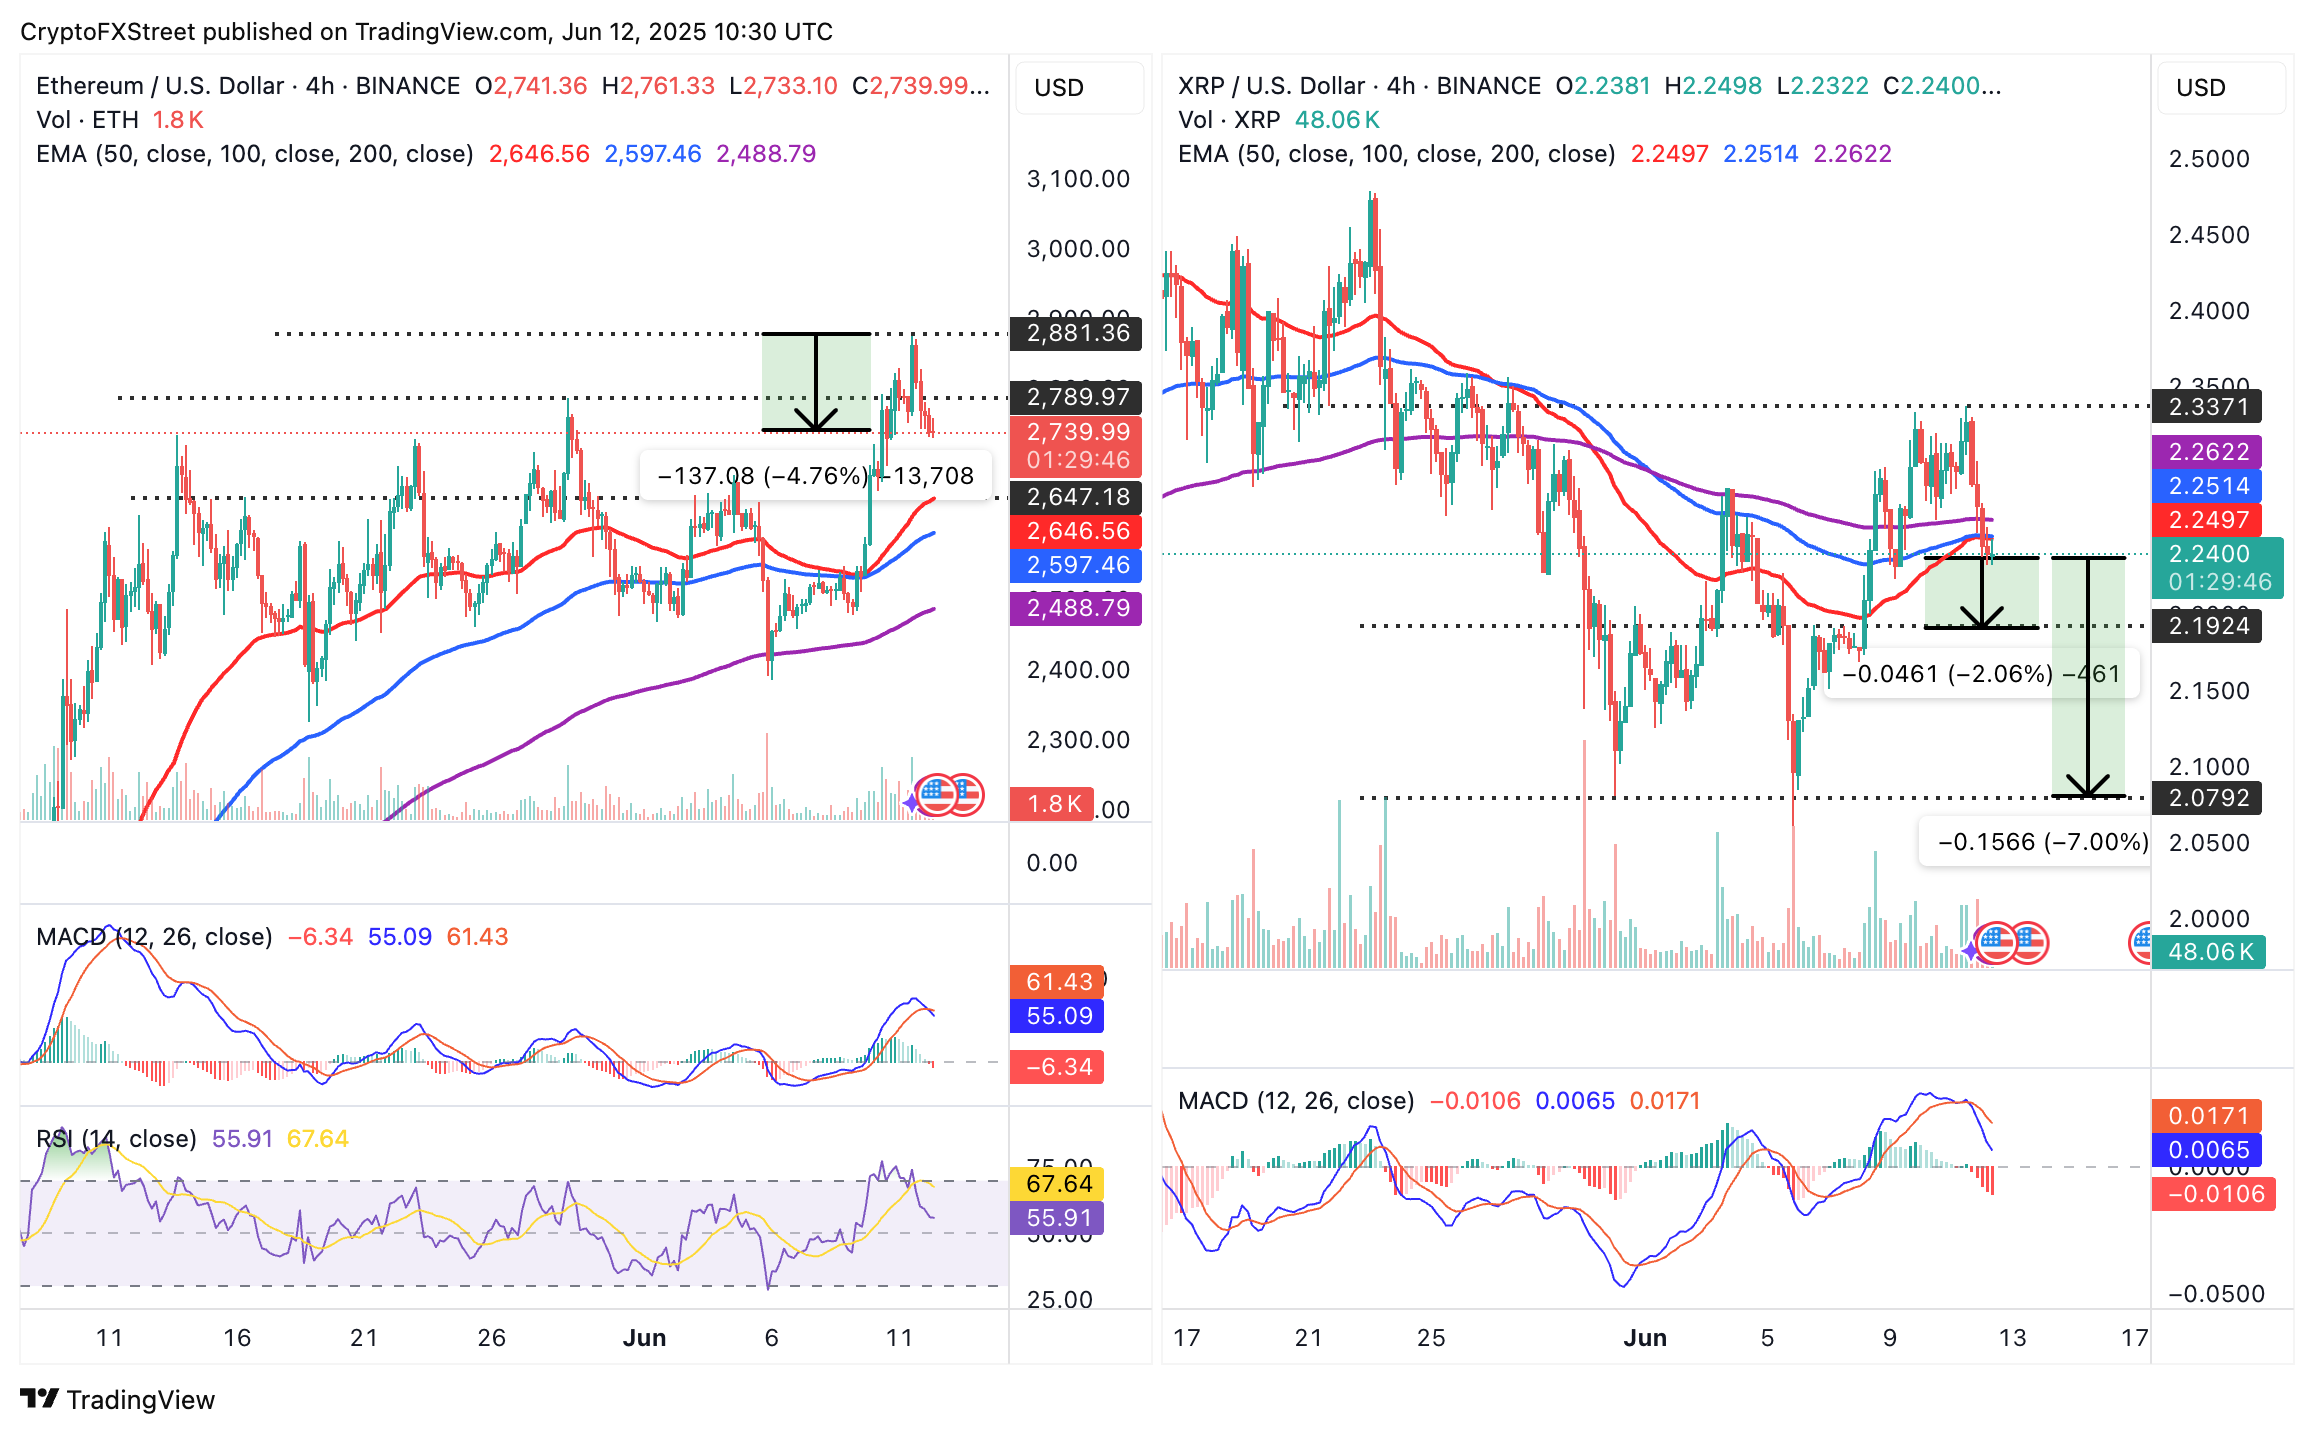
ETH/USDT & XRP/USDT 4-hour charts
On the other hand, the price of XRP remains below the 4-hour 50-period EMA, which converges with the 100-period EMA at around $2.25 to FORM a confluence of resistance. A break above this level would encounter the 200-period EMA resistance at $2.26.
The MACD sell signal, as shown on the chart above, hints at an extended downtrend. With the red histogram bars expanding below the mean line (0.00), declines could gain traction in upcoming sessions.
Areas such as $2.19, 2% below the current price, and $2.07, which holds 7% under the prevailing market level, stand out as key downside targets for XRP. The cross-border money remittance token upside remains strongly limited despite surging institutional interest and adoption.
Open Interest, funding rate FAQs
How does Open Interest affect cryptocurrency prices?
Higher Open Interest is associated with higher liquidity and new capital inflow to the market. This is considered the equivalent of increase in efficiency and the ongoing trend continues. When Open Interest decreases, it is considered a sign of liquidation in the market, investors are leaving and the overall demand for an asset is on a decline, fueling a bearish sentiment among investors.
How does Funding rates affect cryptocurrency prices?
Funding fees bridge the difference between spot prices and prices of futures contracts of an asset by increasing liquidation risks faced by traders. A consistently high and positive funding rate implies there is a bullish sentiment among market participants and there is an expectation of a price hike. A consistently negative funding rate for an asset implies a bearish sentiment, indicating that traders expect the cryptocurrency’s price to fall and a bearish trend reversal is likely to occur.

Log in to Reply
Log in to comment your thoughtsComments
Related Articles
|Square
Get the BTCC app to start your crypto journey
Get started today Scan to join our 100M+ users