FLOKI Price Alert: Whale Dump Sparks Bearish Momentum as Critical Resistance Stands Firm

Whales just pulled the rug—again. FLOKI''s price teeters as massive sell orders overwhelm buyers, proving once more that ''whale watching'' is crypto''s most dangerous spectator sport.
Key resistance holds like a bouncer at ATH club. Until it breaks, bulls are stuck paying metaphorical cover charges with no party in sight.
Remember: In crypto, ''support'' is just resistance that hasn''t been tested enough. And these whales? They didn''t get rich holding bags.
FLOKI’s large wallets offload tokens
Santiment’s Supply Distribution data projects a bearish outlook for FLOKI as large wallets are offloading FLOKI tokens. The metric indicates that the whales holding between 10 million and 100 million FLOKI tokens (blue line) have decreased from 273.27 billion on Sunday to 271.46 billion on Wednesday and have been in a consistent downward trend since early June. Historically, when large wallets reduce exposure, it has caused an increase in selling pressure and a fall in FLOKI prices.
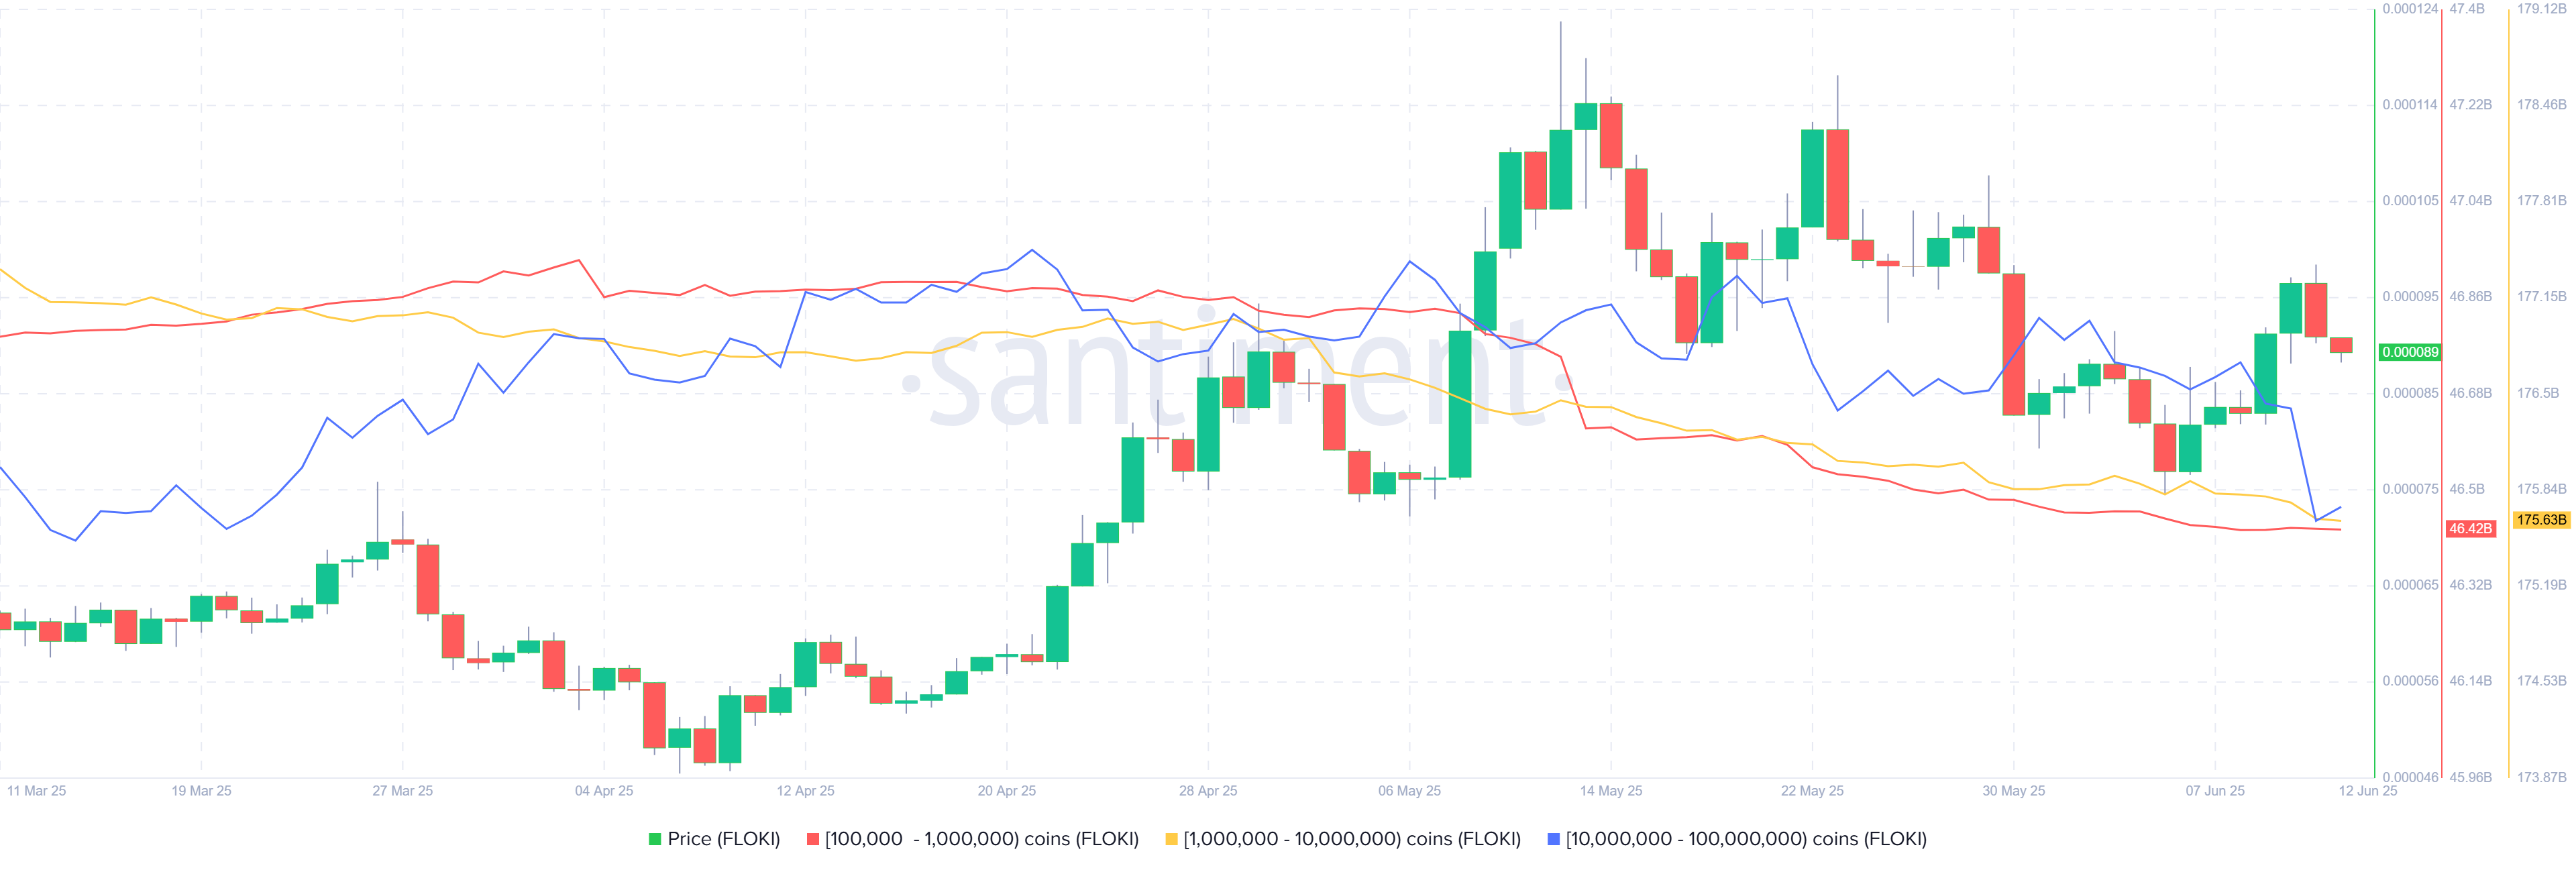
FLOKI Supply Distribution chart. Source: Santiment
Another bearish sign is Coinglass’s FlOKI long-to-short ratio, which stands at 0.74, approaching its lowest level in over a month. This ratio, below one, reflects bearish sentiment in the markets as more traders are betting on the asset price to fall.
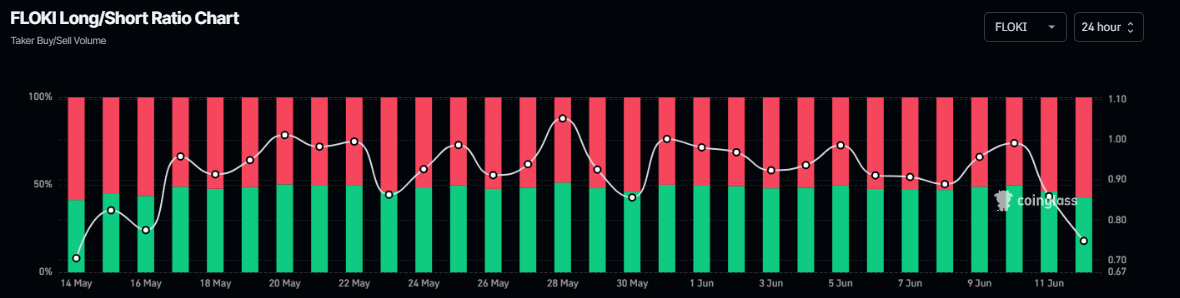
FLOKI long-to-short ratio chart. Source: Coinglass
FLOKI Price Forecast: Faces rejection from a key resistance level
FLOKI price broke below an ascending trendline (drawn by connecting multiple low levels since early April) on May 30 and declined 21% until June 5. However, the FLOKI Price recovered from its recent decline and retested key resistance levels around $0.000097-$0.000098 on Tuesday.
This resistance area roughly coincides with multiple levels, making this a key reversal zone.
On Wednesday, FLOKI faced rejection around the above-mentioned resistance level and declined 6.26%. At the time of writing on Thursday, it continues to trade down at around $0.000089.
If FLOKI continues its correction, it could extend the decline to retest its June 5 low of $0.000074.
The Relative Strength Index (RSI) indicator on the daily chart reads 49, slipping below its neutral level of 50, indicating bearish momentum gaining traction.
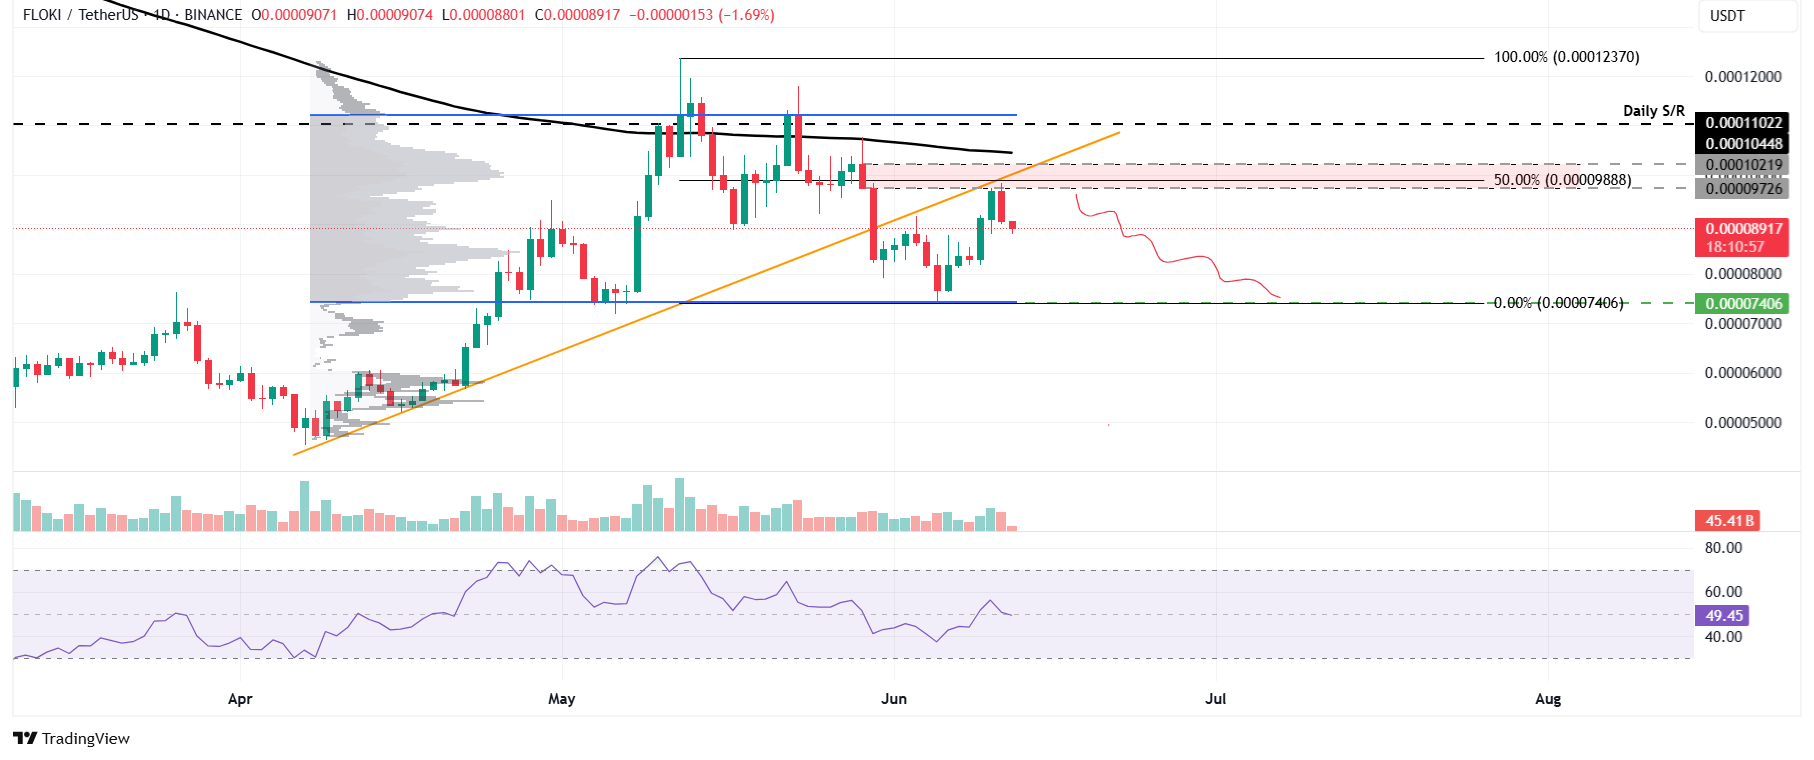
FLOKI/USDT daily chart
However, if FLOKI recovers and closes above the 200-day Exponential Moving Average (EMA) at $0.000104, the bearish thesis WOULD be invalidated. Such development could extend the recovery toward its next daily resistance at $0.000110.

Log in to Reply
Log in to comment your thoughtsComments
Related Articles
|Square
Get the BTCC app to start your crypto journey
Get started today Scan to join our 100M+ users