SPX6900 Bulls Charge Toward New All-Time High – Is This the Breakout?

SPX6900 surges as bulls take control—market eyes fresh ATH.
Momentum builds behind the index, defying skeptics and short-sellers.
Will institutional FOMO fuel the next leg up? Or is Wall Street just recycling last year’s playbook?
One thing’s clear: the charts don’t lie—until they do.
SPX6900 market cap overtakes FLOKI, WIF, and BONK
According to CoinGecko data, the SPX token has rallied by 40% over the last seven days and by 5% in the last 24 hours, with a market capitalization of around $1.50 billion. Additionally, SPX has overtaken the FLOKI, WIF, and BONK meme coin market capitalization.
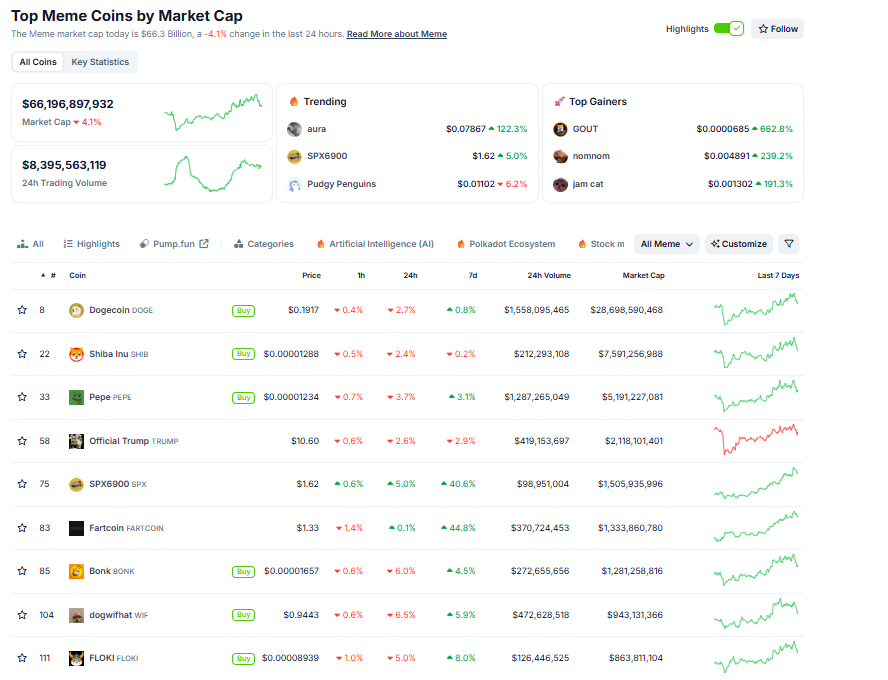
Top meme coins market capitalization chart. Source: CoinGecko
SPX6900 on-chain and derivatives data underpin a bullish outlook
Coinglass’ data shows that the futures’ Open Interest (OI) in SPX at exchanges rose from $77.05 million on Saturday to $163.19 million on Thursday, marking a new all-time high since its launch. An increasing OI represents new or additional money entering the market and new buying activity, which could fuel the current SPX6900 meme coin price rally.
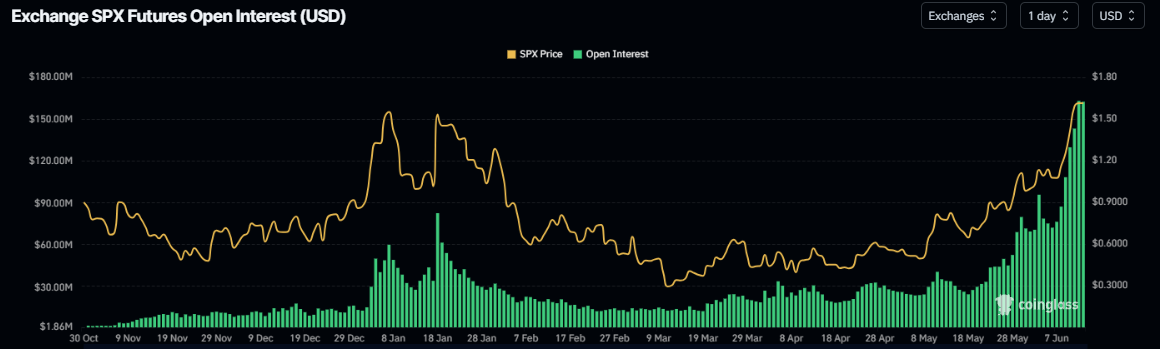
SPX6900 open interest chart. Source: Coinglass
Santiment’s Daily Active Addresses index, which tracks network activity over time, also paints a bullish picture for SPX6900. A rise in the metric indicates increased blockchain usage while declining addresses suggest lower demand for the network.
SPX’s Daily Active Addresses metric ROSE from 783 on Saturday to 2,391 on Wednesday, the highest level since January 7. This indicates that demand for SPX’s blockchain usage is increasing, which bodes well for the SPX6900 meme coin price.
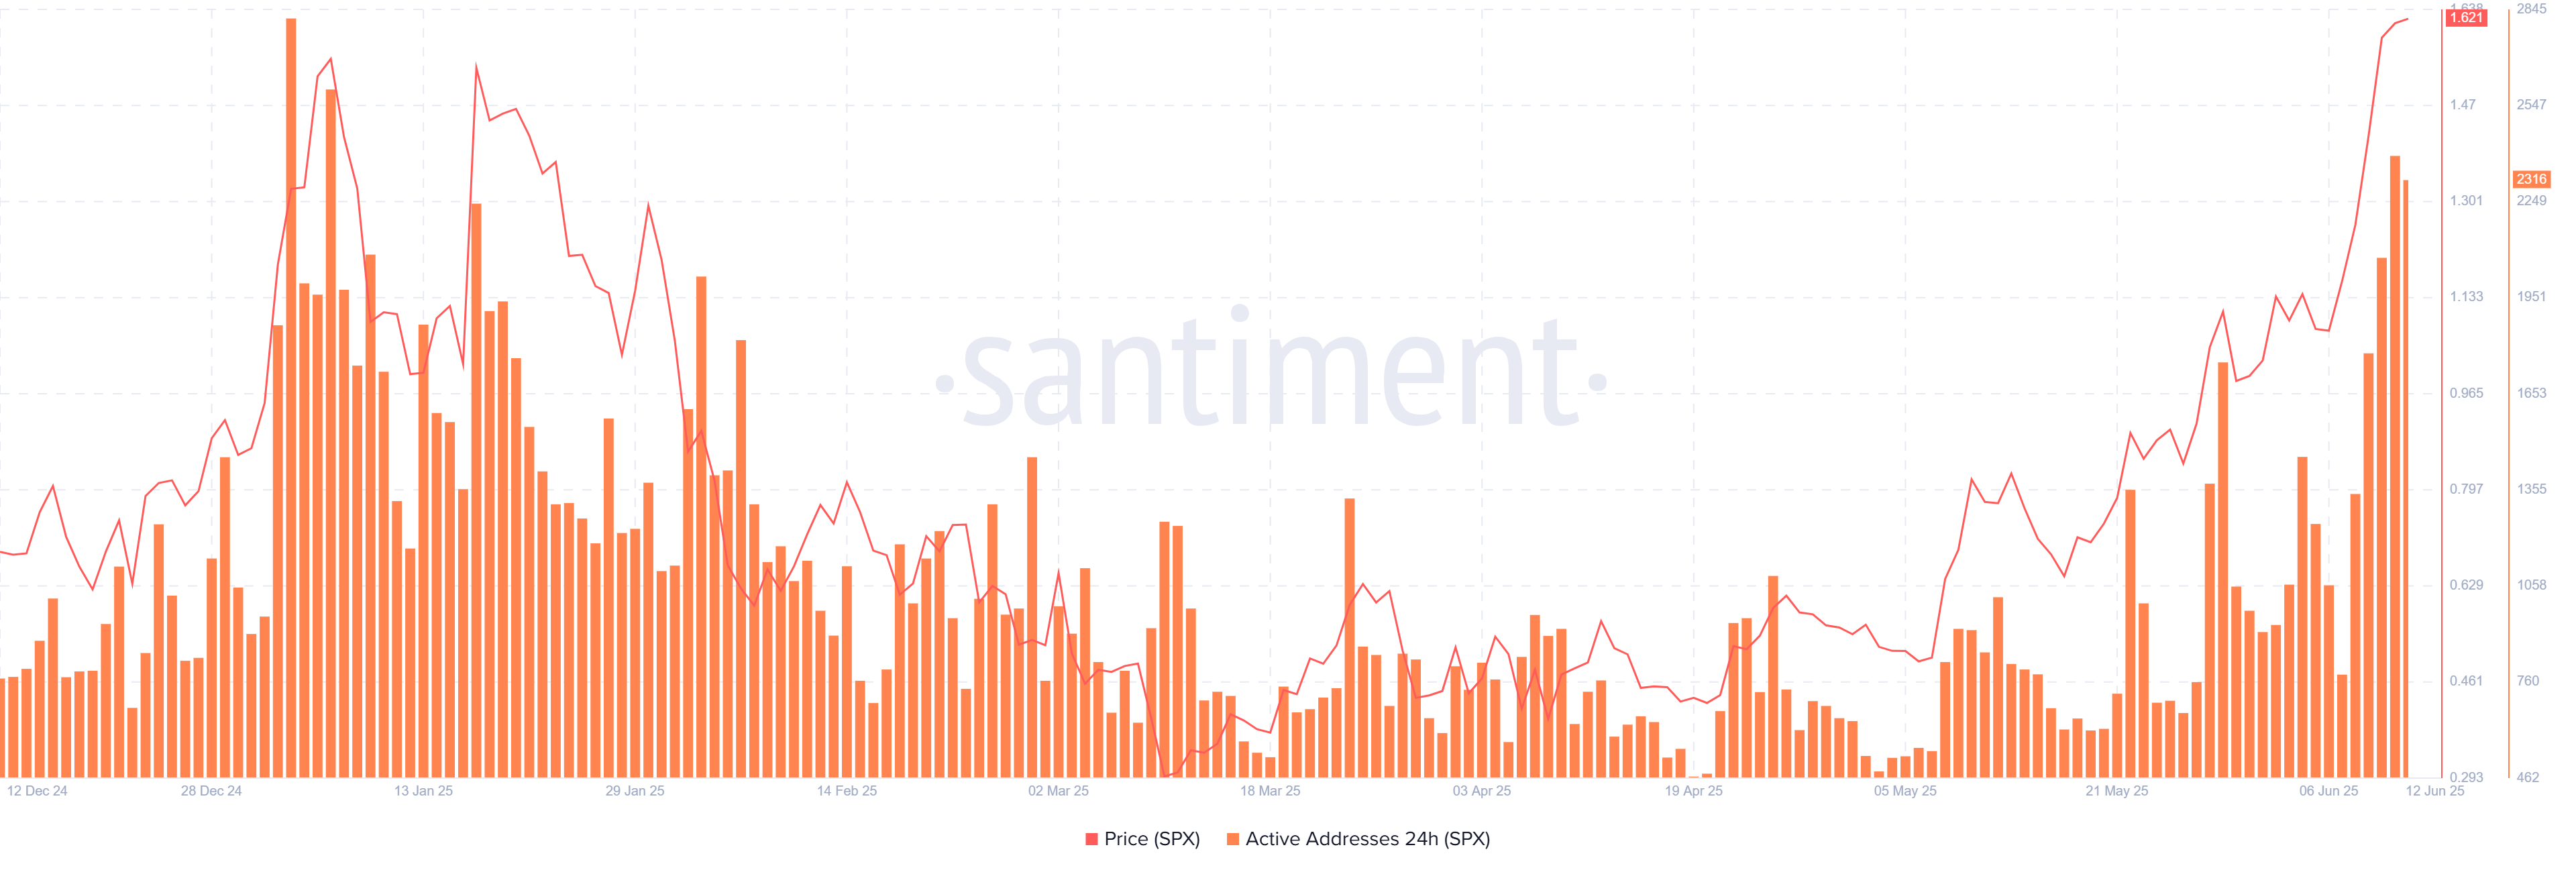
SPX daily active addresses chart. Source: Santiment
SPX6900 Price Forecast: SPX heads toward record highs
SPX6900 price broke above the ascending channel pattern at the end of May and reached its technical target at $1.47 on Tuesday. At the time of writing on Thursday, it continues to trade higher at around $1.63.
If SPX continues its upward trend, it could extend the rally toward its all-time high of $1.77. A successful close above this level could extend the gains to test its psychologically important level at $2.00.
The Relative Strength Index (RSI) indicator on the daily chart reads 81, above its overbought level of 70, indicating strong bullish momentum. However, traders should be cautious, as the chances of a pullback are high due to its overbought conditions.
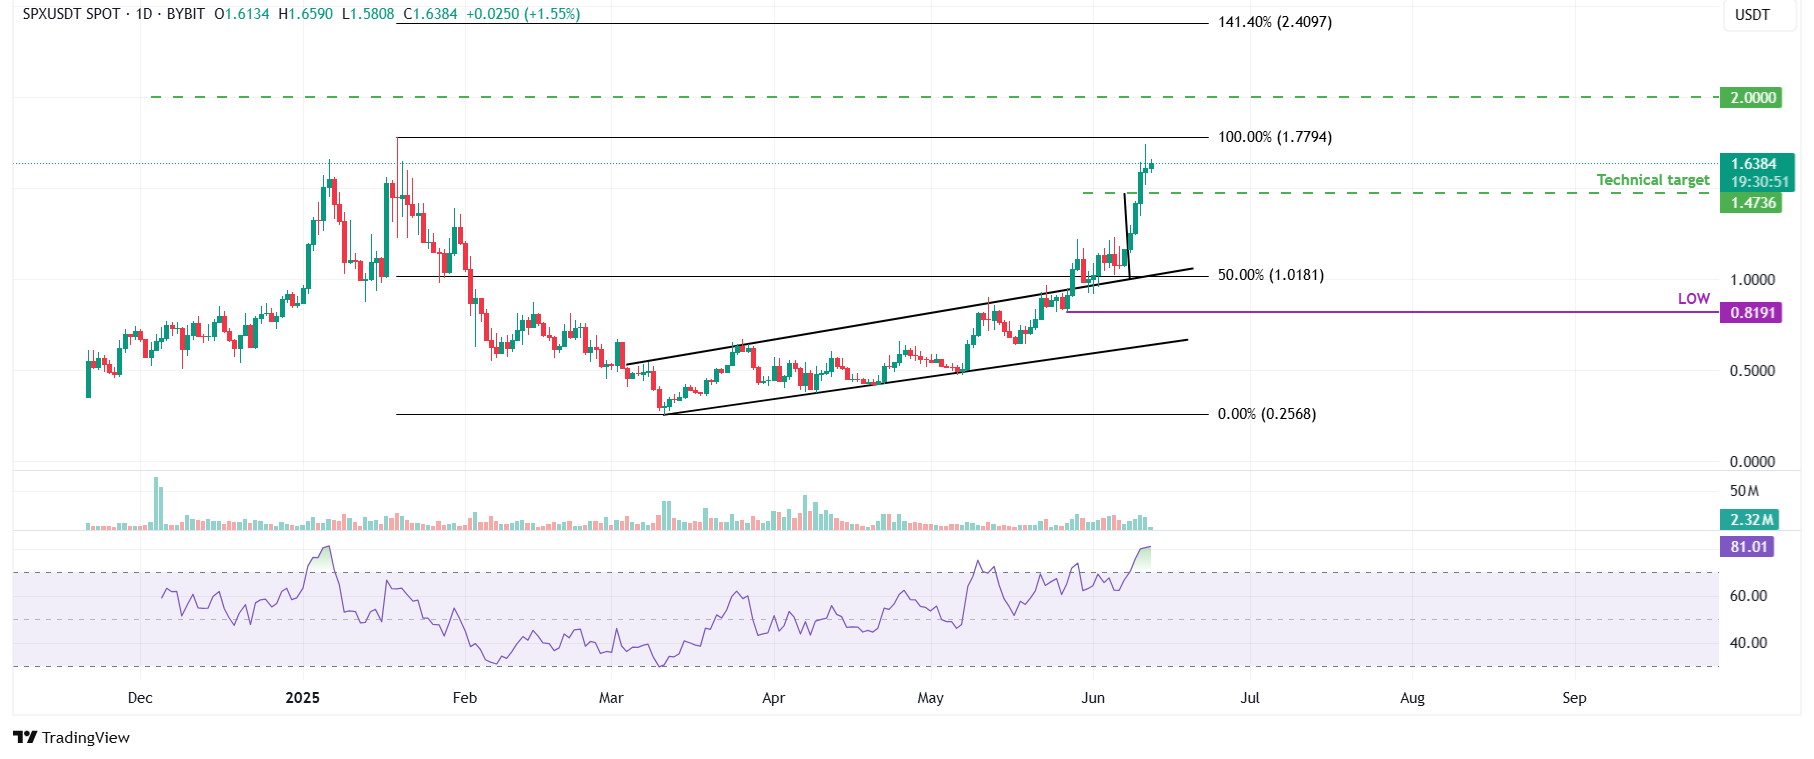
SPX/USDT daily chart
However, if SPX faces a pullback, it could extend the decline to retest its Tuesday low of $1.34.

Log in to Reply
Log in to comment your thoughtsComments
Related Articles
|Square
Get the BTCC app to start your crypto journey
Get started today Scan to join our 100M+ users