Litecoin Price Forecast: LTC Battles Key Resistance as Bearish Sentiment Peaks

Litecoin bulls hit a wall—again. The silver to Bitcoin''s gold keeps testing a stubborn resistance level while short positions pile up at their highest in 30 days. Is this the calm before a breakout or just another fakeout?
Why traders are flipping bearish
Market sentiment''s turned frosty despite Litecoin''s recent network upgrades. Whale wallets aren''t accumulating, and derivatives markets show hedges stacking up faster than DeFi rug pulls in 2021.
The make-or-break level
All eyes on that $92 resistance—a number that''s become Litecoin''s own personal Groundhog Day. Three rejections this month alone. Meanwhile, Bitcoin''s flirting with new highs while LTC plays catch-up like a boomer chain watching Gen-3 blockchains sprint ahead.
Watch the futures curve
Contango''s narrowing as leveraged longs get squeezed. Either we see a violent flush of weak hands or... (wait for it)... yet another ''accumulation phase'' narrative from bagholders. Place your bets—the house always wins.
Litecoin''s bearish bets reach the highest level in over a month
According to Coinglass''s data, the long-to-short ratio of Litecoin reads 0.82. This ratio, below one, reflects bearish sentiment in the markets, as more traders are betting on the asset price to fall.
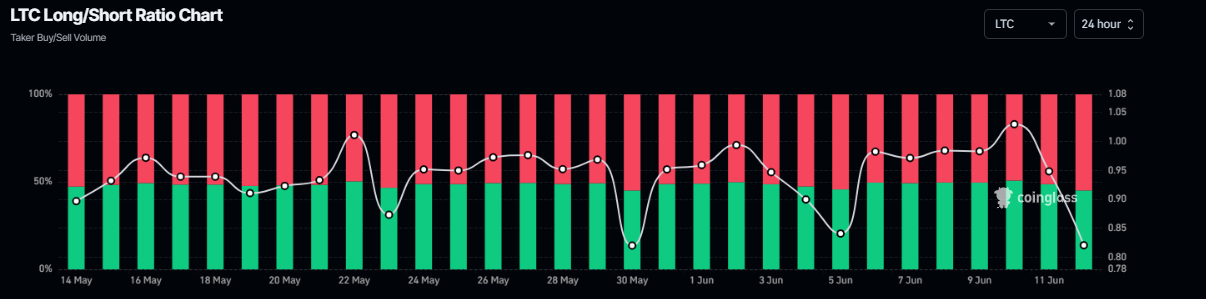
LTC long-to-short ratio chart. Source: Coinglass
Litecoin Price Forecast: Dead-cat bounce scenario develops
Litecoin price broke and closed below its ascending trendline (drawn by connecting multiple lows since early April) and its 200-day Exponential Moving Average at $93.30 on May 30 and declined 8.2% until June 5. However, it had a short-term price recovery in the next 5 days and retested the 200-day EMA at $93.30. On Wednesday, LTC experienced a dead-cat bounce scenario—a brief price increase within a broader downtrend—facing rejection from the 200-day EMA level at $93.30. This level roughly coincides with the 50% price retracement level at $95.18, making these levels a crucial reversal zone. At the time of writing on Thursday, it edges slightly at around $91.25.
Sidelined investors looking to short LTC can do so between the $93.30 and $95.18 ranges, with the stop-loss set slightly above its weekly resistance at $96.30.
If LTC faces correction from the levels mentioned above, it could extend the decline to retest its Saturday low of $83.31. A successful close below this WOULD extend the losses to retest the next weekly support level at $77.19.
The Relative Strength Index (RSI) on the daily chart hovers around the neutral level of 50, indicating indecisiveness among traders. For the dead-cat bounce scenario to play, the RSI must MOVE below its neutral level of 50 for the bearish momentum to be sustained.
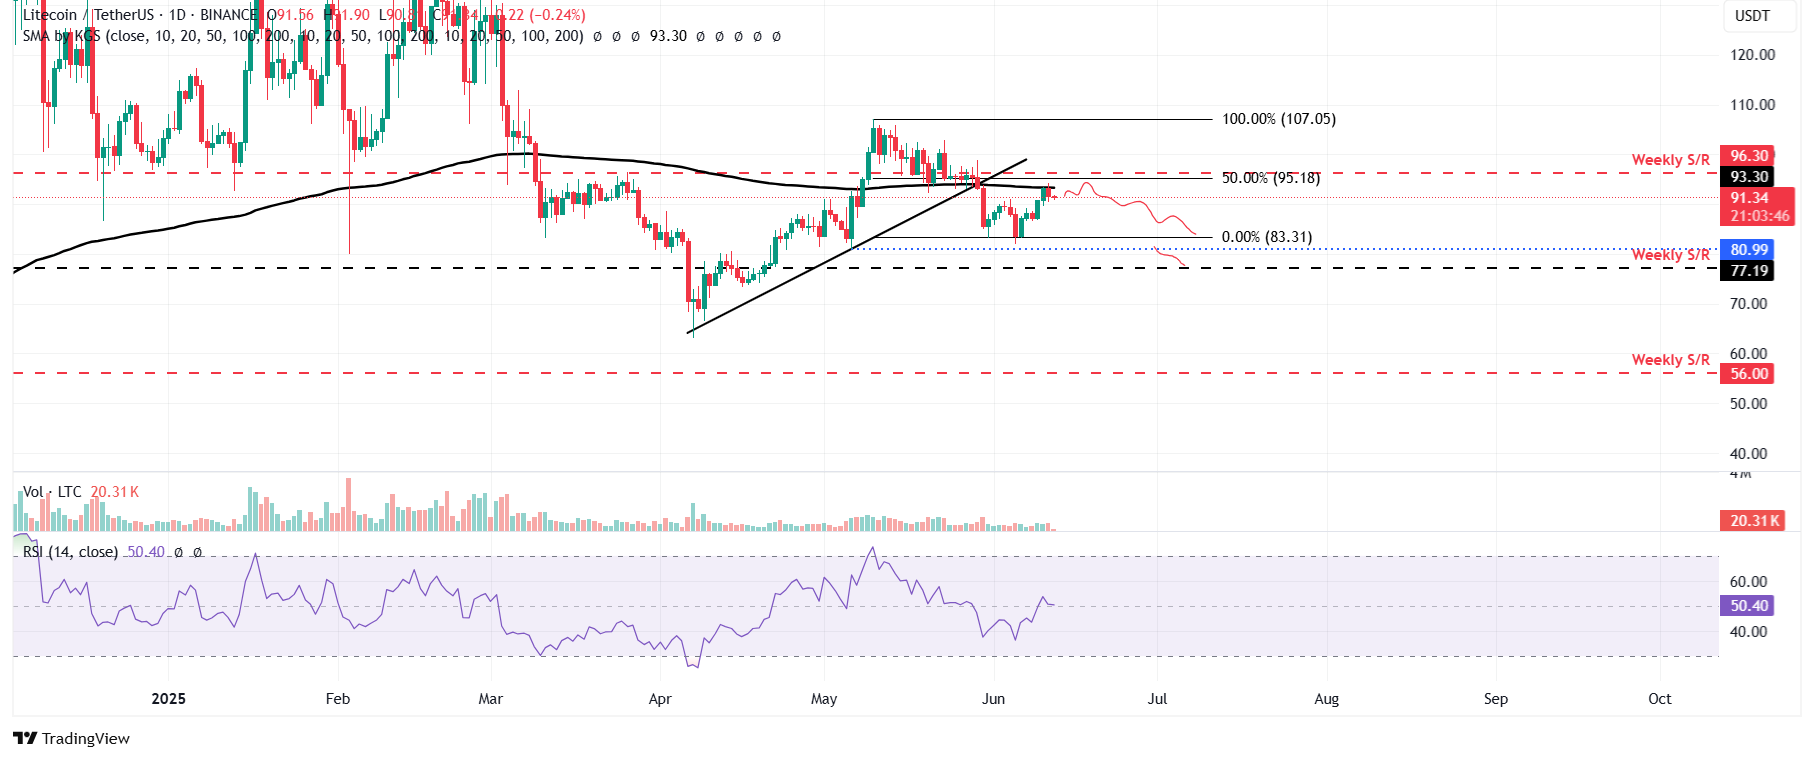
LTC/USDT daily chart
However, if the Litecoin price closes above the weekly resistance at $96.30, the bearish thesis would be invalidated. Such a scenario could extend the rally toward the May 10 high of $107.05.

Log in to Reply
Log in to comment your thoughtsComments
Related Articles
|Square
Get the BTCC app to start your crypto journey
Get started today Scan to join our 100M+ users